Kepler Trust report: The Renewables Infrastructure Group
TRIG seeks to provide long-term, stable dividends from a portfolio of renewable energy assets.
27th October 2019 11:33
This content is provided by Kepler Trust Intelligence, an investment trust focused website for private and professional investors. Kepler Trust Intelligence is a third-party supplier and not part of interactive investor. It is provided for information only and does not constitute a personal recommendation.
Material produced by Kepler Trust Intelligence should be considered a marketing communication, and is not independent research.
TRIG seeks to provide investors with long-term, stable dividends from an increasingly diversified portfolio of renewable energy assets.

William Heathcoat Amory is the founder of Kepler Trust Intelligence.
Summary
The Renewables Infrastructure Group (LSE:TRIG) is a play on the burgeoning renewable energy sector. It differentiates itself from the other funds in the sector by being a non-specialist fund (wind, solar and battery storage so far) but with a remit to invest across the UK and in European countries where the directors and managers believe there is a stable renewable energy framework.
Recently TRIG has announced a further extension of this policy, and the board is seeking shareholder approval to increase the proportion of assets the company can invest in Europe from 50% to 65%.
TRIG invests in assets which offer attractive long-term cash flows, elements of which are linked to inflation. The aim of the company is to provide long-term, stable dividends for shareholders, with any surplus cash flows after debt amortisation being re-invested to help maintain the capital value of the investment portfolio. The current portfolio, when fully built out in 2020, will be represented by 71 projects, with net capacity of 1.5GW.
This is equivalent to 1 million UK homes or 1% of the total electricity generated in the UK.
Wind is currently the largest component of the portfolio (86% by value). However in the company’s recent announcement the managers state that to further diversify the portfolio they are considering investing in unsubsidised solar plants in Iberia, taking advantage of steeply declining capital costs and high solar resource. Solar provides a natural complement to wind technologies, given its peak electricity generation is during the summer months, while for wind peak generation occurs in the winter.
The push to invest overseas has gathered pace over the last couple of years, and during the 2018 calendar year 77% of new investments by value were made outside the UK. For the six months to end-June 2019, the company has invested in five projects, all of which are overseas (in Sweden, France and Germany). In total, 45% of the portfolio is currently invested outside the UK, up from 28% at the end of 2018.
TRIG has a progressive dividend policy. The company’s dividend has increased each year since launch, at an average compound annual rate of 1.8% pa. Every year the board sets a dividend target for the following year, payable in four equal installments. The current dividend target is 6.64p per share, equivalent to a yield of 5.1% at the current price and representing an increase of 2.2% from 2018.
The company has delivered strong and consistent returns since inception. Over the past five years, it has outperformed the FTSE All Share index on a NAV total return basis, but with lower volatility. Since its initial public offering (IPO) in 2013 the company has delivered total shareholder returns of 10.4% per annum (to 30 June 2019).
TRIG currently has long-term gearing of approximately 36% of portfolio enterprise value, all of which is all held at the project level. This is at the low end of the peer group. The longer-term debt is amortised over the life of each asset’s specific subsidy regime, which de-risks these assets over time (unsubsidised assets are not geared).
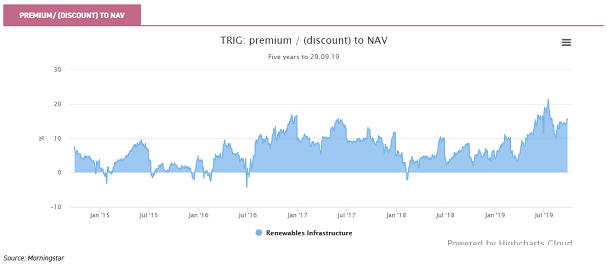
The company continues to enjoy robust demand for its shares. Currently the share price premium over NAV is around 14%, a slight premium to the sector average premium of 12.7% (Source: Numis).
Portfolio
The Renewables Infrastructure Group (TRIG) has always positioned itself as a one-stop shop for the burgeoning renewable energy sector. It differentiates itself from the other funds in the sector by being a non-specialist fund (wind, solar and battery storage so far), but with a remit to invest across the UK and Europe.
Recently TRIG has announced a further extension of this policy, and the board is seeking shareholder approval to increase the proportion of assets the company can invest in Europe from 50% to 65%. We discuss the motivations behind this change later in this section.
From the top down, TRIG invests in assets which offer attractive projected long-term cash flows, elements of which are linked to inflation. The aim of the company is to provide a long-term, stable and sustainable dividend for shareholders, with any surplus cash flows after debt amortisation being re-invested to help maintain the capital value of the investment portfolio.
As at 30 June 2019 the portfolio had an average operating history (weighted by net capacity) of six years. The company estimates that portfolio average economic lives will be 29 years for its wind assets and 30 years for its solar assets. As such TRIG’s portfolio has a weighted average remaining life estimated at 23 years.
TRIG has a small number of construction assets (7% of the portfolio, relative to a maximum of 15%). The managers believe there is a pricing advantage in investing into projects that are not yet built. The current portfolio, when fully built out in 2020, will be represented by 71 projects, with net capacity of 1.5GW.
This is equivalent to 1 million UK homes or 1% of the total electricity generated in the UK. In the chart below we reproduce the breakdown of the assets by generation technology, which highlights that onshore wind remains the largest electricity generation source (measured by capacity) in the portfolio.
Wind is clearly the largest component of the portfolio (86% by value), but in the company’s recent announcement the managers stated that they are considering investing in unsubsidised solar plants in Iberia which would further diversify the portfolio. Solar provides a natural complement to wind technologies, given its peak electricity generation is during the summer months, while for wind assets peak generation occurs in the winter.
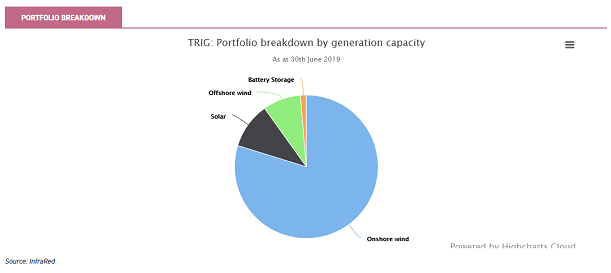
As the graph above shows, battery technologies remain a very small part of the portfolio. The UK’s ‘brown-out’ during the summer of 2019 has undoubtedly drawn attention to the growing intermittency of the UK’s power supply. So when we met up with the managers of TRIG recently, they highlighted this area as one where they expect more investment opportunities in future. The company’s existing investment in this area – the Broxburn battery storage site – kicked in during the 2019 brown-out and provided power to the grid, as it is designed to do. Still, the managers observe that there are clearly not enough battery assets yet available to fully mitigate problems such as those encountered last summer.
The Broxburn asset is a 20MW battery with a medium-term contract to provide balancing services to the UK grid, signed in June 2018. TRIG is using this asset as a means to better understand the revenue opportunities for future energy storage applications. The objectives are to identify viable ‘traded’ business models, where revenue and value are obtained through buying and selling energy to profit from spreads and volatility in the wholesale and balancing energy markets. TRIG’s managers expect that, over time, they will be increasing exposure to battery assets, and that those assets may well be co-located with traditional energy generation plants, rather than necessarily with renewable ones.
The push to invest overseas has gathered pace over the last couple of years, and during the 2018 calendar year, 77% of new investments by value were made outside the UK. For the six months to end-June 2019, the company has invested in five projects, all of which are overseas (in Sweden, France and Germany). In total, 45% of the portfolio is currently invested outside the UK, up from 28% at the end of 2018.
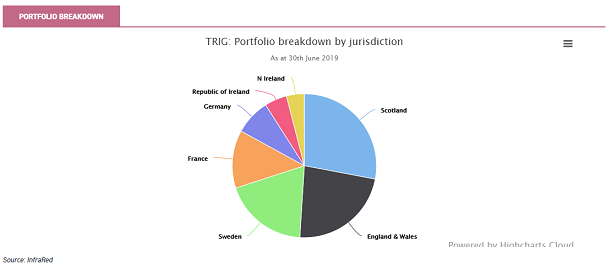
Arguably, investing overseas has both positives and negatives. It certainly brings diversification, but currency fluctuations can also present problems, especially when the company is trying to pay a progressive dividend.
TRIG seeks to mitigate these risks by hedging between 50% and 60% of its overseas capital exposure, through a combination of balance sheet and income hedges. As we note above, the company continues to build out its overseas exposure, and currently has exposure to seven jurisdictions and five power markets (Northern Ireland and the Republic of Ireland represent a single electricity market).
In investing overseas, the team is able to take advantage of the European reach that is available from both RES and InfraRed. Accordingly, based on the recent results, the portfolio discount rate has narrowed further, from 7.6% to 7.5% over the six months to 30 June 2019, reflecting demand from investors for renewable assets. Part of TRIG’s drive to invest more overseas has been driven by recognition that, if the company is to continue to deliver high returns in the future, it needs to shop elsewhere. This is due to what the managers see as an increase in the scarcity premia associated with UK deals.
In this regard, the managers note that they are examining new markets where the onset of grid parity allows the development of renewables without subsidies, which will open up further opportunities. Subsidy-free investments allow the company to invest in parts of Europe (such as Spain) where the conditions for renewable energy are most suitable but have hitherto been too politically risky for subsidised projects.
The managers have stated that they will aim to mix subsidy-free and pure-subsidy assets in proportion, such that the company’s current sensitivities to electricity prices remain broadly unchanged (see returns section).The scale of TRIG as an institution is a key factor in enabling it to achieve this aim.
The company’s most recent acquisitions illustrate this pattern. Jädraås, the company’s largest investment to date (completed in February 2019), is located in Sweden and has total capacity of 212.9MW.
It is unsubsidised, and the majority of revenues will come from power sales. It is worth noting that there are hedging agreements in place for five years, covering 70% of expected output. Given high average wind speeds and the low cost of land, the capacity utilisation of wind farms (and therefore the economics) in Sweden are that much better than other comparable locations.
This investment has been balanced by a series of smaller investments made by the company this year in France and Germany which are within the Contracts for Difference (CfD) and Feed-in Tariff (FIT) regimes, and which have low linkage to power prices. We discuss the company’s overall exposure to different revenue streams in the dividend section.
TRIG’s management team highlights three fundamental themes driving the sector, including: acceleration of the energy transition; increased diversification of renewables; and reduced subsidy support for new projects as renewables reach grid parity. In their view, this last development is likely to offer new and potentially higher return opportunities in Europe which could potentially benefit TRIG, in combination with subsidised assets, to maintain its key portfolio sensitivities at consistent levels.
Gearing
The company currently has overall gearing in the region of 36%. TRIG typically employs gearing in two ways. The first is longer-term project finance type debt that sits within the SPVs used to purchase and own TRIG’s assets. This type of gearing represented 36% of gross assets as at 30 June 2019, and is limited to 50% of portfolio enterprise value.
The average cost of this debt is around 3.8% currently. On an asset by asset basis, this type of gearing is paid down over the duration of the subsidy regime. As such, gearing will be at zero towards the end of each project’s life. This type of gearing has very limited exposure to interest rate changes, and the cost of the debt reflects the time when the asset was first purchased by its respective SPV.
Project finance debt is the way infrastructure projects have traditionally been funded, and has both advantages and disadvantages. Advantages are that it is non-recourse, that the debt is amortising (i.e. being paid off over time), and that it perfectly matches the duration of the assets (or, in the case of renewable assets, the subsidy period).
The disadvantage is that it is less flexible. In the unlikely event of a major problem with an asset, this could result in the cash flows within that SPV being 'locked up' and not available for TRIG to pay as a dividend or reinvest (although at least this would be restricted to the affected debt package and would not impact the rest of the portfolio).
TRIG also has the ability to borrow at corporate level. In the same way that many other infrastructure funds grow, the company typically acquires assets using this shorter-term gearing facility, and then repays the borrowing from the proceeds of share issuance. This gearing is limited to the lower of 30% of portfolio value or £340 million (the current facility which expires in December 2021). As at 30 June 2019, the revolving credit facility was not drawn down, although it is worth remembering that at this time TRIG had outstanding commitments to projects representing £417 million.
Relative to peers which do not use project finance debt (such as Greencoat UK Wind (LSE:UKW)), TRIG’s SPVs employ amortising debt over the life of the project, which generates less cash flow for reinvestment than the likes of Greencoat. On the other hand, this approach does represent a de-risking exercise over the life of the projects and ensures that shareholders do not have repayment risk. It is worth noting that unsubsidised assets are bought unleveraged.
Performance
TRIG’s stated purpose is to generate sustainable returns from a diversified portfolio of renewables infrastructure that contributes towards a zero-carbon future. The investment objective is to provide an attractive, long-term, income-based return with a positive correlation to inflation.
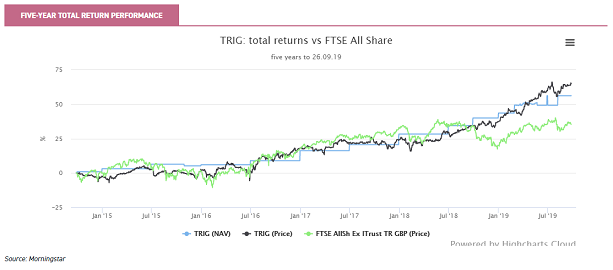
In NAV total return terms, the company has delivered strong and consistent returns since inception. Indeed, the only significant NAV reduction since the IPO was driven by politics and the regulators, in 2015 when the UK government removed the Levy Exemption Certificates for renewables. As the graph below shows, over the past five years, the company has outperformed the FTSE All Share index on a total return basis, but with lower volatility. Since its 2013 IPO the company has delivered total shareholder returns of 10.4% per annum (to 30 June 2019).
We discuss the dividend returns in greater detail in the dividend section, and the share price premium in the discount section. It is the managers’ job to manage the assets such that they deliver the target dividend, but also to maximise the value of the assets and their ability to generate revenues. Solar irradiation and wind speeds do vary on a yearly basis, but over longer time frames their variability is not particularly significant. Short-term variations will impact dividends and cash generation, but it is changes to long-term assumptions that have the most impact on NAV.
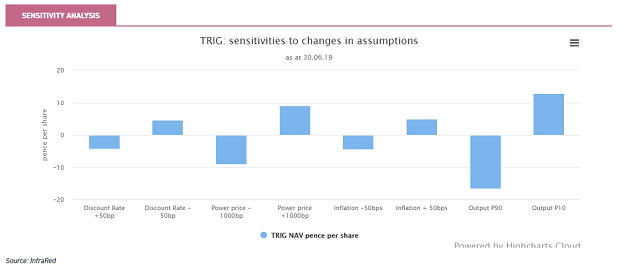
The most recently published estimates of the company’s sensitivities are shown in the graph below. Compared to solar funds, the company is less sensitive to changes in the discount rate, thanks to the relatively higher rate applied to TRIG relative to solar funds. On the other hand, TRIG is slightly more sensitive than pure solar funds to energy output assumptions, given that the company has a large proportion of its portfolio in wind projects, which are more variable in terms of energy output than solar but have higher overall returns.
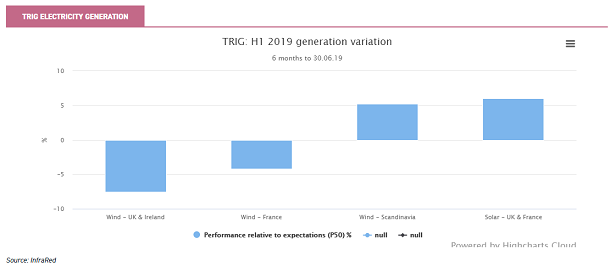
At the current half-year point (30 June 2019) overall electricity production was 3% below budget. The managers reported that this shortfall was due to a combination of lower than average wind speeds across the UK and Ireland alongside a small number of asset-specific operational factors. They observed that TRIG’s diversified asset base helped to mitigate this shortfall, with above-budget generation in Scandinavia and good solar irradiation and performance from their solar assets.
The company announces NAV valuations half-yearly, with the latest being 115p as at 30 June 2019. As highlighted in the above sensitivity analysis, changes to the company’s NAV in the future will be influenced, among other factors, by the discount rate (currently 7.5% on a geared blended basis); the ability of the assets to harvest electricity from solar irradiation and the wind; long-term power price forecasts; and long-term inflation expectations. The fact that the NAV has not tracked a straight path illustrates the varying impact over time from changes in these long-term assumptions.
As mentioned above, changes in regulation and the political climate are something that all renewable infrastructure funds are exposed to. As such, we think it worth highlighting that in the recently published interim results, the board notes that Ofgem’s Targeted Charging Review is still ongoing, with an expectation that it will be concluded by the end of 2019. Ofgem is considering introducing additional charges for generators depending on their location. As a cautious provision against this potential charge, all ‘embedded benefits’ have been removed from TRIG’s current valuation, but depending on the exact outcome, the managers note that further adjustments may be necessary (positive or negative) on both valuations and income assumptions.
Dividend
As discussed above, TRIG seeks to differentiate itself from the other funds in the sector by providing a diversified exposure to different electricity generation technologies and geographies. Over time, this objective will clearly mean a lower variation in generation than would be seen otherwise. This pattern is illustrated in the graph below, which shows electricity generation over the first half of 2019. Overall, electricity generation was 3.3% below budget during the first half, with lower than expected wind speeds in the UK, Ireland and France being offset by higher wind experienced by TRIG’s new Swedish assets, and better than expected solar performance in the UK and France (as was the case in 2018).
Aside from geographical and technology diversification, TRIG aims to balance its risk and reward characteristics by managing exposures to subsidy regimes and power prices. As grid parity is reached, the company has the opportunity to invest in unsubsidised projects with the prospect of higher returns, but with full exposure to power prices.
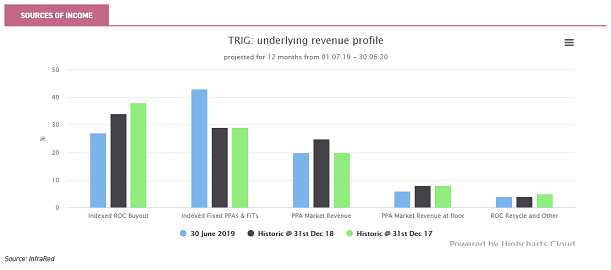
TRIG seeks to maintain its present power price exposure, and thus to balance any such investments with projects with fuller subsidies – such as those that are available in France and Germany (as well as some UK projects).
As illustrated in the graph below, the company’s overall exposure to power prices (PPA Market Revenue) was only 26% over the six months to 30 June 2019. The biggest influence on revenue remains the various incentive schemes which pay producers of renewable energy to encourage them to invest. Over time, the underlying revenue profile of the portfolio has changed as the company has acquired assets, but the company’s sensitivity to power price forecasts has remained broadly similar. At the various dates in the graph below, TRIG’s IRR will be positively or negatively affected by +/-1% depending on a -/+10% parallel shift in the power price forecast.
The company currently has 45% of exposure to non-sterling denominated assets. Its policy is to hedge expected income over the short term (approximately the next 24-36 months), with additional hedges taking the total to around 50% of the euro denominated balance sheet exposure. The managers do not consider that having EU investments in the portfolio adds significantly to the currency exposure, given this hedging policy and the fact that even UK-located renewables projects have an indirect currency exposure (as power prices are influenced by changing exchange rates).
Management
TRIG has two managers who work together to achieve the company’s aims: InfraRed, which has many years’ experience in infrastructure investments (it is also the manager behind HICL Infrastructure (LSE:HICL)); and RES, which is one of world's largest independent renewable energy companies.
InfraRed is responsible for the financial management, sourcing and executing of new investments. RES has a dedicated team of more than 40 staff, providing portfolio-level operations management.
Richard Crawford is a director, infrastructure, at InfraRed. He joined InfraRed in 2002 and is one of its partners. He is responsible for the InfraRed team advising TRIG, which launched in 2013. Richard specialises in renewables, including transacting and managing investments in primarily wind, solar and the wider power sector.
Jaz Bains joined RES in 2003 and is the group commercial director, responsible for day to day management of the assets. He has spent his working life in power and electricity businesses.
InfraRed has a 25-year track record in infrastructure and real estate funds, having completed over 300 transactions and with over $12bn of equity under management. It first invested in renewables in 2006. InfraRed also manages HICL, the first infrastructure investment company listed in London. The InfraRed team is London-based and employs 150+ staff.
RES is the one of the largest independent renewable energy developers in the UK and Ireland and is a privately-owned part of the Robert McAlpine group of companies. It has over 37 years' experience in renewables construction and operations. RES is headquartered in the UK, with over 2,000 staff employed in renewables in ten countries. It has developed and constructed over 16GW of capacity.
The managers are overseen by TRIG’s independent board of four directors, chaired by Helen Mahy CBE, who worked for ten years as general counsel to National Grid and is a non-executive director of SSE.
Discount
The company continues to enjoy robust demand for its shares, and according to data from Numis has traded on an average premium to NAV of 8.9% over the last year. At the current premium of around 14%, the shares trade at a slight premium to the sector average premium of 12.7%.
When an investment company trades on a hefty premium, it is worth noting that one of the risks to shareholders is a sharp change in investor attitudes towards the prospects for the trust or peer group, which causes the share price to fall and rapidly turns the premium to a discount.
As the graph below shows, with the prospect of interest rate rises receding, the premium has expanded somewhat over the current year. Nevertheless, as we observe above, it remains broadly in line with the sector average. The managers point out that the shares have good liquidity in the market: around three million shares have traded on average per day over the past 18 months. The company has permission to buy shares back at a discount to NAV but has so far not exercised this.
Charges
The company’s ongoing charges figure (OCF) for the six months to 30 June 2019 was financial year was 0.98%, compared to a figure of 1.19% for the same period last year, and 1.12% for 2018 as a whole. The falling OCF is a direct result of the company growing its asset base significantly over this period and the effect of the tiered management fee (noted below). The management fees payable by the company are charged on adjusted portfolio value, effectively the NAV plus any of the acquisition facility that has been drawn down and invested. This means that when the facility is undrawn or slightly drawn (as is the case now), the NAV and the valuation for the management fee calculation will be similar. When the facility is heavily drawn the valuation will exceed the NAV.
A fee of 1% (0.8% in cash and 0.2% in shares) applies to net assets of up to £1 billion; thereafter the management fee is 0.8% on assets up to £2 billion, 0.75% on assets between £2 billion and £3 billion and 0.7% on assets above £3 billion. Of this fee, 65% goes to InfraRed and 35% to RES. There are no performance or acquisition fees.
ESG
TRIG aims to appeal to ESG investors in several ways. Firstly, the assets that the company buys contribute to emissions avoidance of over 1 million tonnes of CO2 per year. The managers believe they are helping towards the achievement of UN Sustainable Development Goal 7 (ensure access to affordable, reliable, sustainable and modern energy for all) and Goal 13 (take urgent action to combat climate change and its impacts).
The managers also consider the ‘S’ and ‘G’ aspects of ESG as part of their investment and operations processes. Company Chair Helen Mahy has commented that the board wants investors to know that the company is “run by people who prioritise social responsibility”. Within its ESG goals, TRIG aims to preserve the natural environment, to positively impact the communities its people work in, and to maintain ethics and integrity in governance. With the Chair having been awarded a CBE in 2015 for her services to business, particularly relating to diversity in the workplace, it seems fair to assume that the managers are regularly challenged and encouraged to achieve their ESG goals.
Perhaps as a result, the TRIG managers have put a lot of work into communicating their ESG approach. In September 2019, they published a very detailed and accessible document on this topic.
Kepler Partners is a third-party supplier and not part of interactive investor. Neither Kepler Partners or interactive investor will be responsible for any losses that may be incurred as a result of a trading idea.
Full performance can be found on the company or index summary page on the interactive investor website. Simply click on the company's or index name highlighted in the article.
Important Information
Kepler Partners is not authorised to make recommendations to Retail Clients. This report is based on factual information only, and is solely for information purposes only and any views contained in it must not be construed as investment or tax advice or a recommendation to buy, sell or take any action in relation to any investment.
This report has been issued by Kepler Partners LLP solely for information purposes only and the views contained in it must not be construed as investment or tax advice or a recommendation to buy, sell or take any action in relation to any investment. If you are unclear about any of the information on this website or its suitability for you, please contact your financial or tax adviser, or an independent financial or tax adviser before making any investment or financial decisions.
The information provided on this website is not intended for distribution to, or use by, any person or entity in any jurisdiction or country where such distribution or use would be contrary to law or regulation or which would subject Kepler Partners LLP to any registration requirement within such jurisdiction or country. Persons who access this information are required to inform themselves and to comply with any such restrictions. In particular, this website is exclusively for non-US Persons. The information in this website is not for distribution to and does not constitute an offer to sell or the solicitation of any offer to buy any securities in the United States of America to or for the benefit of US Persons.
This is a marketing document, should be considered non-independent research and is subject to the rules in COBS 12.3 relating to such research. It has not been prepared in accordance with legal requirements designed to promote the independence of investment research.
No representation or warranty, express or implied, is given by any person as to the accuracy or completeness of the information and no responsibility or liability is accepted for the accuracy or sufficiency of any of the information, for any errors, omissions or misstatements, negligent or otherwise. Any views and opinions, whilst given in good faith, are subject to change without notice.
This is not an official confirmation of terms and is not to be taken as advice to take any action in relation to any investment mentioned herein. Any prices or quotations contained herein are indicative only.
Kepler Partners LLP (including its partners, employees and representatives) or a connected person may have positions in or options on the securities detailed in this report, and may buy, sell or offer to purchase or sell such securities from time to time, but will at all times be subject to restrictions imposed by the firm's internal rules. A copy of the firm's conflict of interest policy is available on request.
Past performance is not necessarily a guide to the future. The value of investments can fall as well as rise and you may get back less than you invested when you decide to sell your investments. It is strongly recommended that Independent financial advice should be taken before entering into any financial transaction.
PLEASE SEE ALSO OUR TERMS AND CONDITIONS
Kepler Partners LLP is a limited liability partnership registered in England and Wales at 9/10 Savile Row, London W1S 3PF with registered number OC334771.
Kepler Partners LLP is authorised and regulated by the Financial Conduct Authority.
Kepler Partners is a third-party supplier and not part of interactive investor. Neither Kepler Partners or interactive investor will be responsible for any losses that may be incurred as a result of a trading idea.
These articles are provided for information purposes only. Occasionally, an opinion about whether to buy or sell a specific investment may be provided by third parties. The content is not intended to be a personal recommendation to buy or sell any financial instrument or product, or to adopt any investment strategy as it is not provided based on an assessment of your investing knowledge and experience, your financial situation or your investment objectives. The value of your investments, and the income derived from them, may go down as well as up. You may not get back all the money that you invest. The investments referred to in this article may not be suitable for all investors, and if in doubt, an investor should seek advice from a qualified investment adviser.
Full performance can be found on the company or index summary page on the interactive investor website. Simply click on the company's or index name highlighted in the article.
Important Information
Kepler Partners is not authorised to make recommendations to Retail Clients. This report is based on factual information only, and is solely for information purposes only and any views contained in it must not be construed as investment or tax advice or a recommendation to buy, sell or take any action in relation to any investment.
This report has been issued by Kepler Partners LLP solely for information purposes only and the views contained in it must not be construed as investment or tax advice or a recommendation to buy, sell or take any action in relation to any investment. If you are unclear about any of the information on this website or its suitability for you, please contact your financial or tax adviser, or an independent financial or tax adviser before making any investment or financial decisions.
The information provided on this website is not intended for distribution to, or use by, any person or entity in any jurisdiction or country where such distribution or use would be contrary to law or regulation or which would subject Kepler Partners LLP to any registration requirement within such jurisdiction or country. Persons who access this information are required to inform themselves and to comply with any such restrictions. In particular, this website is exclusively for non-US Persons. The information in this website is not for distribution to and does not constitute an offer to sell or the solicitation of any offer to buy any securities in the United States of America to or for the benefit of US Persons.
This is a marketing document, should be considered non-independent research and is subject to the rules in COBS 12.3 relating to such research. It has not been prepared in accordance with legal requirements designed to promote the independence of investment research.
No representation or warranty, express or implied, is given by any person as to the accuracy or completeness of the information and no responsibility or liability is accepted for the accuracy or sufficiency of any of the information, for any errors, omissions or misstatements, negligent or otherwise. Any views and opinions, whilst given in good faith, are subject to change without notice.
This is not an official confirmation of terms and is not to be taken as advice to take any action in relation to any investment mentioned herein. Any prices or quotations contained herein are indicative only.
Kepler Partners LLP (including its partners, employees and representatives) or a connected person may have positions in or options on the securities detailed in this report, and may buy, sell or offer to purchase or sell such securities from time to time, but will at all times be subject to restrictions imposed by the firm's internal rules. A copy of the firm's conflict of interest policy is available on request.
Past performance is not necessarily a guide to the future. The value of investments can fall as well as rise and you may get back less than you invested when you decide to sell your investments. It is strongly recommended that Independent financial advice should be taken before entering into any financial transaction.
PLEASE SEE ALSO OUR TERMS AND CONDITIONS
Kepler Partners LLP is a limited liability partnership registered in England and Wales at 9/10 Savile Row, London W1S 3PF with registered number OC334771.
Kepler Partners LLP is authorised and regulated by the Financial Conduct Authority.
These articles are provided for information purposes only. Occasionally, an opinion about whether to buy or sell a specific investment may be provided by third parties. The content is not intended to be a personal recommendation to buy or sell any financial instrument or product, or to adopt any investment strategy as it is not provided based on an assessment of your investing knowledge and experience, your financial situation or your investment objectives. The value of your investments, and the income derived from them, may go down as well as up. You may not get back all the money that you invest. The investments referred to in this article may not be suitable for all investors, and if in doubt, an investor should seek advice from a qualified investment adviser.
Full performance can be found on the company or index summary page on the interactive investor website. Simply click on the company's or index name highlighted in the article.