Nostrum Oil & Gas shares grab this analyst's attention
22nd June 2022 07:50
by Alistair Strang from Trends and Targets
After doubling in value since April, investors are wondering whether this oil and gas explorer has further to go. Independent analyst Alistair Strang searches the charts for clues.

It’s not often a share trading code sparks a search but Nostrum Oil & Gas (LSE:NOG) managed it. Their moniker, NOG, rung a very faint bell and an immediate assumption Nog was a character from Lord of the Rings. This turned out to be a big nope. Nog was a character in a Star Trek spin-off. It’s amazing how trivia from nearly 30 years ago remains in a little pigeon hole of memory, making it questionable just why the human brain decides something is worth retaining!
Nostrum Oil & Gas, headquartered and listed in London, is a Kazakhstan producer and judging by their history, on the go since 2004 and listed since 2013. Their listing recently moved from ‘Premium Listing’ to ‘Standard Listing’ and, if we’re honest, we’ve no idea what this shall mean for the share price.
However, it certainly appears something may be happening.
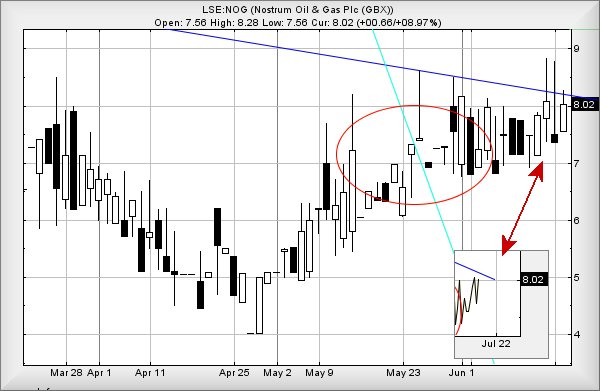
The chart below has a circled area, delineating something odd which occurred toward the end of May. The share price did a little dance for a few days, it transpiring the price exceeding 6.576p at that particular time was significant.
The light blue trend describes something we usually ignore, a really big picture downtrend from a time in 2014 where Nostrum had a share price of 825p. This sort long distance trend line from an impossible high is generally an obstacle that a share price treats as invisible. But on, this occasion, there were a series of price movements which tend to indicate the market was perfectly aware of what just happened.
Okay, maybe this sort of thing is fascinating to just us, but when the market reacts to an event, it’s always worth pausing for thought and wondering why.

Past performance is not a guide to future performance.
Secondly, the last couple of sessions have witnessed the share price break through the Blue downtrend since 2019, yet fail to close above the trend. Our chart inset (above) highlights the share price is carefully mirroring the Blue trend line. We’ve a theory that should the share price now exceed these breakout levels, some positive action can be anticipated.
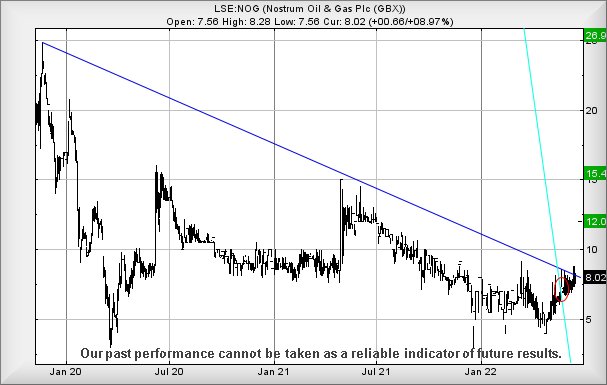
If our suspicion proves correct, it’s probably safe to view the Bigger Picture chart below.
Currently, above 8.85p can allegedly suggest movement to an initial 12p with secondary, if exceeded, a rather more impressive 15.4p.

Past performance is not a guide to future performance.
Obviously, if playing safe, closure above Blue (presently 8.5p) will make a lot of sense but, in this instance, if our guess about the wider market paying attention is correct, any movement is liable to prove rather quick.
Visually, there’s a fairly strong hint the 15p level should provide some sort of glass ceiling for future rises, but we can risk suggesting that closure above 15p is liable to prove quite game changing, as a third target level at 26p makes itself very possible.
Alistair Strang has led high-profile and "top secret" software projects since the late 1970s and won the original John Logie Baird Award for inventors and innovators. After the financial crash, he wanted to know "how it worked" with a view to mimicking existing trading formulas and predicting what was coming next. His results speak for themselves as he continually refines the methodology.
Alistair Strang is a freelance contributor and not a direct employee of Interactive Investor. All correspondence is with Alistair Strang, who for these purposes is deemed a third-party supplier. Buying, selling and investing in shares is not without risk. Market and company movement will affect your performance and you may get back less than you invest. Neither Alistair Strang or Interactive Investor will be responsible for any losses that may be incurred as a result of following a trading idea.
These articles are provided for information purposes only. Occasionally, an opinion about whether to buy or sell a specific investment may be provided by third parties. The content is not intended to be a personal recommendation to buy or sell any financial instrument or product, or to adopt any investment strategy as it is not provided based on an assessment of your investing knowledge and experience, your financial situation or your investment objectives. The value of your investments, and the income derived from them, may go down as well as up. You may not get back all the money that you invest. The investments referred to in this article may not be suitable for all investors, and if in doubt, an investor should seek advice from a qualified investment adviser.
Full performance can be found on the company or index summary page on the interactive investor website. Simply click on the company's or index name highlighted in the article.