Share Sleuth: Time to measure performance more accurately
Richard Beddard explains why he's changing the performance chart in the portfolio.
1st May 2019 12:51
by Richard Beddard from interactive investor
Richard Beddard explains why he's changing the way the performance chart is presented as the portfolio approaches its 10th anniversary.

This month, I have refrained from trading, although I might have added shares in Anpario (LSE:ANP) had I realised the portfolio had enough cash to add a small holding. The company briefly strayed into value territory and now sits right on the cusp by my estimation. Like Porvair (LSE:PRV), Anpario has been on my watch list for many years.
Moreover, like Porvair, the single factor holding me back from adding shares in Anpario has been its valuation, so it is slightly galling that when the opportunity arose, I did not check I had the firepower to follow through! Hopefully I will have another opportunity to buy shares in Anpario.
This month, I will address a change to the presentation of this article. From now on, the vertical scale on the performance chart will be a logarithmic scale instead of the arithmetic scale we have been using.
Before I explain why, a caveat. I do not dwell on the performance of the portfolio because I do not believe short-term movements in the value of investments are correlated with long-term outcomes. This is why the Dogs of the FTSE strategy, regularly covered by Money Observer, works. Previous losers are often future winners. Anything less than 10 years is short-term to me, and were it not for the fact that readers are interested in Share Sleuth’s performance, I would not include the chart, or even generate it.
On 9 September, though, the Share Sleuth portfolio hits a significant milestone. It will be 10 years old, which means the chart will become somewhat meaningful. It will tell us whether I have been a better or worse investor than average, which brings me back to logarithmic scales.
Why scale matters
To show you how an arithmetic scale distorts performance charts I would like you to join me in a demonstration. The link will take you to a web page with a chart of the Dow Jones Industrial Average, a venerable US stockmarket index. Now un-tick the boxes above the chart that say "Log-scale" and "Inflation-Adjusted".
This chart shows the index level on an arithmetic scale, and you should see a curve that gets steeper and steeper as time goes on, typical of long-term stock market charts.
It goes right back to 1914, and includes the Wall Street Crash, the most dramatic stock market event of the 20th century. In the two years following 1929, the Dow fell by over 90%. Can you see it on the chart? In the 1920s, the line is almost flat.
That is odd, because the much smaller 40% declines of the dotcom bubble after 2000 and the 50% decline during the financial crisis of 2008 are easy to pick out.
Now click the log scale box. The true picture comes into focus. The Wall Street Crash is restored to its rightful place, and the long-term growth of the stock market is almost a straight line, not an exponential curve.
The reason for the difference is the scale. An arithmetic scale goes up in equal increments, so the distance from two to four is the same as the distance from four to six.
A logarithmic scale goes up in equal multiples, so the distance from two to four is the same as the distance from four to eight (both have doubled).
The logarithmic scale keeps movements of the index in proportion. The more whatever we are charting goes up and the longer it goes up for, the bigger the discrepancy between the two scales.
To show the difference, we have put both an arithmetic scale and a logarithmic scale on the Share Sleuth chart and plotted its performance twice. The differences are more subtle than the Dow example, but they are already apparent.
If the portfolio continues to grow, the distortions of the arithmetic scale would get worse, which is why we have changed it.
Log scale paints truer picture
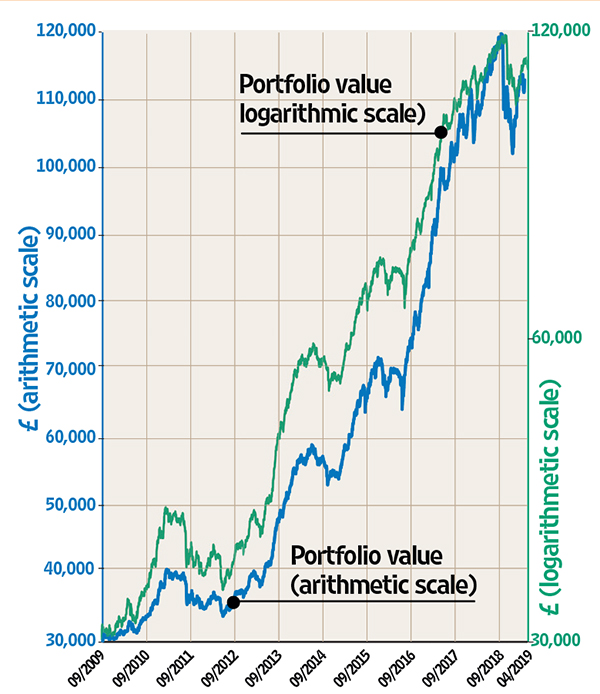
Source: interactive investor Past performance is not a guide to future performance
Missed adding Anpario
| Portfolio | Cost (£) | Value (£) | Return (%) | ||
|---|---|---|---|---|---|
| Cash | 2,964 | ||||
| Shares | 108,816 | ||||
| Since 9 September 2009 | 30,000 | 111,780 | 273% | ||
| Company | Shares | Cost (£) | Value (£) | Return (%) | |
| ALU | Alumasc | 938 | 999 | 961 | -4 |
| AVON | Avon Rubber | 192 | 2,510 | 2,496 | |
| CFX | Colefax | 434 | 943 | 2,027 | 115 |
| CGS | Castings | 1,109 | 3,110 | 3,981 | 28 |
| CHH | Churchill China | 341 | 3,751 | 5,149 | 37 |
| CHRT | Cohort | 1,600 | 3,747 | 5,824 | 55 |
| DTG | Dart | 456 | 250 | 3,545 | 1,318 |
| DWHT | Dewhurst | 735 | 2,244 | 6,064 | 170 |
| GAW | Games Workshop | 198 | 568 | 6,269 | 1,004 |
| GDWN | Goodwin | 266 | 6,646 | 7,741 | 16 |
| HWDN | Howden Joinery | 748 | 3,228 | 3,707 | 15 |
| JDG | Judges Scientific | 252 | 5,989 | 6,665 | 11 |
| NXT | Next | 45 | 2,199 | 2,541 | 16 |
| PMP | Portmeirion | 349 | 3,212 | 3,909 | 22 |
| QTX | Quartix | 1,085 | 2,798 | 2,864 | 2 |
| RSW | Renishaw | 92 | 1,739 | 3,697 | 113 |
| SAG | Science | 2,660 | 2,908 | 5,400 | 86 |
| SOLI | Solid State | 1,546 | 4,523 | 5,890 | 30 |
| SYS1 | System1 | 463 | 1,793 | 857 | -52 |
| TET | Treatt | 1,222 | 1,734 | 4,833 | 179 |
| TFW | Thorpe (F W) | 2,000 | 2,207 | 6,360 | 188 |
| TRI | Trifast | 2,261 | 3,357 | 4,319 | 29 |
| TSTL | Tristel | 750 | 268 | 2,175 | 711 |
| VCT | Victrex | 150 | 2,253 | 3,339 | 48 |
| XPP | XP Power | 339 | 6,287 | 8,204 | 30 |
Notes: No new additions. Transaction costs include £10 broker fee, and 0.5% stamp duty where appropriate. Cash earns no interest. Dividends and sale proceeds are credited to the cash balance. £30,000 invested on 9 September 2009 would be worth £111,780 today. £30,000 invested in FTSE All-Share index tracker accumulation units would be worth £64,432 today. Objective: To beat the index tracker handsomely over five-year periods.
Source: SharePad, 3 April 2019
These articles are provided for information purposes only. Occasionally, an opinion about whether to buy or sell a specific investment may be provided by third parties. The content is not intended to be a personal recommendation to buy or sell any financial instrument or product, or to adopt any investment strategy as it is not provided based on an assessment of your investing knowledge and experience, your financial situation or your investment objectives. The value of your investments, and the income derived from them, may go down as well as up. You may not get back all the money that you invest. The investments referred to in this article may not be suitable for all investors, and if in doubt, an investor should seek advice from a qualified investment adviser.
Full performance can be found on the company or index summary page on the interactive investor website. Simply click on the company's or index name highlighted in the article.
Disclosure
We use a combination of fundamental and technical analysis in forming our view as to the valuation and prospects of an investment. Where relevant we have set out those particular matters we think are important in the above article, but further detail can be found here.
Please note that our article on this investment should not be considered to be a regular publication.
Details of all recommendations issued by ii during the previous 12-month period can be found here.
ii adheres to a strict code of conduct. Contributors may hold shares or have other interests in companies included in these portfolios, which could create a conflict of interests. Contributors intending to write about any financial instruments in which they have an interest are required to disclose such interest to ii and in the article itself. ii will at all times consider whether such interest impairs the objectivity of the recommendation.
In addition, individuals involved in the production of investment articles are subject to a personal account dealing restriction, which prevents them from placing a transaction in the specified instrument(s) for a period before and for five working days after such publication. This is to avoid personal interests conflicting with the interests of the recipients of those investment articles.
This article was originally published in our sister magazine Money Observer, which ceased publication in August 2020.
These articles are provided for information purposes only. Occasionally, an opinion about whether to buy or sell a specific investment may be provided by third parties. The content is not intended to be a personal recommendation to buy or sell any financial instrument or product, or to adopt any investment strategy as it is not provided based on an assessment of your investing knowledge and experience, your financial situation or your investment objectives. The value of your investments, and the income derived from them, may go down as well as up. You may not get back all the money that you invest. The investments referred to in this article may not be suitable for all investors, and if in doubt, an investor should seek advice from a qualified investment adviser.
Full performance can be found on the company or index summary page on the interactive investor website. Simply click on the company's or index name highlighted in the article.