Stockwatch: an enigmatic share offering an 8.5% yield
Offering one of the best dividend yields around and a low valuation, analyst Edmond Jackson discusses whether this is a share going places or a value trap.
24th February 2026 10:52
by Edmond Jackson from interactive investor

Is artificial intelligence dealing price comparison websites (PCWs) such as Mony Group (LSE:MONY) - formerly Moneysupermarket.com - an existential blow? Or are fears overdone and does a fat yield with 1.4x expected earnings cover imply the shares will mean-revert upwards in due course?
After a decade-long glory run for the mid-cap from 33p to over 400p in mid-2019, the last three years in particular have seen a bear trend which capitulated from 186p to 145p on 16 February, as part of a wider sell-off in AI-affected shares. The price has since crept up and closed 3% higher yesterday at 157p in response to annual results.
- Invest with ii: Top UK Shares | Share Tips & Ideas | Cashback Offers
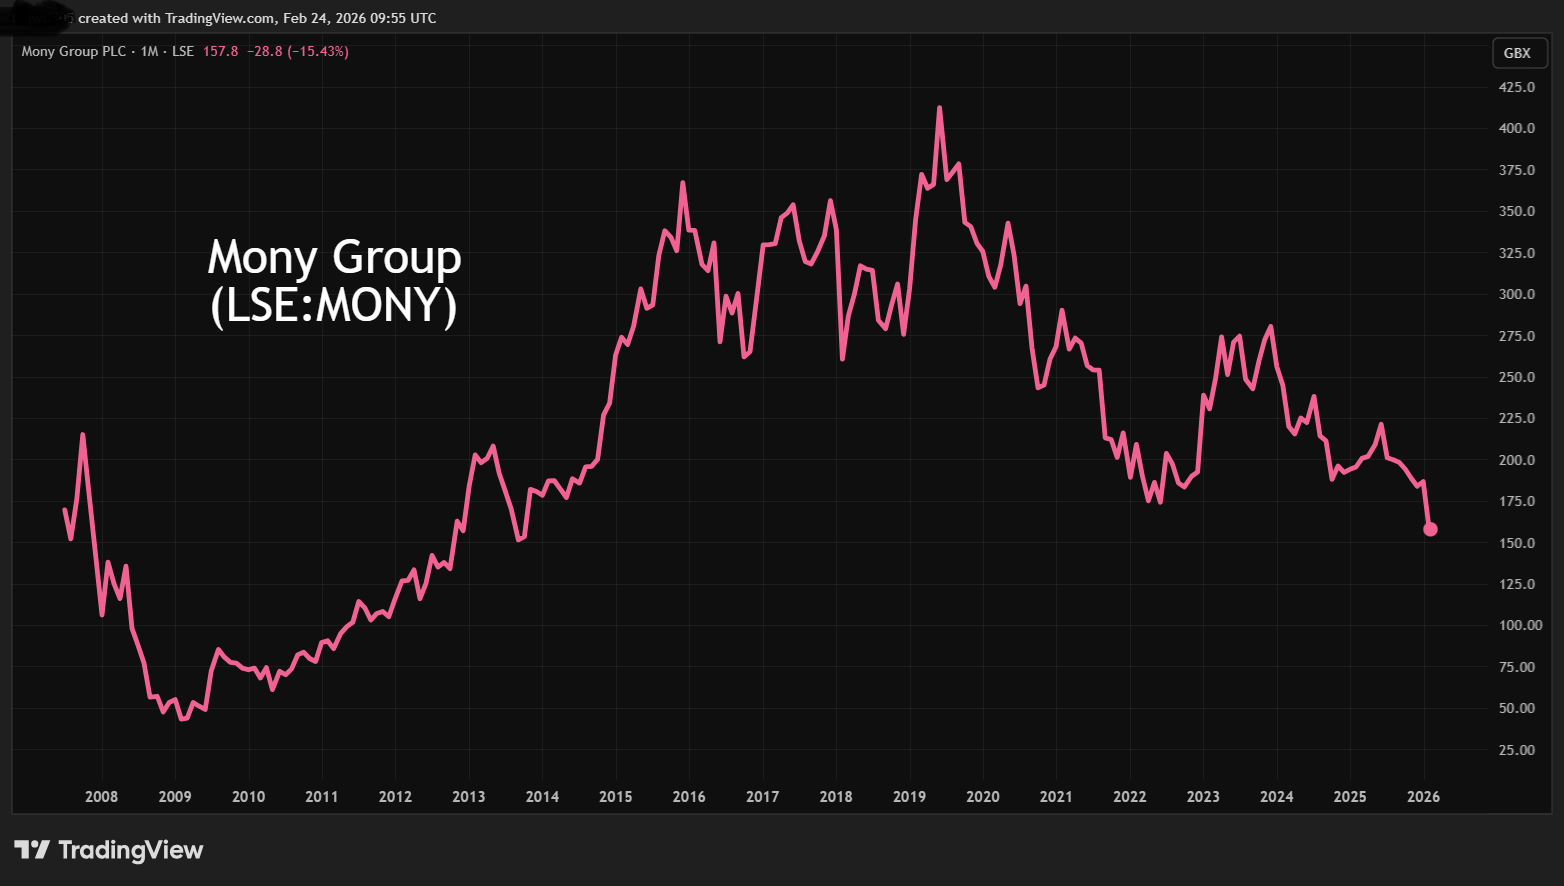
Source: TradingView. Past performance is not a guide to future performance.
A non-executive director since 2022 just bought £20,000 worth of MONY shares at 158p, and the company bought back 102,000 shares at 156p to kick off a new £25 million buyback programme that will run to September. While it assisted a 5% rise in 2025 earnings per share (EPS) to 17.9p, it is a moot point how “value enhancing” buybacks are if the underlying business is in long-term decline. The chart says to steer clear but what of fundamentals?
Revenue matters for valuation
Like RELX (LSE:REL), which is also seen as being pressured by AI, MONY has embarked on cost-cutting which reduced operating costs by 4% in 2025. The reported operating margin was a highly respectable 26.3% versus 25.8% in 2024.
Yet revenue crept up only 2% - flat when adjusted for inflation - to £446.3 million, with pre-tax profit up 1% to £80.7 million. Significantly, insurance, which comprises 52% of revenue, slipped 1% and is an area where AI rivals are materialising.
ChatGPT can obtain insurance quotes and Insurify allows users to compare and buy products instantly through chat instead of traditional search-and-click methods. Tuio in Spain offers a variety of insurance “in 30 seconds from your phone”. MONY has responded by way of a joint venture with ChatGPT, launching an app to search insurance providers with conversational interface. AI is also being integrated into MONY’s platform to provide faster more personalised results. But are these essentially defensive moves, simply mitigating revenue loss to the new AI app? Insurance is a highly saturated marketplace anyway.
Other revenue segments involved contrasts, hence it is tricky to discern the likely revenue trajectory. Money rose 13% to represent 24% of the total. It may indeed offer growth potential given that MONY has launched a Savings operation to find the most competitive accounts “and a natural gateway into investments...which we will be launching later in the year”. Again, it’s a highly competitive field.
Home Services jumped 37%, although it is relatively small-scale at 11% of the total. Likewise, Cashback at 12% of the total, where revenue fell 18%. Travel at 4% was down 22%.
This Cashback decline hardly looks like a good verdict on the £101 million Quidco acquisition five years ago when it made £59 million revenue. It’s as if anticipated synergies haven’t arisen.
Net profit of £80.7 million rose just 0.6% but return on total capital of 34% (helped by only £14.0 million debt) remains fundamentally strong like the operating margin.
MONY Group - financial summary
year-end 31 Dec
| 2014 | 2015 | 2016 | 2017 | 2018 | 2019 | 2020 | 2021 | 2022 | 2023 | 2024 | 2025 | |
| Turnover (£ million) | 248 | 282 | 316 | 330 | 356 | 388 | 345 | 317 | 388 | 432 | 439 | 446 |
| Operating margin (%) | 25.7 | 28.6 | 28.8 | 28.8 | 30.4 | 30.5 | 25.2 | 23.2 | 23.0 | 22.5 | 25.8 | 26.3 |
| Operating profit (£m) | 63.9 | 80.5 | 91.2 | 94.9 | 108 | 118 | 87.0 | 73.4 | 89.0 | 97.3 | 113 | 117 |
| Net profit (£m) | 52.8 | 63.4 | 73.5 | 78.1 | 86.6 | 94.9 | 69.3 | 52.7 | 68.3 | 72.7 | 80.2 | 80.7 |
| EPS - reported (p) | 9.6 | 11.6 | 13.4 | 14.4 | 16.1 | 17.7 | 12.9 | 9.8 | 12.7 | 13.5 | 14.9 | 15.2 |
| EPS - normalised (p) | 10.2 | 12.3 | 13.7 | 15.8 | 17.0 | 18.0 | 12.9 | 10.3 | 12.7 | 13.5 | 14.9 | 15.2 |
| Operating cashflow/share (p) | 15.3 | 17.6 | 19.3 | 19.6 | 19.8 | 21.2 | 15.6 | 12.2 | 19.4 | 19.0 | 21.4 | 20.6 |
| Capital expenditure/share (p) | 2.1 | 4.1 | 4.1 | 3.9 | 3.6 | 2.8 | 2.0 | 1.8 | 2.1 | 2.0 | 2.6 | 1.7 |
| Free cashflow/share (p) | 13.2 | 13.5 | 15.2 | 15.7 | 16.2 | 18.4 | 13.6 | 10.4 | 17.3 | 16.0 | 18.8 | 18.9 |
| Dividends per share (p) | 8.0 | 9.2 | 9.9 | 10.4 | 11.1 | 11.7 | 11.7 | 11.7 | 11.7 | 12.1 | 12.5 | 12.6 |
| Covered by earnings (x) | 1.2 | 1.3 | 1.4 | 1.4 | 1.5 | 1.5 | 1.1 | 0.8 | 1.1 | 1.1 | 1.2 | 1.2 |
| Cash (£m) | 43.1 | 16.7 | 44.6 | 35.1 | 44.8 | 24.2 | 23.6 | 12.5 | 16.6 | 16.6 | 22.4 | 20.3 |
| Net debt (£m) | -13.2 | -16.7 | -44.6 | -35.1 | -29.8 | 10.2 | 9.2 | 76.7 | 56.0 | 44.1 | -10.4 | -6.3 |
| Net assets (£m) | 148 | 166 | 186 | 170 | 201 | 199 | 209 | 203 | 209 | 221 | 240 | 227 |
| Net assets per share (p) | 27.2 | 30.4 | 34.1 | 31.8 | 37.4 | 37.1 | 38.8 | 37.9 | 38.9 | 41.1 | 44.6 | 43.2 |
Source: historic company REFS and company accounts.
MONY is thus an enigmatic contrast, presenting some high-quality ratios alongside doubts about revenue growth. It is also a prime example of how yield-hunters need to take care when there are risks to overall value. A year ago, when similarly reviewing annual results, at 202p I concluded a 6.5% yield implied the shares rated “buy” for yield, with the caveat being that more evidence was required for total return. Yet the average price target among four specialist analysts was 274p.
Even on a strict yield basis it is a bit concerning how conversion of operating profit to net operating cash flow has eased from 102% to 92%, despite this being overall strong. Operating cash flow has declined 7% to £108 million and there has been a 51% reduction in net cash to £4.1 million despite investment down 35% to £9.0 million. The chief factor was £30.2 million spent on buybacks, according to the cash flow statement, within £101 million financing activities.
Despite £66.9 million going out as dividends covered 1.5x by operating cash flow, the actual dividend rise is 1% to 12.63p per share, which does not peg inflation. You would think that is a key criterion for income investors, which the company would position itself to keep onside.
Dual strategy approach to consumer services
The “strategic review” in the results is less a fresh initiative than reiterating how MONY operations divide between “members” – people using the services and providing transactions, often on a repeat basis – and “providers” of the services with MONY as intermediary. Yet there is no information about how revenue/profit splits this way.
In response to AI, there is no classic “strengths, weaknesses, opportunities, threats” analysis, as if management is truly capable and confident. But in fairness, this is lacking from most similar businesses.
The company has said: “Underpinning our two-sided marketplace strategy is our leading data and tech” – that has moved to the cloud, partnering with Google and Amazon Web Services. This has created “one of the leading data and tech platforms in our industry giving scale, flexibility and a data foundation to exploit the opportunities AI presents”.
It remains quite a leap of faith as to whether this proves value-accretive or whether the market continues to price MONY with a high single-digit yield. Since AI rivals and collaborators seem at an early stage of appearing, it concerns me how things might pan out from 2027 onwards. Presently, consensus anticipates around £98 million of net profit this year, for EPS near 19p, hence a forward price/earnings (PE) ratio of 8.4x.
- Stockwatch: a trust that could continue to multiply
- Sign up to our free newsletter for investment ideas, latest news and award-winning analysis
With the PE and yield similarly beginning with an 8, caution would seem at odds with the Warren Buffett mantra to “be greedy when others are fearful”. I concede an aspect of being bitten from the “buy for income” stance I took a year ago – it worked in yield terms, but the capital loss has been unacceptable. That experience underlined how total return should be the priority.
Meanwhile, the disclosed short interest above 0.5% of issued share capital is creeping up, reaching 1.83% after one hedge fund increased by 0.12% to 1.21% on 2 December, another marginally by 0.05% to 0.62% on 12 February. Disclosed short interest has only been up at this level in late 2019, at 2.2%, when the share price was around 330p, hence it was a good long-term call.
A struggle to avoid fudging the rating
It is frustratingly unclear. If MONY’s initiatives in AI withstand much of the competitive threat, and those in membership such as the SuperSaverClub build on progress to generate higher value transactions, the shares can re-rate near to a 6.5% yield while buyers today have locked in 8.5%.
While I called MONY broadly well in its bull market years, up from 145p in October 2013 to a “sell” at 340p in July 2017, AI makes for a radically different and fast-evolving environment. I want to see more evidence that a financial growth trajectory is again possible, otherwise a value trap may persist.
That said, management’s initiatives and cost control may make it late to sell.
I hate to conclude with a “hold” stance but it’s where I am for now.
Edmond Jackson is a freelance contributor and not a direct employee of interactive investor.
These articles are provided for information purposes only. Occasionally, an opinion about whether to buy or sell a specific investment may be provided by third parties. The content is not intended to be a personal recommendation to buy or sell any financial instrument or product, or to adopt any investment strategy as it is not provided based on an assessment of your investing knowledge and experience, your financial situation or your investment objectives. The value of your investments, and the income derived from them, may go down as well as up. You may not get back all the money that you invest. The investments referred to in this article may not be suitable for all investors, and if in doubt, an investor should seek advice from a qualified investment adviser.
Full performance can be found on the company or index summary page on the interactive investor website. Simply click on the company's or index name highlighted in the article.
Disclosure
We use a combination of fundamental and technical analysis in forming our view as to the valuation and prospects of an investment. Where relevant we have set out those particular matters we think are important in the above article, but further detail can be found here.
Please note that our article on this investment should not be considered to be a regular publication.
Details of all recommendations issued by ii during the previous 12-month period can be found here.
ii adheres to a strict code of conduct. Contributors may hold shares or have other interests in companies included in these portfolios, which could create a conflict of interests. Contributors intending to write about any financial instruments in which they have an interest are required to disclose such interest to ii and in the article itself. ii will at all times consider whether such interest impairs the objectivity of the recommendation.
In addition, individuals involved in the production of investment articles are subject to a personal account dealing restriction, which prevents them from placing a transaction in the specified instrument(s) for a period before and for five working days after such publication. This is to avoid personal interests conflicting with the interests of the recipients of those investment articles.