Stockwatch: a trust that could continue to multiply
Currently worth 30 times its value in the aftermath of the financial crisis, analyst Edmond Jackson explains why this investment trust may have further to go.
20th February 2026 12:28
by Edmond Jackson from interactive investor

A regular point I make is about the dearth of flotations relative to the 1980s and mid-1990s, companies instead preferring private equity funding rather than the expense and scrutiny of a stock market listing.
While the London market has suffered more than most – the number of listed companies has declined by about 25% in the last 10 years – it is a global trend.
- Invest with ii: Open an ISA | ISA Investment Ideas | Transfer a Stocks & Shares ISA
Equity investment has thus become significantly more of a challenge to judge when shares in long-established companies are irrationally out of favour or entering a new phase of growth. It also helps explain why the relatively few shares capable of superior growth are over-priced arithmetically, the key question being whether the company can grow into its valuation.
But even in the very long run, shares in the private equity investment trust Pantheon International Ord (LSE:PIN) have outperformed spectacularly. It floated in 1987 at 15p as the first private equity “fund of funds” vehicle, although nowadays is around 54% exposed to direct investments as if cherry-picking some of the fund’s best ideas and investing alongside.
The 2008 crisis saw the shares back to 13p at the March 2009 nadir – I believe showing how a genuine recession hits unquoted company values hard – but had soared to an all-time high of 390p a month ago. They currently trade at 368p.
A play on private equity as an asset class
Long-term charts also show highly consistent growth as if affirming a high extent of diversification - you are going to be exposed to hundreds if not thousands of companies. It makes the investment decision very much about private equity as an asset class, how it is affected by the wider economy, plus inflation and interest rates in terms of their impact on asset values.
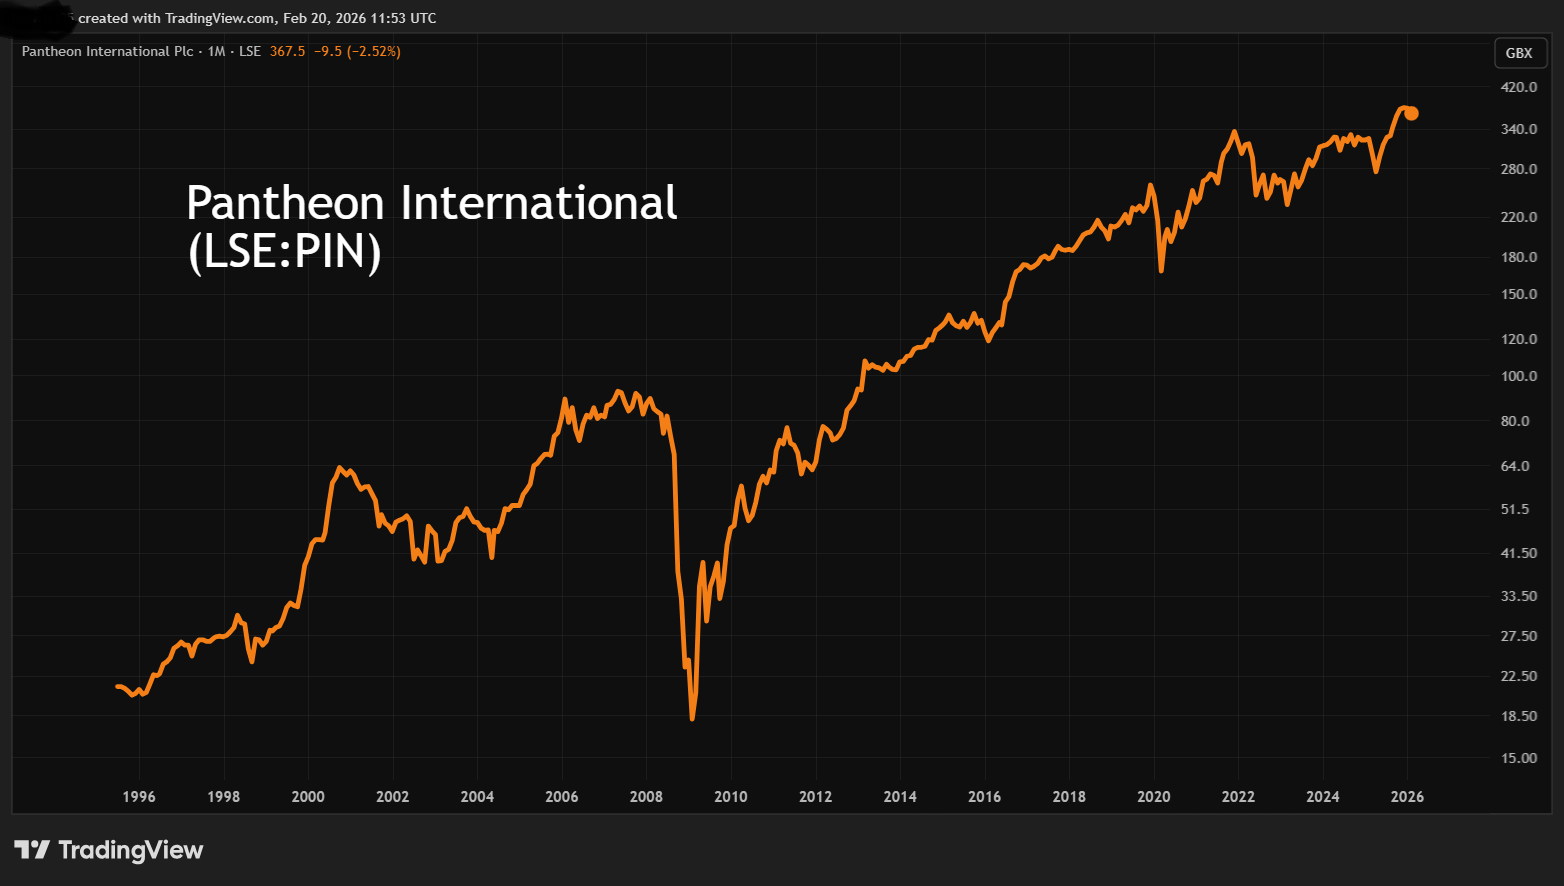
Source: TradingView. This is a logarithmic chart which plots percentage change rather than the specific change in pounds and pence. Past performance is not a guide to future performance.
As such I concede a bit of bias, being an equity analyst, given that I like to know what equity involves. PIN’s factsheets (from its website) only tell you the top five holdings (none are UK as far as I can tell), how the principal sectors are information technology at 34% and healthcare at 19% which the managers say reduces cyclicality, although from my experience I would say they are not immune. Technology spending can have its own cycles.
The US predominates at 53%, although given 76% of the portfolio is US dollar-denominated, currency weakness has affected translation into sterling results. Otherwise, Europe is next at 32% and Asia only 6%. Typifying the modern sense of private equity, buyouts constitute 72% of the financing profile.
Contrast to ‘value’ based REITs
I have recently glanced over real estate investment trusts (REITs) such as NewRiver REIT (LSE:NRR) in retail property, Regional REIT Ord (LSE:RGL) and Renewables Infrastructure Group (LSE:TRIG), which appeal ostensibly for high yield and a fat discount to net asset value (NAV). Yet the latter two rather disappointed with updates this week, implying market valuations could actually be fair unless the sectors are at or near an inflection point.
So, I was interested yesterday when PIN caught my attention with news of a reduced management fee arrangement, hence my decision to dig deeper. Factsheets proclaim (since inception) annualised growth in NAV of 11.6% and 10.8% in share price terms, which has been 4.0% ahead of the FTSE All-Share index.
- Ian Cowie: holding on for more after trebling money in under a year
- Fund Focus: beware this investment trust ‘silver bullet’
Despite this 38-year record, a market price of 368p is a 28% discount to the end-2025 NAV of around 511p per share.
PIN, however, is only just embarking on a dividend policy with 4.3p per share as consensus for the 31 May 2026 year, rising to near 4.5p in 2027, a yield of barely 1.2%. It is possible that this is aimed at increasing the range of funds able to buy PIN shares (dividends frequently being a stipulation) rather than the board’s confidence in capital growth reducing.
In line with most companies nowadays, share buybacks constitute by far the majority of news flow, which is perhaps fair when the market price is below NAV. However, shouldn’t private equity managers really be sourcing even better situations to deploy capital? In fairness, yesterday’s announcement reminded of a 668p per share NAV hurdle for a performance fee to kick in.
The free cash-flow profile here has never been good due to reinvesting gains, but the summary table below shows return on capital plunging after May 2022, a relatively short time frame:
Pantheon International - financial summary
Year-end 31 May
| 2020 | 2021 | 2022 | 2023 | 2024 | 2025 | |
| Turnover (£m) | 84.6 | 327 | 605 | 81.5 | 78.9 | 45.4 |
| Operating margin (%) | 73.6 | 92.4 | 95.1 | 53.7 | 43.9 | -9.8 |
| Operating profit (£m) | 62.3 | 302 | 576 | 43.8 | 34.7 | -4.4 |
| Net profit (£m) | 60.7 | 306 | 573 | 42.3 | 31.6 | -6.7 |
| Reported earnings/share (p) | 11.2 | 56.6 | 106 | 7.9 | 6.4 | -1.5 |
| Normalised earnings/share (p) | 11.2 | 56.6 | 106 | 7.9 | 6.9 | -1.5 |
| Operating cashflow/share (p) | -2.2 | -0.3 | -1.9 | -2.8 | -3.6 | -2.8 |
| Capital expenditure/share (p) | 0.0 | 0.0 | 0.0 | 0.0 | 0.0 | 0.0 |
| Free cashflow/share (p) | -2.2 | -0.3 | -1.9 | -2.8 | -3.6 | -2.8 |
| Dividend/share (p) | 0.0 | 0.0 | 0.0 | 0.0 | 0.0 | 0.0 |
| Return on capital (%) | 3.9 | 15.8 | 23.3 | 1.8 | 1.4 | -0.2 |
| Cash (£m) | 130 | 199 | 231 | 66.0 | 21.9 | 25.4 |
| Net debt (£m) | -72.3 | -152 | -193 | -193 | -34.7 | 212 |
| Net assets/share (p) | 288 | 345 | 452 | 462 | 490 | 496 |
Source: company accounts.
Challenges in recent years
The last full exposition by Pantheon was actually its end-July 2025 annual results when the chair described “muted” results as the aftermath of a bubble bursting in private equity values in the early 2020s, then post-Covid inflation leading to higher interest rates and tighter credit. Yet he added: “one can take some encouragement that total investment returns have been recovering over the last three years, at 3.5%, 4.9% and 6.2% respectively”.
It illustrates my main concern about how PIN’s long bull run since 2008 is significantly explained by the absence of real recessions as central banks kept up monetary stimulus, whether by quantitative easing or low interest rates. The shares fell from 250p to near 150p with the onset of Covid, but that only intensified the authorities’ response to avert recession.
Various shocks such as last April’s US tariffs Liberation Day have all been absorbed and the international economy kept growing. I think it an outlier risk, but a worst-case scenario would be an extended US/Iran war, substantially higher oil prices and a US political crisis.
Share price up despite loss of profits
PIN is up nearly 40% from a 267p low last April, yet its relatively solid bull trend contrasts with the financial results which explain why Pantheon’s board had to cut its manager fees.
They accounted for £26.8 million relative to £19.8 million investment income and £2.6 million other expenses, hence a £10.3 million loss on the income side. This was counter-balanced by £11.3 million of investment gains and (fortunately) a net £5.3 million gain on financial instruments and £9.0 million currency gains (odd considering dollar weakness). Yet fees were 86% of total returns from the actual investments.
- 12 small-cap shares backed by top stock pickers
- Sign up to our free newsletter for investment ideas, latest news and award-winning analysis
Effective 1 June, the monthly management fee is being reduced to an annualised 1% of NAV relative to a tiered approach. Time will tell how better that looks but it seems in line with asset management rates generally.
Ultimately, the market should default to the trend in NAV given that this is not a material income share, which in fairness has shown a 72% increase over five years (see table) despite reductions in profit after 2022.
Reducing the share price discount to NAV from 40% last May to 32% in July, and now 28%, has also involved various market-led initiatives where buybacks have helped. Some £53.5 million spent on share buybacks in the last financial year added 1.5% to NAV.
Is NAV discount a margin of safety?
Yes, I believe the NAV discount does offer a margin of safety so long as a material recession is avoided – especially in the US – something deft policy since 2008 has so far managed to achieve.
While I dislike a blurred sense of what this trust is exposed to by way of companies, I cannot argue with its long-term record. It addresses my despair about how private equity has significantly replaced listed equity funding, therefore I concede PIN more likely remains a long-term “buy”.
Browsing director and institutional dealings, the shareholder base is satisfied here, with a strong record of buy and hold rather than trading the equity like at many other companies.
Edmond Jackson is a freelance contributor and not a direct employee of interactive investor.
These articles are provided for information purposes only. Occasionally, an opinion about whether to buy or sell a specific investment may be provided by third parties. The content is not intended to be a personal recommendation to buy or sell any financial instrument or product, or to adopt any investment strategy as it is not provided based on an assessment of your investing knowledge and experience, your financial situation or your investment objectives. The value of your investments, and the income derived from them, may go down as well as up. You may not get back all the money that you invest. The investments referred to in this article may not be suitable for all investors, and if in doubt, an investor should seek advice from a qualified investment adviser.
Full performance can be found on the company or index summary page on the interactive investor website. Simply click on the company's or index name highlighted in the article.
Disclosure
We use a combination of fundamental and technical analysis in forming our view as to the valuation and prospects of an investment. Where relevant we have set out those particular matters we think are important in the above article, but further detail can be found here.
Please note that our article on this investment should not be considered to be a regular publication.
Details of all recommendations issued by ii during the previous 12-month period can be found here.
ii adheres to a strict code of conduct. Contributors may hold shares or have other interests in companies included in these portfolios, which could create a conflict of interests. Contributors intending to write about any financial instruments in which they have an interest are required to disclose such interest to ii and in the article itself. ii will at all times consider whether such interest impairs the objectivity of the recommendation.
In addition, individuals involved in the production of investment articles are subject to a personal account dealing restriction, which prevents them from placing a transaction in the specified instrument(s) for a period before and for five working days after such publication. This is to avoid personal interests conflicting with the interests of the recipients of those investment articles.