Time to watch Prudential shares very closely
Last year's impressive rally has partially unwound, which has piqued the interest of independent analyst Alistair Strang. Here's what his charts may tell us about the future.
30th June 2026 07:29
by Alistair Strang from Trends and Targets

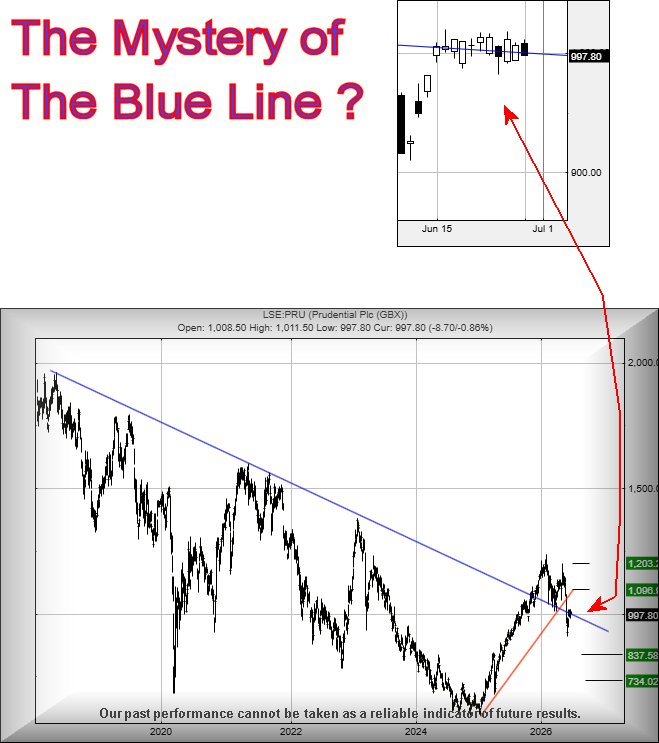
One of our 'things' is to watch carefully for a share price reacting to a trend. In the case of Prudential (LSE:PRU) there’s no doubt the Blue downtrend since 2018 has assumed some importance to the share price.
- Invest with ii:Open a Stocks & Shares ISA | Top ISA Funds | Transfer your ISA to ii
Shares in the Asia focused insurance giant are currently surfing the trend, creating a mildly scary image. But it is worth pausing to consider how the price ended in this situation.
It dropped below the trend at 964p, then achieved some slight recovery above the trend a few days later, then paused. Usually (and in this instance) some confidence can be taken with a price trading above the level of the trend break. In other words, the opposite of a red flag.
If we assume confidence for Prudential, a share price next above just 1,020p (the high following the trend break) should trigger near-term gains to an initial 1,096p with our secondary, if bettered, at a pretty useful looking 1,203p. This secondary becomes a pretty big deal, demanding the share price close above 1,203p to open a long term route toward the 1,400p level.
We are optimistic for gains.
However, if things intend to go wrong, the price only needs below 962p to cause problems, opening a scenario where reversal to an initial 837p looks possible with our secondary, if broken, down at 734p and hopefully a price rebound. Visually, this makes little sense.
Prudential is looking relatively hopeful for the future, though crossing fingers may not be the worst strategy.
Source: Trends and Targets. Past performance is not a guide to future performance. Important: Trends and Targets charts only incorporate official share count consolidations, ignoring rights issues where investors have a choice as to whether to participate.
Alistair Strang has led high-profile and "top secret" software projects since the late 1970s and won the original John Logie Baird Award for inventors and innovators. After the financial crash, he wanted to know "how it worked" with a view to mimicking existing trading formulas and predicting what was coming next. His results speak for themselves as he continually refines the methodology.
Alistair Strang is a freelance contributor and not a direct employee of Interactive Investor. All correspondence is with Alistair Strang, who for these purposes is deemed a third-party supplier. Buying, selling and investing in shares is not without risk. Market and company movement will affect your performance and you may get back less than you invest. Neither Alistair Strang or Interactive Investor will be responsible for any losses that may be incurred as a result of following a trading idea.
These articles are provided for information purposes only. Occasionally, an opinion about whether to buy or sell a specific investment may be provided by third parties. The content is not intended to be a personal recommendation to buy or sell any financial instrument or product, or to adopt any investment strategy as it is not provided based on an assessment of your investing knowledge and experience, your financial situation or your investment objectives. The value of your investments, and the income derived from them, may go down as well as up. You may not get back all the money that you invest. The investments referred to in this article may not be suitable for all investors, and if in doubt, an investor should seek advice from a qualified investment adviser.
Full performance can be found on the company or index summary page on the interactive investor website. Simply click on the company's or index name highlighted in the article.