Worst start to the year in 30 years for investment trusts
13th July 2022 10:28
by Sam Benstead from interactive investor
Similarly managed open-ended funds performed better than trust equivalents in the first half of 2022. Sam Benstead explains why.
Investment trust investors have had an awful start to the year as economic and stock market uncertainty caused share prices to plummet.
The FTSE All Share Closed End Investments Index was down 18.9% in the six months to 30 June, including a decline of 6% in June. This compared with a fall of 4.6% for the FTSE All Share Index in the first half of 2022.
Winterflood, the investment trust analyst, said this was the worst absolute and relative performance for investment trusts in the first half of a calendar year for over 30 years, and noted poor returns was one of the main reasons for losses in UK stock indices this year.
Technology-focused trusts led the declines, including Scottish Mortgage (-41%), Smithson (-38%), Monks (-29%) and Polar Capital Technology (-28%), according to Winterflood.
The analyst said the average trust discount widened from 2.2% at the start of the year to 9.5% at the end of June.
Winterflood added that the outlook was poor for the investment trust sector, saying that market sentiment had “arguably worsened over the last month, reflecting the reality that there are no easy fixes to issues such as inflation, the risk of recession and war in Ukraine.”
- One in three funds have posted double-digit losses so far in 2022
- Trust investors punished as markets fall but are still smiling long term
Similar open-ended funds deliver better performance
Investment trusts performed worse than similar open-ended strategies.
Interactive investor analysis of 10 pairs of similarly managed investment trusts and funds showed that in the first six months of the year just two trusts performed better than their open-ended rivals.
Those were Merchants Trust and Troy Income & Growth. While Merchants Trust returned three percentage points more than sister fund Allianz UK Listed Equity Income , Troy Income & Growth’s return was basically identical to Trojan Income at a 15% loss.
The biggest differences year-to-date are a six percentage points gap between Janus Henderson Smaller Companies trust and Janus Henderson UK Smaller Companies. The trust lost 34%, while the fund lost 28%.
- A tactic to ride out the inflation storm using these funds and trusts
- Fund and trust ideas to income-boost portfolios to beat inflation
There was a seven percentage point gap between investment trust abrdn UK Smaller Companies (-34% return) and abrdn UK Smaller Companies Growth Trust (-41% return), and a five percentage point gap between Henderson European Focus Trust and Janus Henderson European Focus.
However, the data tells a different story when looking over longer time periods. Half of the trusts performed better over 10 and five years, and six out of 10 did over three years.
The use of gearing (or borrowing) by trusts magnifies losses as well as gains, causing them to typically drop more than similarly managed open-ended funds when markets fall but rise more when they go up.
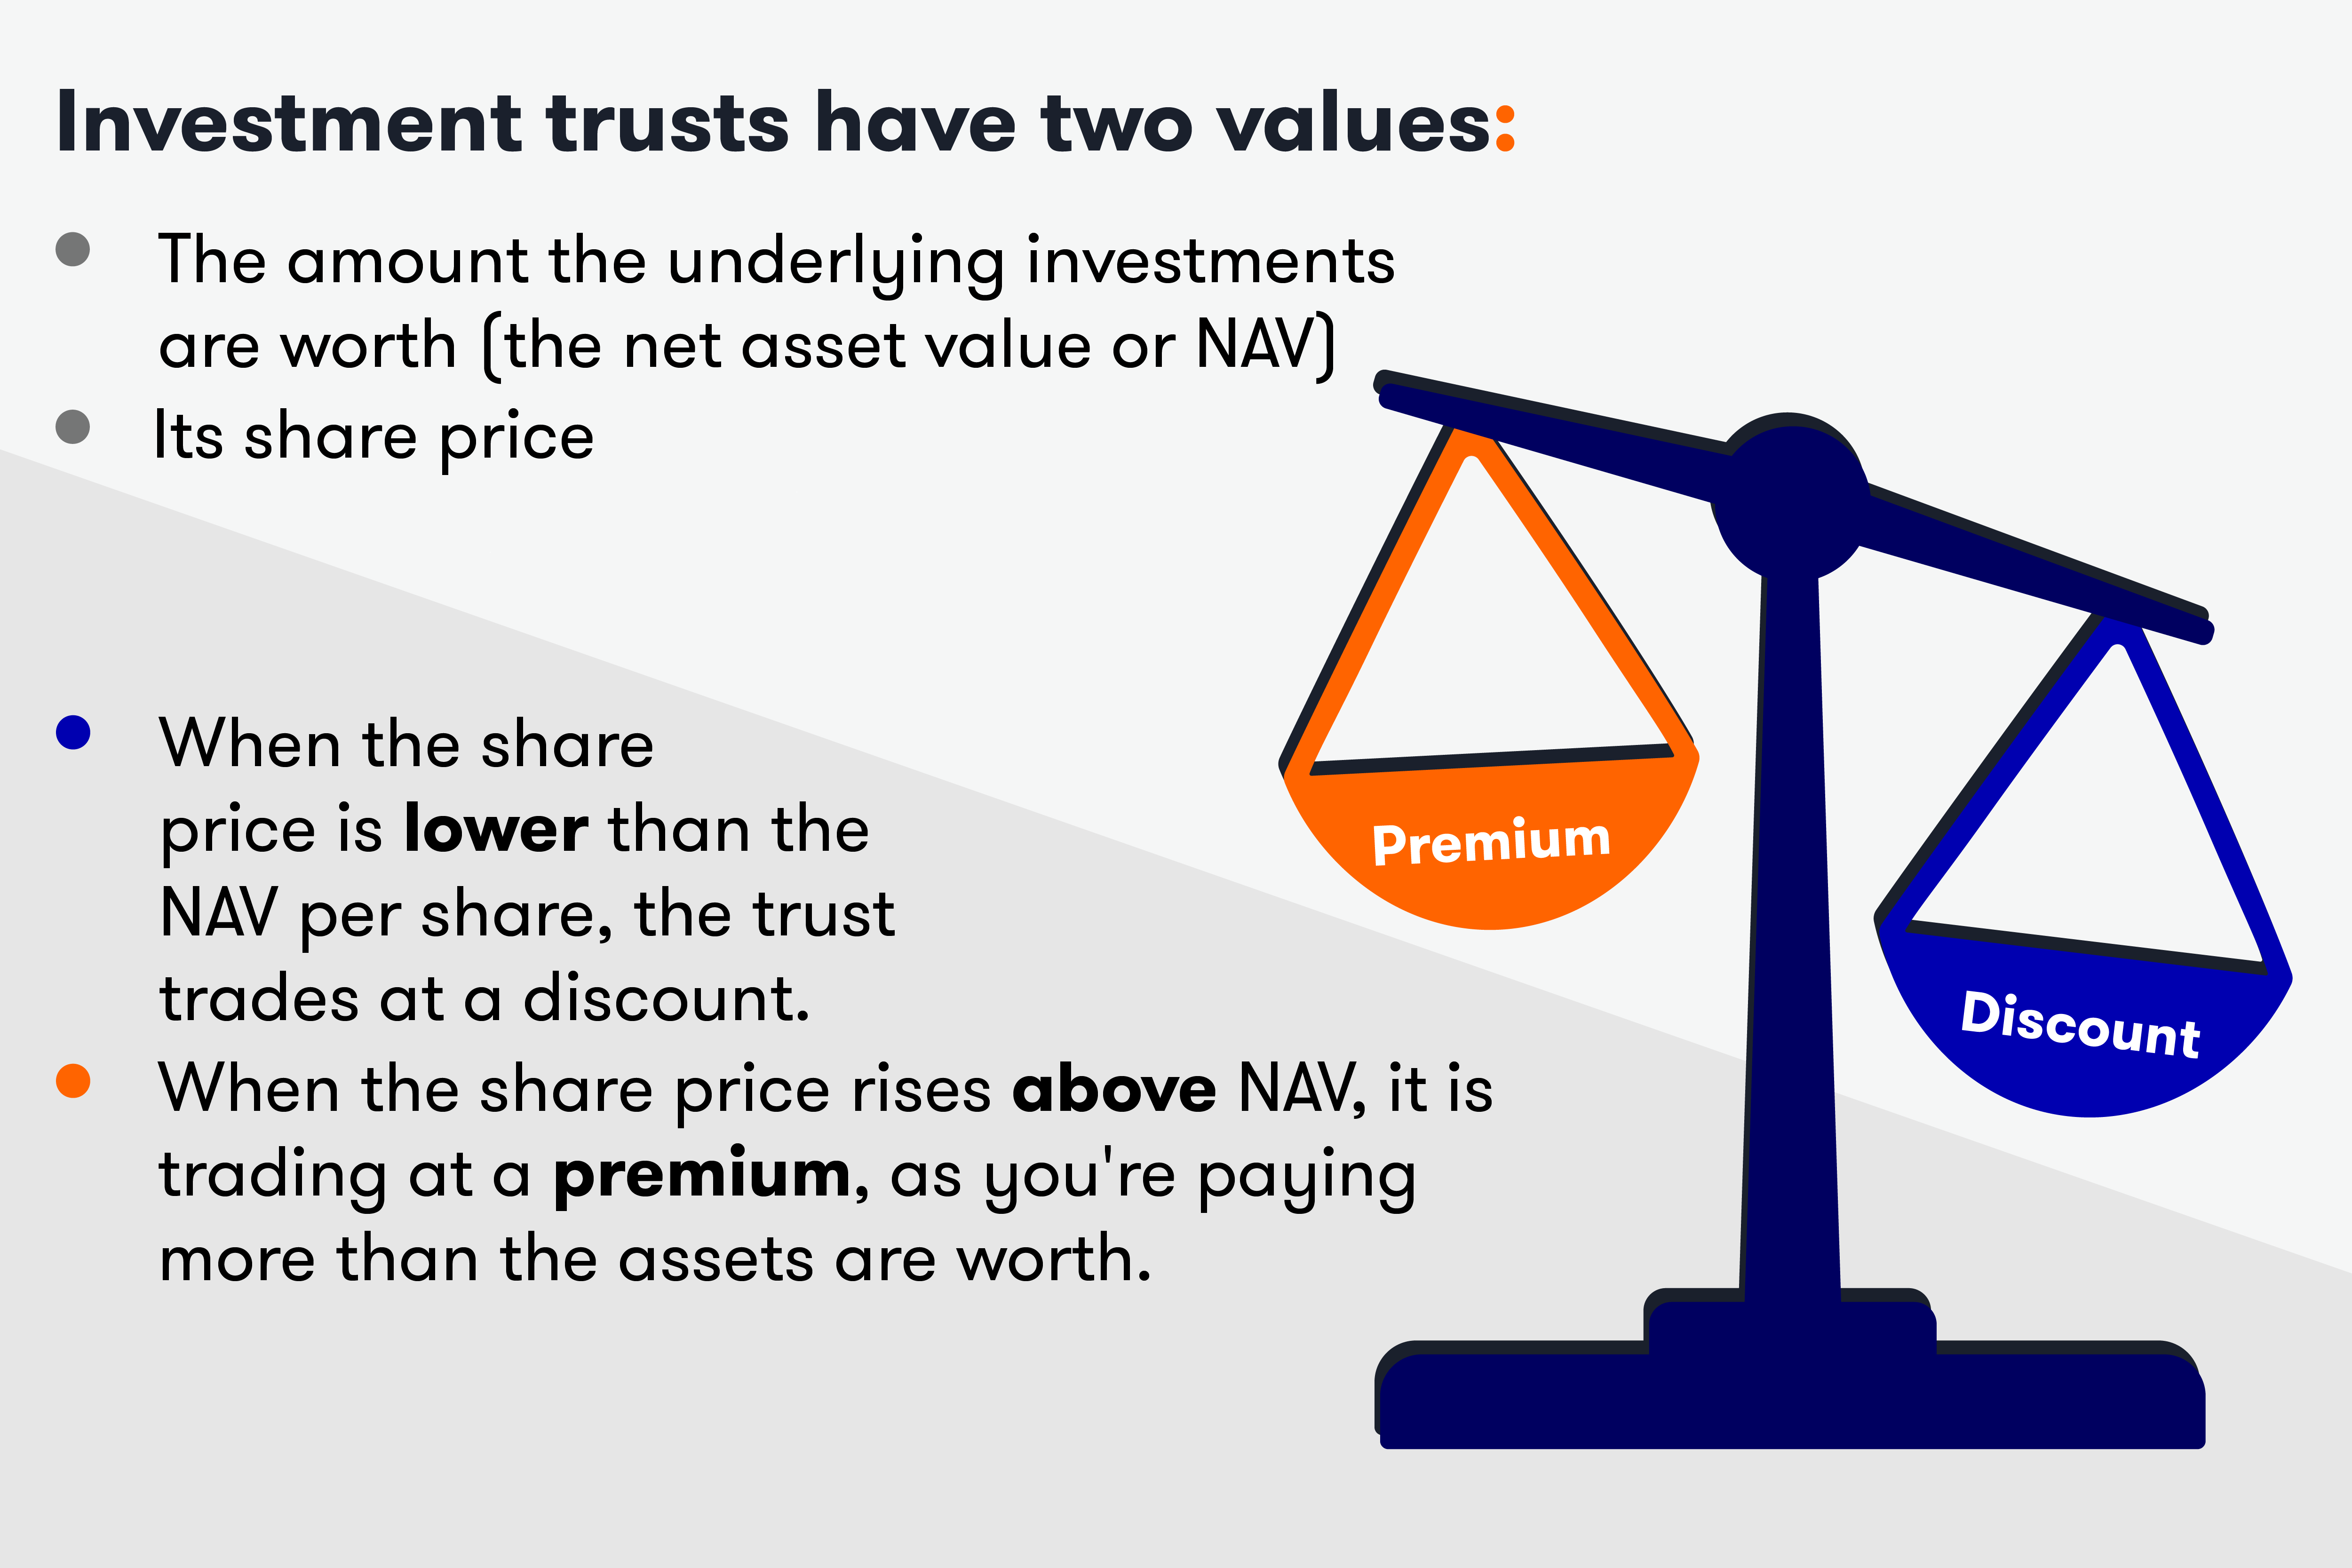
Investment company share prices also trade separately to the value of the investments (the net asset value, or NAV), meaning that wide discounts often open when markets drop.
| Fund/trust | Premium / discount (%) | Return: YTD (%) | 1yr (%) | 3yr (%) | 5yr (%) | 10yr (%) |
|---|---|---|---|---|---|---|
| Merchants Trust | 0.05 | -0.91 | 10.38 | 29.13 | 50.21 | 145.73 |
| Allianz UK Listed Equity Income | -4.24 | 5.08 | 24.93 | 40.07 | 124.93 | |
| Fidelity European Trust | -8.5 | -16.04 | -4.65 | 20.81 | 48.57 | 233.34 |
| Fidelity European | -11.26 | -3.4 | 17.92 | 43.86 | 178.87 | |
| Troy Income & Growth | -2 | -14.64 | -5.45 | -3.67 | 4.26 | 79.46 |
| Trojan Income | -14.81 | -4.59 | -5.53 | 6.15 | 80.77 | |
| abrdn UK Smaller Companies Growth Trust | -14 | -40.35 | -33.17 | -0.82 | 16.48 | 154.35 |
| abrdn UK Smaller Companies | -33.76 | -26.94 | 4.68 | 30.07 | 176.19 | |
| Edinburgh Worldwide | -14 | -40.58 | -45.66 | -4.97 | 51.27 | 248.05 |
| Baillie Gifford Global Discovery | -35.59 | -42.66 | -2.72 | 44.69 | 275.85 | |
| JPMorgan European Discovery | -16 | -29.69 | -18.74 | 9.4 | 14.46 | 264.14 |
| JPM Europe Smaller Companies | -26.7 | -18.4 | 14 | 24.41 | 243.18 | |
| Finsbury Growth & Income | -7 | -15.63 | -10.37 | -10 | 21.69 | 172.5 |
| Lindsell Train UK Equity | -14.5 | -9.26 | -4.15 | 28.2 | 179.96 | |
| Henderson European Focus Trust | -15 | -18.28 | -9.69 | 16.53 | 25 | 184.48 |
| Janus Henderson European Focus | -13.85 | -16.99 | 9.16 | 6.2 | 216.32 | |
| Fidelity Special Values | -4 | -11.84 | -6.94 | 9.11 | 24.36 | 222.13 |
| Fidelity Special Situations | -7.1 | -1.42 | 6.33 | 13.55 | 138.75 | |
| Janus Henderson Smaller Companies | -16 | -34.11 | -34.19 | 1.79 | 18.63 | 234.39 |
| Janus Henderson UK Smaller Companies | -28.03 | -24.72 | 7.64 | 18.71 | 179.32 |
These articles are provided for information purposes only. Occasionally, an opinion about whether to buy or sell a specific investment may be provided by third parties. The content is not intended to be a personal recommendation to buy or sell any financial instrument or product, or to adopt any investment strategy as it is not provided based on an assessment of your investing knowledge and experience, your financial situation or your investment objectives. The value of your investments, and the income derived from them, may go down as well as up. You may not get back all the money that you invest. The investments referred to in this article may not be suitable for all investors, and if in doubt, an investor should seek advice from a qualified investment adviser.
Full performance can be found on the company or index summary page on the interactive investor website. Simply click on the company's or index name highlighted in the article.