As goes January, so goes the year: trading signal or noise?
Far from being a useless indicator, analyst John Ficenec believes that performance in January is demonstrating something more profound about markets that can indeed help investors.
2nd February 2026 10:17
by John Ficenec from interactive investor

The old stock market adage “As goes January, so goes the year” offers an alluring promise of predictive power. What’s more, some recent research suggests January has a solid track record when it comes to returns for rest of the year. With that in mind, I look at what this January has shown us and consider what reading the runes from the first month of the year can show.
- Invest with ii: Top UK Shares | Share Tips & Ideas | Cashback Offers
Signal or noise?
An analysis of the “January Barometer” by The Wall Street Journal shows that if the S&P 500 ends the month higher, then the rest of the year will follow 79% of the time. That kind of track record would be the envy of any fund manager, so why aren’t more people following the trend?
All is not quite as it seems, however. Looking at a century of S&P 500 data, Fisher Investments found that even when the market fell in January the rest of the year was still up 21% of the time. It said, “the main takeaway is that stocks tend to rise more than they fall - both in terms of months and calendar years.”
So, what January is really showing us in miniature is a reflection of stock markets in general, namely that they tend to rise. You need only look at a historical chart for the FTSE 100 or S&P 500 to prove the point. But far from being useless, I think January is demonstrating something more profound about markets that can indeed help investors.
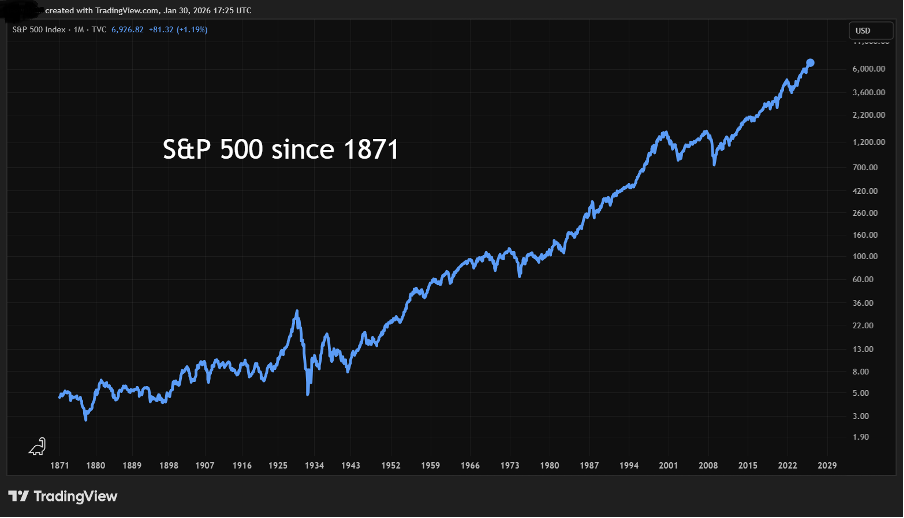
Source: TradingView. Logarithmic scale (data based on percentage changes rather than equal amounts). Past performance is not a guide to future performance.
Bubbles and snowflakes
There has been much talk of bubbles recently, particularly in the technology sector around artificial intelligence (AI). But for the bubble to pop you have to believe that company valuations form a bell curve, or a normal distribution. If we are currently at the extreme, then tech valuations have to return to the norm, or what goes up, must come down. The only problem with the bell curve, is that it is consistently disproved when it comes to markets, and we often get many more extreme events lasting far longer than anyone expects.
- 10 shares to give you a £10,000 annual income in 2026
- Insider: more big deals part of director stakebuilding
The normal distribution sits alongside some other rather clunky market theory such as the random walk, where each price movement is entirely independent of the last, and the efficient market hypothesis that posits all information is in the price at any point in time. Both of which I would argue don’t pass muster.
No, far more interesting is mathematician Benoit Mandelbrot’s work on the application of fractal geometry in financial markets. Fractals are the idea that in nature what appears in miniature when repeated on scale forms the whole. So, take the shape of a leaf, a branch and a tree all repeat, with the same in snowflakes and the formation of coastlines. Which brings us back to January - it is at the same time an echo of the previous year and the year ahead in miniature, but not exactly. So, what is January 2026 showing us?
January geometry
The US market is lagging, and in particular the big tech sector has been a mixed bag, with Meta Platforms Inc Class A (NASDAQ:META) and Apple Inc (NASDAQ:AAPL) soaring but Microsoft Corp (NASDAQ:MSFT) slumping, with the S&P 500 index gaining 1.4%, or adjusting for currency, nowhere. The surprise was that smaller US companies listed on the Russell 2000 have stormed out of the gate with a 5.3% gain, its best start to the year since 1987.
This picture was largely repeated in the UK, with the mega-cap names on the FTSE 100 gaining 2.9%, while the mid-cap FTSE 250 was up 3.5%, but the smaller AIM All-Share index crushed both at 6.7%
Across Asia, the Nikkei in Japan, the Hang Seng in Hong Kong and the Shanghai Composite all did well. But the standout performer so far this year has been Brazil, with the Bovespa jumping over 12% as soaring commodity prices boost miners and the banks that fund them, and a weaker dollar has helped emerging markets which largely borrow in US dollars. Europe has thus far had a muted start to the year with Germany’s DAX up just 0.2% and France slipping 0.3%.
Index | Price | January 2026 (%) | One-year change (%) |
Bovespa (Brazil) | 181,364 | 12.6 | 43.8 |
Hang Seng (Hong Kong) | 27,387 | 6.9 | 35.4 |
AIM All-Share | 818 | 6.7 | 13.8 |
Nikkei 225 | 53,323 | 5.9 | 34.7 |
Russell 2000 | 2,613 | 5.3 | 14.3 |
SSE Composite (Shanghai) | 4,118 | 3.8 | 26.7 |
FTSE 250 | 23,253 | 3.5 | 11.0 |
FTSE 100 | 10,224 | 2.9 | 17.9 |
Dow Jones | 48,893 | 1.7 | 9.8 |
S&P 500 | 6,939 | 1.4 | 14.9 |
NASDAQ Composite | 23,462 | 0.9 | 19.5 |
DAX (Germany) | 24,539 | 0.2 | 12.9 |
CAC 40 (Paris) | 8,127 | -0.3 | 2.2 |
Swiss Market Index | 13,188 | -0.7 | 4.7 |
S&P BSE 100 (Mumbai) | 26,536 | -3.0 | 7.8 |
Source: ShareScope.
Green shoots
The reason for the strong performance of small-cap shares on both sides of the Atlantic is that the latest data shows signs of increased growth in both economies. In the US, the GDP figures for the third quarter in 2025 were revised up to 4.4%, from an estimate of 4.3% and 3.8% in the previous quarter. That is a healthy gain on the previous three years when growth was below 3% in 2022, 2023, and 2024.
There is increased optimism in America, as monitored by the National Federation of Independent Businesses (NFIB). Their survey was up 0.5 points in December to 99.5 and remained above its 52-year average of 98. Also, the Fiserv Small Business Index, which tracks spending at the tills in two million small businesses across the States, showed December sales increased 0.8% over the previous month, while transaction volume remained flat. So, not much yet but undeniable improvement.
- Shares for the future: my response to reader feedback
- Stockwatch: an exciting share off the radar of most investors
In the UK, the progress is more muted with GDP growth for November up a mere 0.3%, but it was ahead of expectations, and analysts expect a continued rebound in the first quarter of 2026. This is all against a backdrop of falling inflation, rising real incomes, and increased retail spending in December alongside households turning more optimistic, according to the latest GfK tracker. UK business optimism and order books have also improved, according to the latest Confederation of British Industry (CBI) survey.
Small businesses are typically higher risk, lower dividend paying, higher-return investment options, and they have gone nowhere for the past five years as they have been battered by rising costs and political uncertainty. The jump in share prices reflect investor repositioning given the information we have.
Global indicators
Clues as to the health of the global economy for the year ahead can be found elsewhere. Commodities essential for growth are a useful guide, with the price of iron ore at $106 per tonne, which is well up from the lows of $50 a decade ago and point towards healthy demand. The coal needed to turn iron into steel is also in high demand, with analysts forecasting a rise in the year ahead from the current $105 per tonne. Oil at around $70 a barrel should ease inflation pressures, as it is well below the $120 it reached in early 2022 after Russia invaded Ukraine, and is supportive of growth.
Copper, or Dr Copper as it’s also known because it is essential in construction, electronics and industry, also offers clues. If that is the case, then it is giving a clean bill of health, with the price reaching an all-time-high at $13,310 per tonne in January.
This picture is repeated in other indicators such as the Baltic Dry Index, which shows the cost of moving bulk commodities like iron, coal and copper around the world by sea, demand is strong and prices are rising in January.
Precious metals like gold and silver also rocketed to record highs, although there has been a pullback in recent sessions. It was not only speculative investors and central banks doing the buying, there’s also been increased demand from industry and electronics manufacturers too.

Large cargo ship taking on coal. Credit: dan_prat.
Taking credit
One area of concern has been wobbles in the US private credit market, but the wider credit markets are otherwise sanguine. The benchmark US index for investment-grade credit is close to its lowest level since pre-Covid, and the riskier high-yield, or junk bond index fell below pre-Covid levels in January. So, while record amounts of debt are being issued, there is more than enough demand from investors.
Again, this picture is repeated in the volatility index, or VIX, otherwise known as the investor fear gauge. It moved lower in January and is well below long-term averages, demonstrating strong investor appetite for risk.
Currency wars
Another area where we’re seeing stresses and strains is currency markets. US President Donald Trump’s rhetoric and geopolitical randomness pushed the dollar down again in January to its lowest level in four years.
Big spending plans in Japan have also caused a collapse in the value of the yen, which was only arrested by talk of the government intervening to support the currency. This all comes against a backdrop of record government indebtedness around the world, but there is nothing new here and we’ve been managing record debts since 2021.
Lessons from January
January may not have any predictive powers then, but I think that is to miss the far more invaluable insight it gives investors. January itself is merely a reflection, or an echo, of markets past, but at the same time what is yet to come to pass. Namely governments printing money to encourage the growth and stoke the inflation required to reduce record debt levels, without running too hot to lose votes at the ballot box.
The persistent inflation, weak dollar, high gold prices, and record share prices in January are just a continuation of this. January’s value is in showing us that much like the tree or snowflake, it is broadly similar but slightly different. Higher growth is forecast to return this year, along with big spending plans in the US, interest rates are falling, conditions in the real economy are improving.
- BT, Vodafone and BAT to reward income investors in February
- Sign up to our free newsletter for investment ideas, latest news and award-winning analysis
This is not to ignore the myriad risks both financial and geopolitical in the year ahead, rather to demonstrate that to make an investment decision based on something that hasn’t happened and may never is a fool’s errand.
Making any investment decision is a daunting proposition, but the information we have so far is clear. The US economy is once again more resilient than expected, with a better performance from smaller companies likely, but dollar assets will struggle due to a weak currency.
In the UK, a stronger pound and performance from smaller companies should help returns. Fundamentally, one of the best investments this year would be to put the doom-laden newspapers down and hold equities and a bit of gold to protect wealth from inflation and benefit from the growth.
John Ficenec is a freelance contributor and not a direct employee of interactive investor.
These articles are provided for information purposes only. Occasionally, an opinion about whether to buy or sell a specific investment may be provided by third parties. The content is not intended to be a personal recommendation to buy or sell any financial instrument or product, or to adopt any investment strategy as it is not provided based on an assessment of your investing knowledge and experience, your financial situation or your investment objectives. The value of your investments, and the income derived from them, may go down as well as up. You may not get back all the money that you invest. The investments referred to in this article may not be suitable for all investors, and if in doubt, an investor should seek advice from a qualified investment adviser.
Full performance can be found on the company or index summary page on the interactive investor website. Simply click on the company's or index name highlighted in the article.