ii investment performance review 2021
14th January 2022 13:08
by Dzmitry Lipski from interactive investor
As Covid rumbled on, technology stocks performed well once more on an acceptance of a shift to longer-term hybrid working.

Market round-up
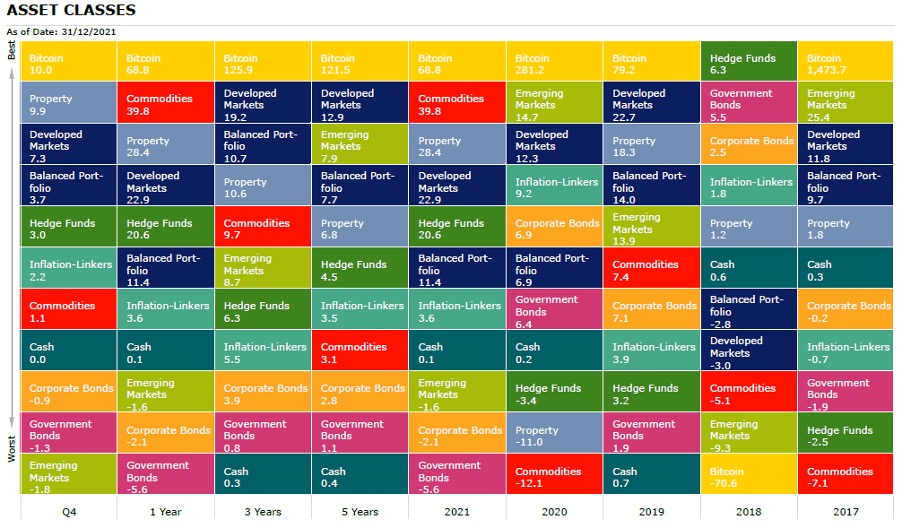
2021 was another good year for riskier assets, with Global Equities posting 20% gains in Sterling terms, while conversely Gilts and Global Bonds posted their worst returns in over a decade. Developed equity markets were the key winners, all posting double-digit returns, with the US once again performing the strongest with returns nearing 30% for the S&P 500 for 2021. That index has doubled in three years, compared to a return of just 27% from the FTSE All-Share. Between 2011-2021, in base currency terms, the S&P 500 has outperformed the All-Share in every year except for 2016.
Emerging Market (EM) equities, normally a good barometer for global risk appetite, bucked the trend this year, posting a loss of around 5% in US dollar terms. As is often the case, China was a key driver, with worries around liquidity and credit compounded by worries around policy and regulation. E-commerce giant Alibaba (NYSE:BABA) shed almost 50% and the EMQQ Emerging Markets Internet & e-commerce ETF (LSE:EMQQ) lost 32% for the year and almost 50% since February highs. Looking at the volatility across markets, while having the odd scare, the VIX volatility index currently sits around 25% lower than at the beginning of 2021.
- Check out our award-winning stocks and shares ISA
- Private Investor Index: ii customers beat professional investors in 2021
Investors looked through a number of significant challenges in 2021. Covid variants, Delta and latterly Omicron, threatened to dampen the pace of recovery while the threat of inflation became a very real issue alongside very tight labour markets. Central banks, having spent years trying to coax inflation from the economy, are now considering how they should stop it. Despite these speed bumps investors in general remained of the view that the recovery, led by a rapid vaccination take up, was underpinned by strong economic fundamentals and a belief that consumers would more than make up for lost spending. This began to be evidenced with consistently strong earnings performances in most equity markets.
The main support for markets, however, as has been the case for a number of years now, has been loose monetary policy. This loose policy was expanded even further over the course of the pandemic, with central banks reluctant to act too soon and potentially cause an economic contraction. They consequently left policy accommodative throughout the year to allow economies to prosper, and while this policy has begun to taper at the end of the year, 2021 was another year of cheap credit and money printing driving asset prices higher.
Source: Morningstar. Total returns in GBP as at 31/12/21
Shares
Globally across equity markets, when looking at the difference between Growth and Value investing styles, vaccine optimism saw Value 10% ahead of Growth through June, but then Growth fought back to be 5% ahead at the start of December, before Omicron developments helped Value perform well in the end-of-year rally, to reach parity of performance. Interestingly, mid-cap shares generally outperformed large and small caps, as these tend to have the highest level of cyclicality.
- Friends & Family: ii customers can give up to 5 people a free subscription to ii, for just £5 a month extra. Learn more
- Read more of our content on UK shares here
The equity market that did not do so well was Emerging Markets and, of course, China, although double-digit returns from the value markets of India, Brazil and Russia prevented EM returns as a whole from being too negative as investors played the recovery and diversified their EM exposure away from the ailing EM tech stocks. China’s woes started with the well-publicised issues at property developer Evergrande (SEHK:3333), which continue to rumble on, but also a raft of new regulations, with the most impactful of them concerning data, citing national security concerns over leaks and failing to identify buyers of Chinese data. This impacted index top weight Alibaba the most, as it uses a vast amount of data and has to personalise experiences for vendors and customers given the size of the platform.
Performance (%) | ||||
Q4 | 2021 | 3 Years | 5 Years | |
S&P 500 | 10.53 | 29.89 | 23.51 | 16.32 |
India* | -0.66 | 27.40 | 13.84 | 12.99 |
FTSE Small Cap | 0.71 | 23.04 | 16.14 | 10.86 |
World | 7.28 | 22.94 | 19.23 | 12.94 |
Russia* | -9.60 | 20.11 | 13.91 | 8.49 |
FTSE 100 | 4.74 | 18.44 | 7.12 | 4.66 |
FTSE All Share | 4.20 | 18.32 | 8.34 | 5.42 |
FTSE 250 | 2.39 | 16.90 | 12.87 | 8.00 |
Europe Ex UK* | 5.20 | 16.73 | 14.61 | 9.47 |
TOPIX Japan | -5.18 | 2.02 | 8.61 | 6.30 |
Emerging Markets | -1.76 | -1.64 | 8.69 | 7.88 |
Asia Pacific Ex Japan* | -1.22 | -2.00 | 10.03 | 8.79 |
Brazil* | -6.89 | -16.64 | -7.39 | -0.98 |
China* | -6.48 | -21.00 | 5.58 | 7.37 |
Source: Morningstar. *MSCI. Total returns in GBP as at 31/12/21
Sectors
The combination of economic recovery and loose monetary policy saw two industry sectors stand out from the rest, notably Energy and Technology. Oil prices began the year at around $50 a barrel and touched $85 in November, before pulling back to around $75 at year-end, driven by the economic recovery and OPEC holding firm against requests to boost production.
- Watch our new year share tips here and subscribe to the ii YouTube channel for free
- Take control of your retirement planning with our award-winning, low-cost Self-Invested Personal Pension (SIPP)
While Energy companies did well, many parts of the world faced an energy crisis, with smaller suppliers going bust in the face of the rapidly rising price of Natural Gas. This partly contributed to the poor performance of the Utilities sector, which was the worst performer, albeit still posting double-digit returns. Some of the utility providers have been unable to deal with the rapid price increases as a combination of regulation and how they collect cashflows prevents them from passing on price increases in time. The sector is also seen as defensive so, in the risk-on environment, it would be expected to lag.
Commodities as a whole performed very strongly, with Precious Metals being a notable exception. Technology stocks, on higher multiples, performed well once more on the easy monetary outlook and an acceptance of a shift to longer-term hybrid working. They also received boosts from new variants, which continued to delay both a return to a fully in-person world and also delayed the tightening of monetary policy. Consumer Staples was another poorly performing sector, where again the market backdrop favoured risk and recovery as opposed to solid earnings compounders.
Performance (%) | ||||
Q4 | 2021 | 3 Years | 5 Years | |
Energy | 4.00 | 41.38 | 0.21 | -2.92 |
Information Technology | 12.73 | 31.04 | 37.33 | 27.61 |
Real Estate | 10.25 | 29.88 | 12.23 | 8.05 |
Financials | 3.31 | 29.05 | 13.61 | 7.71 |
Health Care | 7.42 | 20.91 | 16.37 | 13.43 |
Consumer Discretionary | 7.93 | 19.02 | 24.24 | 16.81 |
Industrials | 5.39 | 17.67 | 16.09 | 10.19 |
Materials | 9.54 | 17.39 | 17.40 | 10.95 |
Communication Services | -2.16 | 15.41 | 18.99 | 9.25 |
Consumer Staples | 9.02 | 14.10 | 12.06 | 7.51 |
Utilities | 10.75 | 10.85 | 9.85 | 8.31 |
Source: Morningstar. Total returns in GBP as at 31/12/21
Bonds
Given the very strong year for risk, it is perhaps not surprising to see bonds fail to perform, although the losses are greater than in any year in the previous decade. This is because of the key addition of inflation as a concern, reaching levels that we have not seen for such an extended period. Taking gilts as the example, given their longer duration, they experienced three of the six worst months of the last decade in 2021, including the worst in February where, despite muted equity markets, the advancement of the vaccination program saw yields rise rapidly (relative to where they were).
Globally the picture wasn’t as bad, but losses were still large as rates rose in the face of the tight labour market and consistently increasing inflation figures in the US. Corporate bonds fared better given the improving earnings picture, however the inherent duration prevented positive returns. High Yield posted gains given the overall risk sentiment.
Performance (%) | ||||
Q4 | 2021 | 3 Years | 5 Years | |
UK Inflation Linked | 4.65 | 3.91 | 7.15 | 4.66 |
Global Inflation Linked | 2.25 | 3.64 | 5.54 | 3.51 |
Global High Yield | -1.19 | 2.30 | 5.41 | 3.89 |
Global Corporate | -0.90 | -2.06 | 3.91 | 2.80 |
Sterling Corporate | 0.40 | -3.03 | 4.65 | 3.31 |
Global Aggregate | -1.12 | -3.83 | 1.49 | 1.48 |
UK Gilts | 2.42 | -5.16 | 3.16 | 2.37 |
Global Government | -1.27 | -5.55 | 0.78 | 1.15 |
EURO Corporate | -2.98 | -7.21 | 0.35 | 1.43 |
Source: Morningstar. Total returns in GBP as at 31/12/21
Commodities and Alternative investments
Direct property funds in the UK delivered good returns, with many in double digits, but it was US real estate investment trusts (REITs) that really stood out. With a return above 40% as the recovery really benefited some of the more cyclical names, Regional Malls gained over 90% and shopping centres gained over 60%. Apartments also gained over 60% and even the laggards of healthcare and offices were above 15%. Within sector equity funds, Biotech and Precious Metals funds faltered, but private equity funds performed very strongly, with a record number of IPOs over the year and a broader acceptance of private markets as an asset class.
Performance (%) | ||||
Q4 | 2021 | 3 Years | 5 Years | |
Brent Crude Oil | -1.39 | 51.54 | 10.77 | 4.54 |
Commodity | 1.06 | 39.83 | 9.70 | 3.07 |
UK REITs | 11.08 | 28.92 | 12.29 | 6.77 |
Global Natural Resources | 6.84 | 26.35 | 11.58 | 7.65 |
Hedge Funds | 2.98 | 20.62 | 6.34 | 4.51 |
Global Infrastructure | 4.11 | 12.90 | 7.97 | 5.83 |
Cash | 0.02 | 0.06 | 0.33 | 0.38 |
Gold | 4.68 | -2.87 | 10.12 | 7.45 |
CBOE Market Volatility (VIX) | -24.01 | -23.61 | -13.96 | 2.27 |
Source: Morningstar. Total returns in GBP as at 31/12/21
Most-traded shares on the ii platform in 2021
These articles are provided for information purposes only. Occasionally, an opinion about whether to buy or sell a specific investment may be provided by third parties. The content is not intended to be a personal recommendation to buy or sell any financial instrument or product, or to adopt any investment strategy as it is not provided based on an assessment of your investing knowledge and experience, your financial situation or your investment objectives. The value of your investments, and the income derived from them, may go down as well as up. You may not get back all the money that you invest. The investments referred to in this article may not be suitable for all investors, and if in doubt, an investor should seek advice from a qualified investment adviser.
Full performance can be found on the company or index summary page on the interactive investor website. Simply click on the company's or index name highlighted in the article.