Investment trusts and the income safety net
A strong pound threatens UK dividends, so look at how UK equity income trust managers stand prepared.
6th December 2019 15:50
This content is provided by Kepler Trust Intelligence, an investment trust focused website for private and professional investors. Kepler Trust Intelligence is a third-party supplier and not part of interactive investor. It is provided for information only and does not constitute a personal recommendation.
Material produced by Kepler Trust Intelligence should be considered a marketing communication, and is not independent research.
A sterling bounce threatens UK dividends - we look at how UK equity income investment trust managers stand prepared.

Holding something in reserve
Callum Stokeld, investment trust research analyst at Kepler Trust Intelligence.
It used to be said that in central London you were never more than six feet from a rat. Nowadays, the saying has been updated: you are never more than six feet from a Pret-a-Manger. Before Pret came McDonald’s (NYSE:MCD), serving the same burgers in the same buns from London to Tokyo. Such was the ubiquitous nature of the fast food giant that in 1986 The Economist launched the ‘Big Mac Index’. Presently, this famous index of relative currency strength suggests sterling is seriously undervalued[1].
Sterling has certainly been weak since the 2016 Brexit referendum, and remains c.12% below its level on the day before the Brexit vote. Yet it has climbed c.8% from its lowest point in August (as of 26 November) as a no-deal Brexit appears to be off the table.
We believe a more sustained rebound in the currency could be on the horizon – at least, assuming the Conservatives win the general election. This could be good news for those owning UK assets but, for UK companies with overseas earnings, it might make meeting and growing dividends more challenging. For UK large-caps in particular, a further rise in sterling could lead to dividend growth being weak, given the large proportion of those companies’ earnings are derived from overseas.
Open-ended equity income funds will have no protection against this, but it is exactly the sort of environment where the closed-ended structure can shine. By being able to build up revenue reserves, investment trusts have the ability to build up a safety net against this sort of eventuality, as we discuss below.
I'm lovin' it
The Big Mac Index uses the relative affordability of Big Macs in different countries to measure the strength of their currencies. Presently, as noted above, it suggests sterling is undervalued. This is supported by the most recent IMF numbers which estimate sterling to be undervalued by about 10% on a purchasing power parity basis (they estimate the justified value of sterling relative to the US dollar to be c.1.42[2] compared to c.1.29 in the market at time of writing). They also estimate sterling to be undervalued against the euro, the largest component of the trade-weighted sterling index.
This does not, of course, mean a c.10% rally in sterling/US dollars is necessarily in the offing. Keen observers of the UK media may have noticed an ongoing general election campaign, which has more than one possible outcome. Furthermore, even if the result is a pro-Brexit working majority, the tortuous saga endured since June 2016 should make us wary of assuming the way ahead will be smooth.
In the last couple of years we have seen international investors take up significant strategic underweight positions to sterling which we think could unwind. Bank of America Merrill Lynch fund manager surveys have repeatedly shown that investors are significantly underweight UK assets, and data from Danske Bank paints a similar picture[3]. However, in recent months we have seen sterling has tended to rise with newsflow suggesting or confirming progress on a revised Brexit deal with the EU, but also when polling suggests a Conservative majority. Should these outcomes emerge, we believe international investors will be ready to return to the UK.
Overseas earnings
Investors looking for income from UK equities should be aware of this sterling ‘risk’. Whilst a rise in sterling will make a trip abroad relatively cheaper, it will likely pose some challenges to earnings, and therefore by extension, dividends of the FTSE All Share index.
Around 70% of earnings in the FTSE All Share come from overseas. When sterling falls, this boosts reported profits, while the opposite is also true: for example, if we saw a 10% rise in sterling relative to the US dollar, this would suggest US$100 of earnings would translate to c.£70 in sterling rather than c.£77 at current rates.
Whilst not a solid and intractable rule (other factors are of course at play), the broad relationship can be seen in the chart below. In this we can see the earnings per share (EPS) of the FTSE All Share and FTSE 250 against trade-weighted sterling. The EPS indices are inverted, so a rising line implies falling earnings, and have been brought back a year (so the 01/11/2019 data point is displayed at 01/11/2018 on the graph). This is to show the effect a move in sterling a year previously has had on EPS now, given the delayed effect.
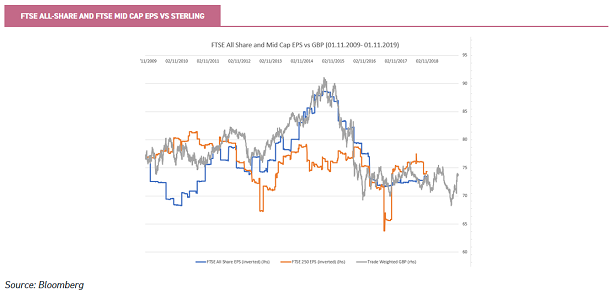
We can also see that the mid-cap index, where a higher proportion of earnings are domestically sourced, shows a much weaker relationship to sterling movements. Other factors are undoubtedly at play (for instance, the oil price collapse in 2015), but this shows that a roughly inverted relationship between sterling strength and the rate of earnings growth has been the case in the past, and is to be expected in the future.
Investors might hope that companies can absorb any impact of a sterling rise by raising their payout ratios (the fraction of net income paid out as dividends). Below we can see this has happened in the past: the payout ratio of the FTSE All Share has a positive relationship with sterling.
This makes sense as, if earnings fall, companies will have to pay out a greater proportion of their income to maintain or grow their dividends. The spike seen in payout ratios in 2015 will, again, have been significantly influenced by the collapse in the oil price and the impact on Royal Dutch Shell and BP (major dividend payers in the UK market), but the general relationship holds true.
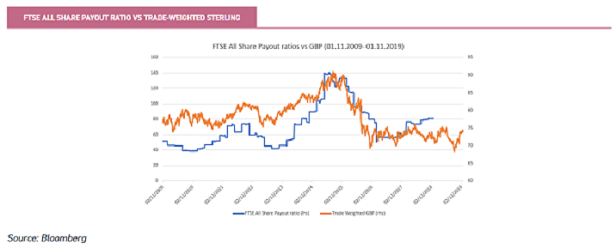
Whilst payout ratios have been higher over the past ten years, at 80%, we are in precarious territory. This is 36% higher than the decade long median, and higher than c.78% of data points over this period (source: Bloomberg). The last decade has itself seen average payout ratios inflated by the effects of the oil price crash and the financial crisis. To us, this suggests limited room for manoeuvre for UK companies. Considering the low productivity growth in the economy and low levels of capex, it has to call in question the willingness and ability of companies to maintain or raise their dividends in the face of a decline in earnings.
Revenue reserves
Closed-ended investment trusts are required to pay out a minimum of 85% of distributable income generated from their holdings, unlike their open-ended counterparts who are required to distribute all income. This allows them the option of using strong years to build a ‘revenue reserve’, giving boards the option in leaner years of paying income from balance sheet reserves. This can help ensure dividends (or dividend trajectories) are maintained in the event that natural income streams are impaired by falling earnings, stretched payout ratios or economic contraction.
As such, we therefore think they are a natural place for open-ended investors to turn if they are concerned about a rise in sterling leading to weak dividend growth or even cuts. Most investments trusts that pay a dividend use this part of the toolkit, and is a significant advantage they have over open-ended funds. The below table shows the current level of dividend yield and dividend cover (the ratio of income to dividends paid) from trusts in the AIC UK Equity Income sector. We also include the most recent revenue reserves and what these represent as a multiple of their 2018 dividend.
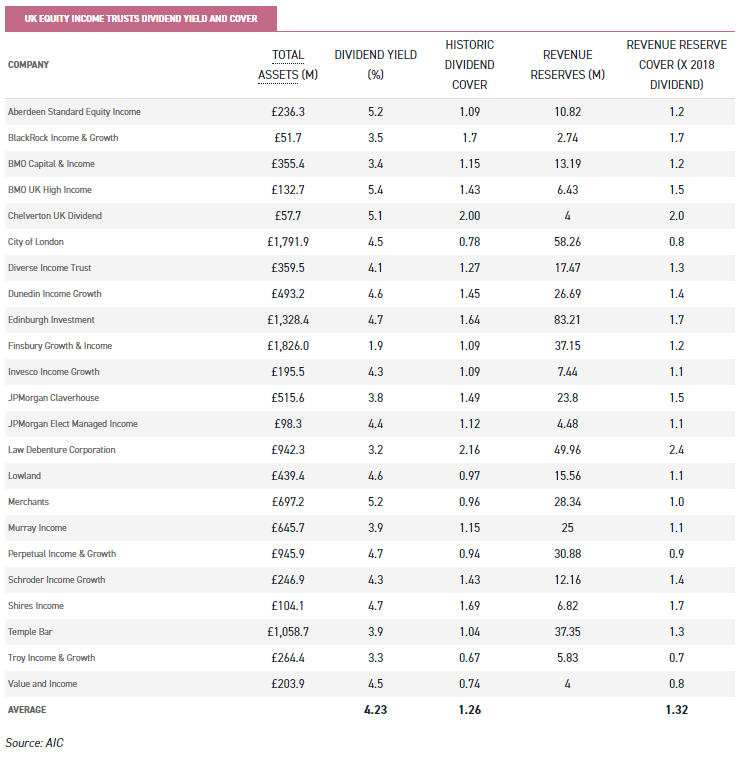
There is, of course, no right or wrong answer as how much reserves should be held, any more than there is to what level of dividend should be paid out. What we can see, however, is that most managers and boards of UK equity income trusts have a decent dividend safety net which they may or may not choose to use.
Conclusion
Rallies in sterling have historically tended to lead to UK equities outperforming global markets in sterling terms, so there is some comfort for UK equity investors here. However, as we have discussed, if we were to see a rally in sterling, this could put a strain on dividends in UK large caps and could certainly impede dividend growth or precipitate dividend cuts. With c.54% of FTSE 100 dividends paid by the top ten dividend payers, any decision to hold or cut their dividend by any of these companies could have seriously negative consequences for UK equity income investors. Yet, with investment trusts across the sector having built up revenue reserves equivalent to an average of 1.3x historic dividends, shareholders have what unit-holders do not – an income safety net.
It is precisely this ‘safety net’ that has helped many trusts, such as the City of London (LSE:CTY), grow their dividends over many years irrespective of wider conditions. CTY stands out in this regard: it has now increased its dividend for 53 years in a row; and the manager, Job Curtis, has been in charge since 1991, and has himself a track record of 28 years of dividend increases. Income generated by the trust’s portfolio has, of course, grown over this time, but the board has used the revenue reserve as a supplement on seven occasions to ensure that investors continue to see growing dividends. Thus, even whilst CTY’s EPS earnings per share (EPS) fell by c.12% over the period 2008-10, the dividend per share (DPS) grew by 9% over the same period.
Headline dividend cover figures, as above, are informative, but do not tell the whole story. Certain trusts can operate with a lower level of headline dividend cover because the companies they invest in themselves have higher levels of dividend cover, making it less likely they will have to cut the dividends the trust receives.
Troy Income & Growth (LSE:TIGT) is an example of this. The managers have successfully grown dividends in both nominal and inflation-adjusted terms every year since they took over management in 2009. The managers have a concern for capital preservation and aim to identify ‘quality’ companies with strong balance sheets and (generally) noncyclical earnings streams. Thus, their actual portfolio has a superior level of dividend cover relative to the FTSE All Share. Their concern for protecting investors’ capital has meant they have recently made adjustments to take on slightly more exposure to lower yielding stocks which nonetheless offer more sustainable dividends; the board allowed them to utilise the revenue reserve to ensure dividends continued to grow in real terms.
Both BlackRock Income and Growth (LSE:BRIG) and Dunedin Income Growth (LSE:DIG) also seem to offer plenty of scope to continue to grow their dividends even in adverse conditions. DIG is targeting using some of its ample revenue reserve to maintain dividends as it continues to transition the strategy to a greater focus on companies with better growth and dividend growth prospects, accepting this may be a short-term headwind to portfolio level dividends.
Dividend growth is an explicit aim of BRIG, with the managers seeking reasonable distributions which they can grow along with capital over time. The managers of BRIG are part of the wider UK equity at BlackRock, who have successfully grown distributions in their open-ended UK equity income product every year for 30 years.
They have been similarly successfully in growing distributions from BRIG since they took over management in 2012, but the revenue reserve further allows them to utilise the closed-ended structure to allocate a greater proportion of the fund to smaller, faster growing companies with the assurance that any disappointments in their main distributing companies in the short term need not impede BRIG’s distribution growth.
The focus on growing dividends, with revenue reserves available to help facilitate this, can also be seen in the JPMorgan Claverhouse (LSE:JCH) trust, which offers c.1.49x dividend cover on a yield of c.3.8% at present. Having grown dividends every year for the past 47 years, JCH certainly seems to be well placed to continue doing so.
Similarly, Schroder Income Growth (LSE:SCF) has grown its dividend every year for the past 23 years, and Invesco Income Growth (LSE:IVI) has grown dividends for 21 years uninterrupted. Both are currently able to offer about the same level of dividend yield as the wider market, with a protective buffer held back as revenue reserves.
Whilst the chair of Aberdeen Standard Equity Income Trust (LSE:ASEI) recently acknowledged that the share price returns had been disappointing, they also reiterated their continued faith in the manager. This was in no small part due to the average 6.5% p.a. dividend growth achieved under his tenure (as well as his longer-term track record of NAV returns).
ASEI yields over 5%, and the premium level of income within the portfolio has allowed the board to rebuild revenue reserves in recent years after using this to help cover a shortfall in income resulting from a suspension of dividends by BP (LSE:BP.) in 2010. This has been successfully achieved to the extent that, even in the event that none of their underlying companies paid any dividends in the next financial year, they could maintain their previous year’s level of distribution.
Kepler Partners is a third-party supplier and not part of interactive investor. Neither Kepler Partners or interactive investor will be responsible for any losses that may be incurred as a result of a trading idea.
Full performance can be found on the company or index summary page on the interactive investor website. Simply click on the company's or index name highlighted in the article.
Important Information
Kepler Partners is not authorised to make recommendations to Retail Clients. This report is based on factual information only, and is solely for information purposes only and any views contained in it must not be construed as investment or tax advice or a recommendation to buy, sell or take any action in relation to any investment.
This report has been issued by Kepler Partners LLP solely for information purposes only and the views contained in it must not be construed as investment or tax advice or a recommendation to buy, sell or take any action in relation to any investment. If you are unclear about any of the information on this website or its suitability for you, please contact your financial or tax adviser, or an independent financial or tax adviser before making any investment or financial decisions.
The information provided on this website is not intended for distribution to, or use by, any person or entity in any jurisdiction or country where such distribution or use would be contrary to law or regulation or which would subject Kepler Partners LLP to any registration requirement within such jurisdiction or country. Persons who access this information are required to inform themselves and to comply with any such restrictions. In particular, this website is exclusively for non-US Persons. The information in this website is not for distribution to and does not constitute an offer to sell or the solicitation of any offer to buy any securities in the United States of America to or for the benefit of US Persons.
This is a marketing document, should be considered non-independent research and is subject to the rules in COBS 12.3 relating to such research. It has not been prepared in accordance with legal requirements designed to promote the independence of investment research.
No representation or warranty, express or implied, is given by any person as to the accuracy or completeness of the information and no responsibility or liability is accepted for the accuracy or sufficiency of any of the information, for any errors, omissions or misstatements, negligent or otherwise. Any views and opinions, whilst given in good faith, are subject to change without notice.
This is not an official confirmation of terms and is not to be taken as advice to take any action in relation to any investment mentioned herein. Any prices or quotations contained herein are indicative only.
Kepler Partners LLP (including its partners, employees and representatives) or a connected person may have positions in or options on the securities detailed in this report, and may buy, sell or offer to purchase or sell such securities from time to time, but will at all times be subject to restrictions imposed by the firm's internal rules. A copy of the firm's conflict of interest policy is available on request.
Past performance is not necessarily a guide to the future. The value of investments can fall as well as rise and you may get back less than you invested when you decide to sell your investments. It is strongly recommended that Independent financial advice should be taken before entering into any financial transaction.
PLEASE SEE ALSO OUR TERMS AND CONDITIONS
Kepler Partners LLP is a limited liability partnership registered in England and Wales at 9/10 Savile Row, London W1S 3PF with registered number OC334771.
Kepler Partners LLP is authorised and regulated by the Financial Conduct Authority.
Kepler Partners is a third-party supplier and not part of interactive investor. Neither Kepler Partners or interactive investor will be responsible for any losses that may be incurred as a result of a trading idea.
These articles are provided for information purposes only. Occasionally, an opinion about whether to buy or sell a specific investment may be provided by third parties. The content is not intended to be a personal recommendation to buy or sell any financial instrument or product, or to adopt any investment strategy as it is not provided based on an assessment of your investing knowledge and experience, your financial situation or your investment objectives. The value of your investments, and the income derived from them, may go down as well as up. You may not get back all the money that you invest. The investments referred to in this article may not be suitable for all investors, and if in doubt, an investor should seek advice from a qualified investment adviser.
Full performance can be found on the company or index summary page on the interactive investor website. Simply click on the company's or index name highlighted in the article.
Important Information
Kepler Partners is not authorised to make recommendations to Retail Clients. This report is based on factual information only, and is solely for information purposes only and any views contained in it must not be construed as investment or tax advice or a recommendation to buy, sell or take any action in relation to any investment.
This report has been issued by Kepler Partners LLP solely for information purposes only and the views contained in it must not be construed as investment or tax advice or a recommendation to buy, sell or take any action in relation to any investment. If you are unclear about any of the information on this website or its suitability for you, please contact your financial or tax adviser, or an independent financial or tax adviser before making any investment or financial decisions.
The information provided on this website is not intended for distribution to, or use by, any person or entity in any jurisdiction or country where such distribution or use would be contrary to law or regulation or which would subject Kepler Partners LLP to any registration requirement within such jurisdiction or country. Persons who access this information are required to inform themselves and to comply with any such restrictions. In particular, this website is exclusively for non-US Persons. The information in this website is not for distribution to and does not constitute an offer to sell or the solicitation of any offer to buy any securities in the United States of America to or for the benefit of US Persons.
This is a marketing document, should be considered non-independent research and is subject to the rules in COBS 12.3 relating to such research. It has not been prepared in accordance with legal requirements designed to promote the independence of investment research.
No representation or warranty, express or implied, is given by any person as to the accuracy or completeness of the information and no responsibility or liability is accepted for the accuracy or sufficiency of any of the information, for any errors, omissions or misstatements, negligent or otherwise. Any views and opinions, whilst given in good faith, are subject to change without notice.
This is not an official confirmation of terms and is not to be taken as advice to take any action in relation to any investment mentioned herein. Any prices or quotations contained herein are indicative only.
Kepler Partners LLP (including its partners, employees and representatives) or a connected person may have positions in or options on the securities detailed in this report, and may buy, sell or offer to purchase or sell such securities from time to time, but will at all times be subject to restrictions imposed by the firm's internal rules. A copy of the firm's conflict of interest policy is available on request.
Past performance is not necessarily a guide to the future. The value of investments can fall as well as rise and you may get back less than you invested when you decide to sell your investments. It is strongly recommended that Independent financial advice should be taken before entering into any financial transaction.
PLEASE SEE ALSO OUR TERMS AND CONDITIONS
Kepler Partners LLP is a limited liability partnership registered in England and Wales at 9/10 Savile Row, London W1S 3PF with registered number OC334771.
Kepler Partners LLP is authorised and regulated by the Financial Conduct Authority.
These articles are provided for information purposes only. Occasionally, an opinion about whether to buy or sell a specific investment may be provided by third parties. The content is not intended to be a personal recommendation to buy or sell any financial instrument or product, or to adopt any investment strategy as it is not provided based on an assessment of your investing knowledge and experience, your financial situation or your investment objectives. The value of your investments, and the income derived from them, may go down as well as up. You may not get back all the money that you invest. The investments referred to in this article may not be suitable for all investors, and if in doubt, an investor should seek advice from a qualified investment adviser.
Full performance can be found on the company or index summary page on the interactive investor website. Simply click on the company's or index name highlighted in the article.