Stockwatch: is the best of Vodafone’s share price rally over?
Backing this telecoms giant proved to be a good move for analyst Edmond Jackson. Now he revisits the investment case with shares significantly higher.
15th May 2026 12:01
by Edmond Jackson from interactive investor
The Vodafone logo at the Mobile World Congress. Photo: Ramon Costa/SOPA Images/LightRocket via Getty Images.
Despite its mixed narrative, the FTSE 100 shares in Vodafone Group have enjoyed a strong run after testing 64p both in 2024 and 2025.
By last Monday, the price had risen 88% to just above 120p but then fell 8% in reaction to Tuesday’s annual results ended 31 March to 112p. They’re 115p as I write.
- Invest with ii: Top UK Shares | Share Tips & Ideas | Cashback Offers
Was this casual selling after results at all suggesting that the valuation now fairly reflects Vodafone’s numbers and prospects?
The five-year chart can look like a classic bullish “bowl” pattern but can also be seen as mean-reversion if the upside has run its course:
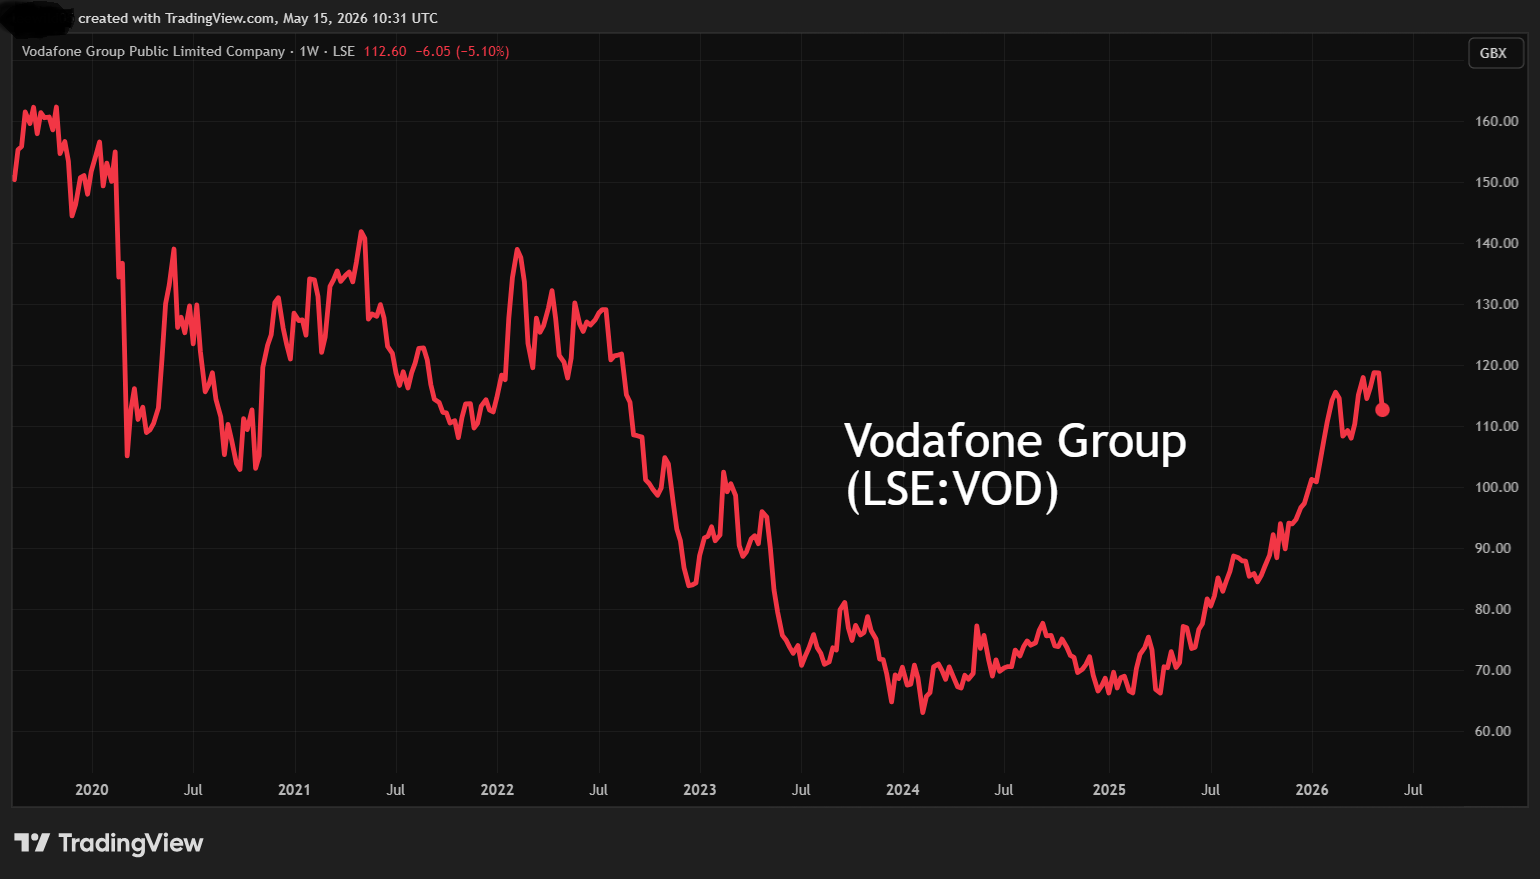
Source: TradingView. Past performance is not a guide to future performance.
I would tend therefore to take my cue from fundamentals. While annual revenue growth is 8% to €40.5 billion (£35.1 billion), this has benefited from integrating Three in the UK. Organic growth in services is 5.4% overall, but is quite polar between Germany (nearly a third of overall group revenue) which slipped 0.2%, and Africa the standout with 12.9% growth, with particular strength in Egypt.
Group operating profit has turned around from a €0.4 billion loss in March 2025 to a €2.8 billion profit. The long-term context (see table below) shows much more is achievable, and we are told that Vodafone is now a leaner group with stronger positions in its key markets, which bodes well.
However, despite a tax charge 20% lower at €1.8 billion, this still effectively wipes out pre-tax profit, leaving only €59 million net, which becomes a €49 million loss even after respecting €348 million of non-controlling interests. At the reported level, this contrasts with (what I saw pre-results) as consensus for €2.1 billion net profit.
Perhaps cash flow is a better yardstick for valuation here rather than tricky-to-decipher earnings. But Vodafone still succeeds to complicate, presenting its version of “adjusted” free cash flow, which is before spending on licences and spectrum (radio frequencies), plus restructuring and integration costs, hence at €2.6 billion is 46% greater than the statutory measure. Some might say licences/spectrum spending is integral to normal operations. Yet the implied free cash flow yields of 8.2% adjusted and 5.6% reported look respectable.
Return on capital employed at 2.7% nearly recovers the March 2024 rate, but Vodafone’s long-term record has yet to establish a 5-6% rate that we see at BT Group.
Vodafone Group - financial summary
Year end 31 Mar
| 2016 | 2017 | 2018 | 2019 | 2020 | 2021 | 2022 | 2023 | 2024 | 2025 | 2026 | |
| Revenue (€ million) | 49,810 | 47,631 | 46,571 | 43,666 | 44,974 | 43,809 | 37,010 | 37,672 | 36,717 | 37,448 | 40,461 |
| Operating margin (%) | 2.7 | 7.8 | 9.2 | -2.2 | 9.1 | 11.7 | 15.5 | 38.4 | 10.0 | -0.4 | 7.0 |
| Operating profit (€m) | 1,320 | 3,725 | 4,299 | -951 | 4,099 | 5,129 | 5,740 | 14,451 | 3,665 | -158 | 2,844 |
| Net profit (€m) | -5,405 | -6,297 | 2,439 | -8,020 | -920 | 59.0 | 2,237 | 11,838 | 1,140 | -4,169 | -397 |
| Reported EPS (euro cents) | -20.3 | -7.8 | 15.8 | -16.2 | -3.1 | 0.2 | 7.1 | 43.5 | 4.4 | -15.9 | -1.2 |
| Normalised EPS (cents) | -18.0 | -9.8 | 16.3 | -6.7 | -7.9 | 2.6 | 7.8 | 13.3 | 6.8 | -3.1 | -0.8 |
| Ops cashflow/share (cents) | 53.7 | 50.8 | 48.8 | 47.0 | 59.1 | 58.0 | 62.1 | 65.0 | 61.0 | 58.8 | 59.5 |
| Capex/share (cents) | 52.0 | 31.7 | 29.3 | 29.5 | 25.8 | 29.1 | 31.1 | 33.2 | 25.3 | 25.6 | 30.4 |
| Free cashflow/share (cents) | 1.7 | 19.2 | 19.5 | 17.5 | 33.2 | 28.9 | 31.0 | 31.8 | 35.7 | 33.2 | 29.1 |
| Dividend/share (cents) | 14.4 | 14.8 | 15.1 | 9.2 | 8.9 | 9.2 | 9.0 | 9.0 | 9.0 | 4.6 | 2.2 |
| Earnings cover (x) | -1.4 | -0.5 | 1.1 | -1.8 | -0.4 | 0.0 | 0.8 | 4.8 | 0.5 | -3.5 | -0.5 |
| Return on capital (%) | 1.0 | 3.3 | 4.0 | -0.8 | 3.0 | 4.1 | 4.8 | 11.9 | 3.0 | -0.1 | 2.7 |
| Cash (€m) | 18,259 | 14,955 | 13,469 | 26,649 | 20,646 | 14,980 | 15,427 | 18,722 | 11,275 | 18,425 | 15,752 |
| Net debt (€m) | 38,793 | 31,314 | 29,512 | 26,306 | 54,279 | 52,780 | 54,665 | 47,668 | 45,712 | 34,718 | 36,884 |
| Net asset value (€m) | 83,325 | 72,200 | 67,640 | 62,218 | 61,410 | 55,804 | 54,783 | 63,399 | 59,966 | 52,745 | 50,633 |
| Net asset value/share (cents) | 314 | 271 | 254 | 228 | 229 | 198 | 193 | 235 | 221 | 211 | 219 |
Source: historic company REFS and company accounts.
Upside potential amid recession risk
Vodafone’s pitch is its CEO of three years having honed the group into a stronger operator in its chosen markets, described as “a simpler company with a stronger growth outlook after the transformation of the last three years...our external environment is creating new opportunities, with new demand for high-quality connectivity and a more supportive regulatory context”.
Mind you, taking full control of Three (from 49%) for near €5 billion in the second half year is likely to mean further restructuring costs and debt. It will, however, make the group the largest UK mobile provider.
The medium-term ambition is to deliver double-digit adjusted free cash flow growth, as if trying to steer perception on to this benchmark. The operations narrative implies growth will still depend significantly on Africa “for its population growth and rising data usage with much scope to advance infrastructure”. That will require investment.
Germany is a turnaround and UK growth is being achieved by acquisition rather than organically. Business services are proclaimed for “helping businesses digitalise and unlock the power of the latest technologies”, although it remains to be seen how stagflation tempers such demand despite upgrading opportunities.
Vodafone – probably BT also – is thus not immune to the sense of risk “on/off” over any Middle East resolution, as we approach a crunch point for global prices and commodity supply come June.
For a balanced view, telecoms do tend to be regarded as relatively defensive investments with consumers locked into inflation-pacing contracts. Perhaps the consumer side of these big groups will help mitigate variability – if it happens – from businesses.
I would just take the professed growth outlook with a pinch of salt.
Buybacks paused but dividends look secure
Prioritising cash for taking control of Three was reportedly one reason for the share price drop. Perhaps this shows the extent that share buybacks are ingrained in investor expectations (dominating company RNS feeds nowadays), where properly business investment justifies a mark-up over buybacks given that it should create value by way of returns over many years.
In a cash flow context, the financing side of the statement shows buybacks took €2.0 billion last year versus €1.1 billion for ordinary dividends, €2.3 billion on debt interest and €11.9 billion repayment of borrowings. Vodafone also managed to spend €9.1 billion gross on investments, despite a 7% slip in cash inflow from operations to €14.3 billion. A net positive then, despite debt service having been regarded as a key risk for Vodafone. But it did result in an overall €1.7 billion net cash outflow versus €4.9 billion inflow in the March 2025 year.
- ii view: Aviva rewarded for robust start to 2026
- Sector Screener: two FTSE 350 stocks for long-term growth
At €36.9 billion, net debt is down on €54.7 billion in March 2022 but up 6% on last year, implying net gearing just shy of 73%, although BT’s last measure was around 174% based on £21.9 billion net debt.
Vodafone used to be seen as a high-yield share – albeit with the payout at risk. Indeed, the dividend nearly halved from around 9 euro cents per share (paid out consistently to March 2024). With consensus for 4.9 cents (4.25p) for March 2027, the prospective yield is 3.75%, hence total return should be more in focus nowadays. BT quite similarly offers 3.5% just over twice covered by earnings.
Significant sentiment swings in telecom shares
In March 2024 when I drew attention to Vodafone as a “buy” at around 63p, its price had continued to fall even after the finance chief bought over £1.7 million worth at 69.6p. I said: “It raises stark questions about the pricing of FTSE 100 shares, you would assume it is reasonably efficient, yet the market is trending opposite to what a CFO implies, scream[ing] value.”
At this time, BT traded at 105p (currently 240p). I had rated it a “buy” at 102p in October 2020, partly due to a near 8% prospective yield and the defensive appeal of telecoms during the Covid disruption.
- Seven inheritance tax planning mistakes to avoid
- Sign up to our free newsletter for investment ideas, latest news and award-winning analysis
It has taken significant time for sentiment to improve, and in July 2024 I re-iterated “buy” on BT at 140p and Vodafone at 72p. Both CEOs spoke in terms of “much remains to be done”, which you could interpret positively by way of scope to improve but also requiring time.
Last February at 110p I wrote after a third-quarter update to end-December: “I think the market will want to see better traction in Germany to move on from the current ‘good in parts’ updates; hence would be cautious to assert ‘buy’ now the PE and yield are broadly appropriate – at least in the short to medium term”. I concluded “hold”, given a 10% discount to net tangible assets at 110p.
Germany still does need to improve if Vodafone is genuinely to be seen as a growth business.
Director buys at 114p post-results
A non-executive director since 2022 – formerly a CEO of ARM Holdings ADR – who chairs Vodafone’s technology committee, has bought 50,000 shares since the results at 114.4p. This lends comfort to holders but does look a maiden purchase where non-executive directors are expected to own shares, and he cannot be short of a bob or two.
Therefore, with Vodafone I find myself “between stools”, it not exactly satisfying either growth or defensive criteria enough to justify a conviction “buy”, especially when we do not know how long this Middle East conflict will drag on.
Long-term risk/reward does, however, tilt positively as a result of the streamlining, African exposure and long-term prospects for business services, hence a firm “hold”.
Should the Strait of Hormuz re-open, Vodafone is likely to be among the FTSE 100 shares rallying.
Edmond Jackson is a freelance contributor and not a direct employee of interactive investor.
These articles are provided for information purposes only. Occasionally, an opinion about whether to buy or sell a specific investment may be provided by third parties. The content is not intended to be a personal recommendation to buy or sell any financial instrument or product, or to adopt any investment strategy as it is not provided based on an assessment of your investing knowledge and experience, your financial situation or your investment objectives. The value of your investments, and the income derived from them, may go down as well as up. You may not get back all the money that you invest. The investments referred to in this article may not be suitable for all investors, and if in doubt, an investor should seek advice from a qualified investment adviser.
Full performance can be found on the company or index summary page on the interactive investor website. Simply click on the company's or index name highlighted in the article.
Disclosure
We use a combination of fundamental and technical analysis in forming our view as to the valuation and prospects of an investment. Where relevant we have set out those particular matters we think are important in the above article, but further detail can be found here.
Please note that our article on this investment should not be considered to be a regular publication.
Details of all recommendations issued by ii during the previous 12-month period can be found here.
ii adheres to a strict code of conduct. Contributors may hold shares or have other interests in companies included in these portfolios, which could create a conflict of interests. Contributors intending to write about any financial instruments in which they have an interest are required to disclose such interest to ii and in the article itself. ii will at all times consider whether such interest impairs the objectivity of the recommendation.
In addition, individuals involved in the production of investment articles are subject to a personal account dealing restriction, which prevents them from placing a transaction in the specified instrument(s) for a period before and for five working days after such publication. This is to avoid personal interests conflicting with the interests of the recipients of those investment articles.