Stockwatch: can this impressive riser clock another re-rate?
After a difficult seven years, this company has come to life and is generating significant returns for investors. Analyst Edmond Jackson updates his view on the shares.
26th September 2025 11:58
by Edmond Jackson from interactive investor

Notably, shares in over-50’s travel and insurance group Saga (LSE:SAGA) have risen 75% from around 140p in April to 245p. That compares to 17% for the FTSE SmallCap Index. They’re up 145% from around 100p in September 2024. So, is this chiefly based on fundamentals, a wider “risk-on” mentality driving other shares lately, or perhaps a conflation of the two? At least one other broker has just upgraded Saga, targeting over 400p.
- Invest with ii: Top UK Shares | Share Tips & Ideas | Cashback Offers
The sense among equity buyers is that Saga’s earnings recovery potential can outpace its debt pile – refinanced more expensively at around 11% interest last January – whereas a credit perspective (such as a ratings agency) sees this as riskier. Saga cruises are indeed a big success, with affluent older people appreciating the “boutique” liners, and the insurance side has stabilised but at the possible expense of earnings in a new partnership with Aegis; time will tell.
Market optimism also appears to be brushing aside the prospect of a Labour government raid on wealthy older folk in late November’s Autumn Budget, although stiffer inheritance tax could encourage them to spend more while alive. In a worst-case scenario of a UK fiscal crisis leading to still-higher gilt yields, this could also raise the cost of corporate debt affecting exposed shares.
Contrasting essentials certainly make Saga intriguing to delve into:
Chart bowl pattern led to breakout and big upgrade
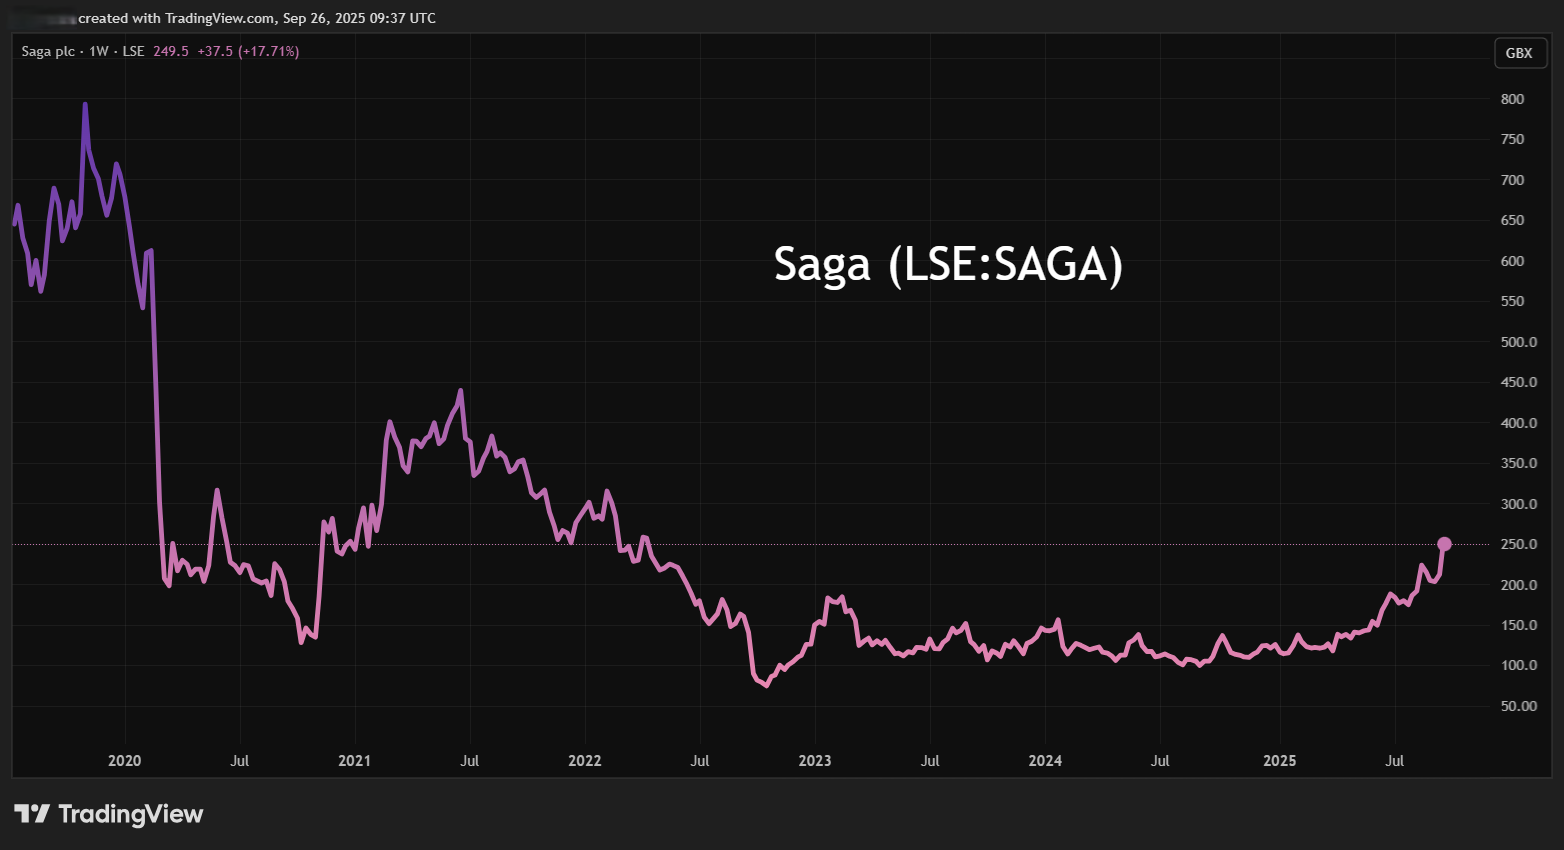
Source: TradingView. Past performance is not a guide to future performance.
From 2023, the shares traded volatile-sideways with a slight “bowl” given the rise from last April, which became keener from July after the 24 June AGM issued an “in-line” update.
After Wednesday’s interim results, broker Singer has affirmed this classically bullish chart, hiking its earnings per share (EPS) forecast from 18.4p to 30.4p in respect of the current year to end-January 2026, and in future years such as 39.8p for January 2028. It accords with the results statement extending a carrot of £100 million underlying pre-tax profit by January 2030. Singer does not appear to have any commercial relationship with Saga, hence no promotional agenda behind also raising its share price target from 285p to 410p. Deutsche Bank has also raised its target from 185p to 285p.
- ii view: Saga shares popular after sailing back into profit
- How pensions windfall could turbocharge UK stock market
I last maintained a “hold” stance at 131p in December, somewhat influenced by Moody’s credit rating agency downgrading from stable to negative, “reflecting Saga’s constrained liquidity and material refinancing risk over the next 12 to 18 months”.
I respect a scenario where the travel side, at least, builds on strength as affluent pensioners remain a stronghold for spending, although market sentiment seems to have shifted optimistically on net profit growth at a very early stage.
Admin and debt service costs weigh on income statement
Continuing operations revenue has grown usefully by 9.2% to £328.2 million, with cost of sales as a percentage of revenue down from 51.2% to 49.9%. Administrative and selling costs have, however, risen from 34.7% to 39.1%, incurring a £21.0 million higher charge, which helps explain the modest £3.7 million pre-tax outcome. Significantly variable, exceptional costs can get shunted into admin expenses, but the higher charge is a reminder that Saga needs to navigate costs carefully if the bullish profits scenario is to come about.
While the financial highlights cite pre-tax profit “growing” by £120.6 million, this is chiefly because a £138.3 million assets impairment charge last time was only £0.3 million this time. Management seems to take a selective view as to which costs should be regarded as normal when deciphering earning power.
Despite a 17% reduction in net debt to £515.1 million (helped by cash up 94.0% to £212.0 million), there has been a 56.5% hike in finance costs to £37.1 million, modestly offset by £2.7 million finance income. This arises from last January’s refinancing, terms of which were likely influenced by the Moody’s credit rating. I struggle to recognise “strength of balance sheet” as management contends, also because £240.3 million goodwill/intangibles constituted 409% of £58.8 million net assets.
Interim balance sheet and cash flow statement beg questions
There is no distinction as to current assets versus current liabilities – especially financial liabilities. Instead, total assets are lumped together versus total liabilities. In more than 40 years of studying accounts, this is a novelty to me.
- Sign up to our free newsletter for investment ideas, latest news and award-winning analysis
- Copper price rally boosts these UK mining shares
Highlights also cite a 64% hike in available operating cash flow, not exactly supported by the interim cash flow statement itself. It adds back a big lump of amortisation, although the improvement shown in net cash from operations is at best 42% to £79.8 million, with proper consideration of the hike in interest paid leaving net cash from operations marginally lower at £42.4 million.
An £8.7 million net increase in cash can be seen as resulting from a £57.9 million subsidiary disposal as well as a £25.8 million financial assets disposal. To me, Saga’s operational cash flow profile has yet to show that it can materially cut debt going forwards, instead of non-recurring disposals this time. Restoring dividends prudently looks a long way off.
Can improvements on travel side substantially boost profits?
While I think it important to make these conservative points on Saga’s accounts, we should recognise also that, pre-Covid, Saga enjoyed group operating margins over 20% in its January 2017 and 2018 years (see table).
Saga - financial summary
year end 31 Jan
| 2015 | 2016 | 2017 | 2018 | 2019 | 2020 | 2021 | 2022 | 2023 | 2024 | 2025 | |
| Revenue (£ million) | 901 | 963 | 871 | 860 | 842 | 797 | 338 | 377 | 664 | 565 | 588 |
| Operating margin (%) | 12.6 | 18.3 | 22.2 | 21.0 | -16.0 | -37.7 | -18.1 | -6.2 | -41.1 | -21.9 | -27.2 |
| Operating profit (£m) | 114 | 176 | 194 | 181 | -135 | -301 | -61.2 | -23.5 | -273 | -124 | -160 |
| Net profit (£m) | -134 | 141 | 157 | 139 | -162 | -313 | -67.8 | -28.0 | -273 | -113 | -165 |
| Reported EPS (p) | 117 | 180 | 191 | 179 | -198 | -382 | -67.0 | -20.1 | -196 | -77.3 | -127 |
| Normalised EPS (p) | 129 | 183 | 193 | 185 | 51.5 | -57.5 | -31.0 | -17.5 | -67.7 | 9.2 | -16.7 |
| Operating cashflow/share (p) | 212 | 183 | 169 | 164 | 181 | 112 | -77.5 | 33.3 | -10.0 | 59.9 | 80.6 |
| Capital expenditure/share (p) | 36.0 | 41.2 | 53.4 | 100 | 76.9 | 360 | 282 | 13.5 | 14.9 | 19.1 | 14.3 |
| Free cashflow/share (p) | 176 | 142 | 115 | 64.1 | 104 | -248 | -359 | 19.8 | 24.9 | 40.8 | 66.3 |
| Dividend/share (p) | 56.0 | 98.4 | 116 | 123 | 54.6 | 17.8 | 0.0 | 0.0 | 0.0 | 0.0 | 0.0 |
| Earnings cover (x) | 2.1 | 1.8 | 1.7 | 1.5 | -3.6 | -21.5 | 0.0 | 0.0 | 0.0 | 0.0 | 0.0 |
| Cash (£m) | 199 | 107 | 109 | 83.2 | 123 | 97.9 | 102 | 227 | 177 | 222 | 192 |
| Net debt (£m) | 499 | 461 | 379 | 373 | 347 | 565 | 721 | 705 | 715 | 603 | 498 |
| Net asset value (£m) | 984 | 1,088 | 1,195 | 1,226 | 961 | 588 | 681 | 653 | 365 | 224 | 57.7 |
| Net asset value/share (p) | 1,210 | 1,330 | 1,460 | 1,495 | 1,170 | 716 | 486 | 465 | 260 | 158 | 40.2 |
Source: historic company REFS and company accounts.
In Saga’s first half-year, travel is proclaimed, with underlying pre-tax profit up 33% to £41.6 million on revenue up 9% to £246.7 million (75% of total). Combining the cruise and holidays businesses has resulted in improved efficiency and more consistent delivery. Ocean cruise profit is up 23% and river cruise profit by 34%. Repeat and new bookings are also cited up for both aspects. As things stand, the operations trajectory is encouraging.
On insurance, and despite it looking as if Saga’s quality customer service has helped it claw back business from cheaper online rivals, I’m still inclined to see how this 20-year deal with Ageas works out for profitability. Disposing of the more profitable underwriting side looked a necessity to cut debt.
The story then is very much around the travel side being a marketing success to a well-off segment of the British population; the bull case resting on it offering resilient growth.
- Babcock update justifies unprecedented share price rally
- Trading Strategies: can this blue-chip keep outperforming FTSE 100?
Recent consensus has been for net profit of around £33 million in the current year to end-January and £41 million to 2027, generating normalised earnings per share near 22p and 29p, implying a forward price/earnings (PE) ratio reducing near 8x. This assumes net profit ramps up and/or takes a specific normalised view.
While the extent of goodwill/intangibles appears to suggest a hefty annual amortisation charge to adjust for, the interim cash flow statement shows £143 million having reduced to £3.5 million. I think my view of Saga’s income statement – awaiting genuine sustainable profits – is pretty reasonable.
Historic performance suggests that, yes, £100 million underlying pre-tax profit by January 2030 does not look like a stretched target. Debt is higher and insurance underwriting gone but the boutique cruise liners could compensate. The outlook is sketchy though – scope for bulls and sceptics alike – and management touts this four-year forward number without being specific as to this year’s profit, which needs to ramp up in the second half.
Valuation currently weighing on earnings perception, rather than yield or asset-backing, seems to guarantee ongoing volatility. Well done to holders who got lucky with the recent rally, which does appear to exemplify overall bullish sentiment besides progress in travel. On a fresh money view, I’m inclined to wait and see what November’s Budget and its aftermath heralds. Hold.
Edmond Jackson is a freelance contributor and not a direct employee of interactive investor.
These articles are provided for information purposes only. Occasionally, an opinion about whether to buy or sell a specific investment may be provided by third parties. The content is not intended to be a personal recommendation to buy or sell any financial instrument or product, or to adopt any investment strategy as it is not provided based on an assessment of your investing knowledge and experience, your financial situation or your investment objectives. The value of your investments, and the income derived from them, may go down as well as up. You may not get back all the money that you invest. The investments referred to in this article may not be suitable for all investors, and if in doubt, an investor should seek advice from a qualified investment adviser.
Full performance can be found on the company or index summary page on the interactive investor website. Simply click on the company's or index name highlighted in the article.
Disclosure
We use a combination of fundamental and technical analysis in forming our view as to the valuation and prospects of an investment. Where relevant we have set out those particular matters we think are important in the above article, but further detail can be found here.
Please note that our article on this investment should not be considered to be a regular publication.
Details of all recommendations issued by ii during the previous 12-month period can be found here.
ii adheres to a strict code of conduct. Contributors may hold shares or have other interests in companies included in these portfolios, which could create a conflict of interests. Contributors intending to write about any financial instruments in which they have an interest are required to disclose such interest to ii and in the article itself. ii will at all times consider whether such interest impairs the objectivity of the recommendation.
In addition, individuals involved in the production of investment articles are subject to a personal account dealing restriction, which prevents them from placing a transaction in the specified instrument(s) for a period before and for five working days after such publication. This is to avoid personal interests conflicting with the interests of the recipients of those investment articles.