Stockwatch: can progress mitigate macro risks at mid-cap?
Amid the backdrop of the Iran war, analyst Edmond Jackson updates his view on this FTSE 250 stock, asking whether the timing's right to buy it after a significant acquisition and positive updates.
24th April 2026 12:13
by Edmond Jackson from interactive investor

The FTSE 350 shares in Jupiter Fund Management (LSE:JUP) are at an interesting stage. The long-term chart shows signs of a bullish “bowl” pattern emerging, which would correspond with fundamentals on how net fund flows have turned positive and a new CEO since 2022 is getting to grips with cost control and rationalising the business.
- Invest with ii: SIPP Account | Stocks & Shares ISA | See all Investment Accounts
Yet the Iran war and its macro effects have hit sentiment by way of a de-rate from an 180p range attained early this year, to a 150p range, currently 155p. The shares still found support after last Tuesday’s first-quarter 2026 update affirmed net inflows. A £30 million share buyback programme has commenced, underlying a sound cash position and likely to see a 3% reduction in issued share capital by early October.
Based on consensus, the 12-month forward price/earnings (PE) is around 12x, if potentially at risk from the macro situation; yet there is a meaningful 4.5% prospective yield besides the buybacks, potentially supporting. Jupiter is a good example of how asset managers have “potential” for operational gearing to kick in as industry trends towards net outflows turn better; but what of the next six months if the Strait of Hormuz remains compromised?
Jupiter has tentative signs of value and, with operating margins possibly recovered around or over 30%, like in 2021, there is scope for a bowl chart to further evolve:
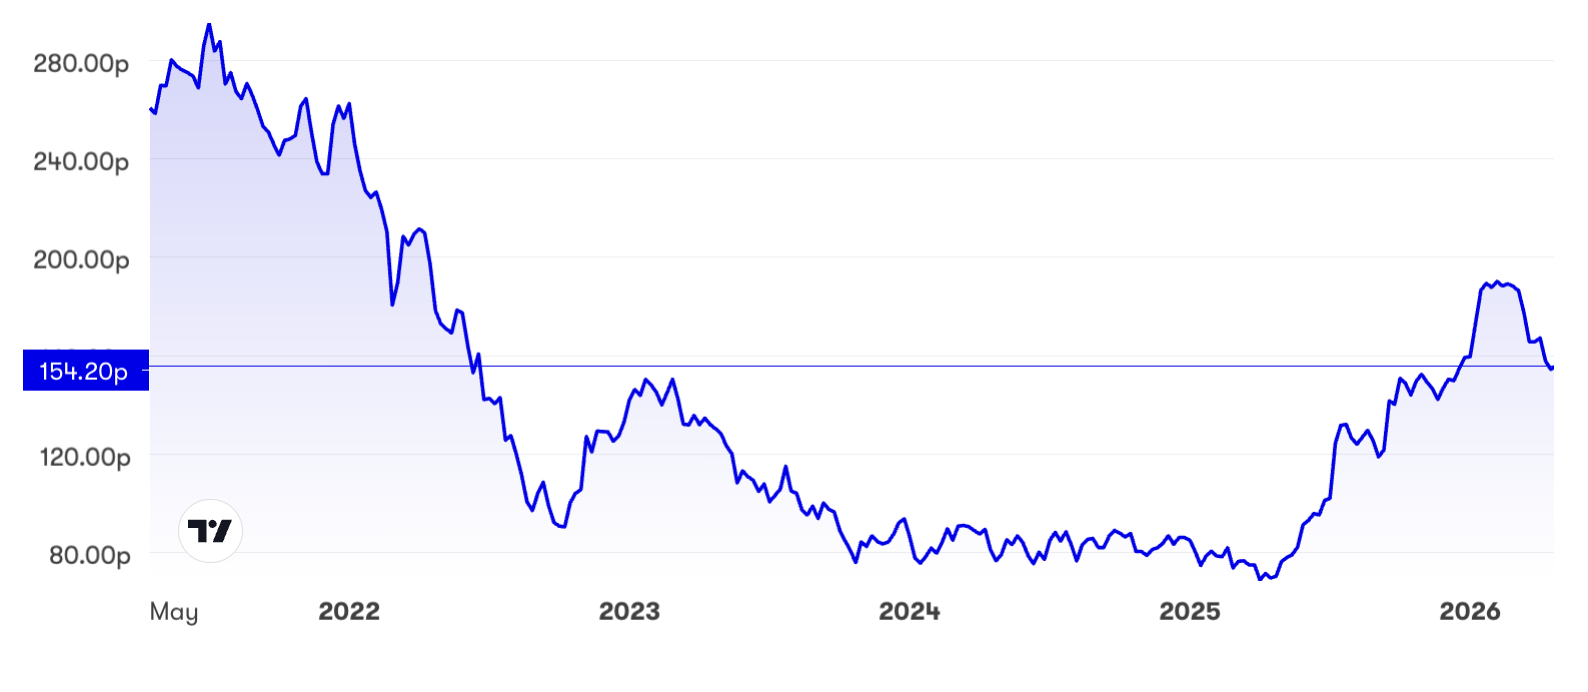
Source: interactive investor. Past performance is not a guide to future performance.
A ‘buy’ case interrupted or affirmed?
Last July I made this [point] at 120p after news of the acquisition of CCLA – the UK’s largest asset manager serving charities, local authorities and other non-profit organisations – with over £15 billion managed.
Terms looked highly attractive. Jupiter was getting control of£15 billionworth of assets under management (AuM), consequently a 35% boost to its £44.3 billion. Jupiter had also started to see positive net inflows from the second quarter of 2025, breaking a chronic trend of outflows in the industry.
After £0.5 billion of outflows in the first quarter of 2025, the final quarter saw a £1.2 billion boost, making for an overall annual net inflow of £1.3 billion. Hence, the steady uptrend to a 180p range.
The first quarter of 2026 saw £1.5 billion positive net inflows, with retail and institutional clients generating £1.7 billion net; partly offset by small net outflows in CCLA-managed strategies. [Perhaps] that helps explain the attractive purchase price, which maybe hints at work to do there. Integration of CCLA did, however, mean a 27% hike in assets under management to £68.4 billion.
Regarding the general shift in sentiment, management says: “It is too early to tell if this represents a sustained change in client appetite towards risk assets, or it be short term and transitory.”
- Where to invest in Q2 2026? Four experts have their say
- Three ways to build an ISA portfolio from scratch
What is curious is the FTSE 100 and S&P 500 meanwhile recovering to hit record highs and, despite rising gloom for UK prospects, the relatively domestic FTSE 250 index has recovered to 3% below its 27 February high.
By comparison, among larger asset managers: M&G Ordinary Shares (LSE:MNG) has recovered 9% this month, although at 298p is 8% below its late February high; and Legal & General Group (LSE:LGEN) rebounded 15% from a 236p low on 20 March, slumping 7% as the shares go ex-dividend.
Investors just do not know what to make of the current situation, where asset managers are quite a geared play on markets’ medium-term direction. Similar to oil & gas shares, they generally do not swing as much as the underlying commodity (or asset), hence investors await a measured sense of where this war is leading.
US President Donald Trump’s turnaround last Tuesday – from more bombing threats to a unilateral extension of the ceasefire with Iran, this time without a hard deadline – illustrates my point in my last piece about how, despite fiery rhetoric, both sides more likely do want an end to this conflict.
But what incentive is there for Iran to compromise on key terms? There probably is more pressure on Trump in the near term to recover popularity ahead of the US mid-term elections, versus Iran’s capability to play a longer game now that it has discovered its leverage over advanced economies.
The Strait of Hormuz remains closed and the US blockade of Iranian ports continues, hence there is much to happen before investor sentiment can tilt more positively. Can the nascent trend of fund inflows withstand this?
In a worse-case scenario of energy prices grinding stubbornly higher to trigger global recession, I do not think it alarmist to be aware of material downside risk in asset management shares.
Can a respectable yield limit the downside from market volatility?
Long-term shareholders in Legal & General and M&G – frequently priced to yield 7% to 9%, yet not immune to drops – may wonder.
At least Jupiter’s £401 million year-end cash would appear to cope with a period of dividends uncovered by earnings; say to make a £44 million annual payout equivalent to the 8.3p per share dividend that is the consensus for 2027. Unless, say, that was to get close to encroaching on a cash buffer required to meet regulatory needs, it is tricky to determine from a balance sheet entry.
Jupiter’s dividend reliability looks inherently more variable in future
While the long-term financial record shows a consistent 17.1p dividend per share for five years, this broke down with cuts in 2022 to 2025 and the company transitioned to a new capital allocation policy aiming for 50% payout of pre-performance fee earnings being “no longer subject to a minimum of the prior year amount”.
Jupiter Fund Management - financial summary
Year-end 31 Dec
| 2016 | 2017 | 2018 | 2019 | 2020 | 2021 | 2022 | 2023 | 2024 | 2025 | |
| Turnover (£ million) | 402 | 460 | 461 | 419 | 501 | 618 | 444 | 406 | 403 | 466 |
| Operating margin (%) | 42.6 | 41.9 | 38.9 | 36.5 | 27.5 | 30.8 | 14.5 | 2.4 | 21.5 | 27.5 |
| Operating profit (£m) | 171 | 193 | 179 | 153 | 138 | 191 | 64.3 | 9.8 | 86.4 | 128 |
| Net profit (£m) | 136 | 155 | 143 | 123 | 105 | 150 | 47.9 | -12.9 | 65.2 | 100 |
| Reported EPS (p) | 29.6 | 33.7 | 31.1 | 26.8 | 20.8 | 26.9 | 8.9 | -2.5 | 12.2 | 17.9 |
| Normalised EPS (p) | 29.7 | 33.8 | 31.5 | 28.9 | 23.5 | 29.0 | 9.5 | 7.4 | 12.7 | 18.4 |
| Earnings per share growth (%) | 3.9 | 14.1 | -6.9 | -8.3 | -18.7 | 23.5 | -67.2 | -22.1 | 71.3 | 44.3 |
| Return on capital (%) | 27.7 | 29.7 | 28.0 | 22.2 | 13.3 | 17.9 | 6.5 | 1.1 | 9.1 | 13.2 |
| Operating cashflow/share (p) | 32.0 | 42.3 | 37.1 | 32.7 | 20.7 | 34.0 | 30.1 | 16.9 | 13.8 | 10.6 |
| Capex/share (p) | 0.8 | 1.1 | 0.7 | 0.8 | 0.5 | 0.6 | 1.0 | 0.7 | 1.4 | 0.5 |
| Free cashflow/share (p) | 31.2 | 41.2 | 36.4 | 31.9 | 20.2 | 33.4 | 29.1 | 16.2 | 12.4 | 10.1 |
| Dividend per share (p) | 14.7 | 17.1 | 17.1 | 17.1 | 17.1 | 17.1 | 8.4 | 6.9 | 5.4 | 4.4 |
| Covered by earnings (x) | 2.0 | 2.0 | 1.8 | 1.6 | 1.2 | 1.6 | 1.1 | -0.4 | 2.3 | 4.1 |
| Cash (£m) | 331 | 368 | 390 | 391 | 441 | 497 | 445 | 499 | 549 | 401 |
| Net debt (£m) | -317 | -332 | -316 | -333 | -337 | -397 | -349 | -405 | -458 | -362 |
| Net assets (£m) | 610 | 640 | 624 | 612 | 886 | 901 | 843 | 790 | 834 | 906 |
| Net assets/share (p) | 133 | 140 | 136 | 134 | 160 | 163 | 154 | 145 | 153 | 171 |
Source: historic company REFS and company accounts.
Possibly one reason why Jupiter shares remain 70% below their early 2018 peak is this aspect of dividend variability; hence the market is pricing for a higher yield per se, as compensation. It is a small factor relative to funds’ outflows and falling stock markets, if not insignificant perhaps.
Can company improvements at least mitigate macro risks?
It is a classic “micro” company level economic tussle with the macro environment. The CEO of near four years has had time to refresh the strategy and take action, and it is now bearing fruit.
Four of Jupiter’s core investment capabilities generated positive net inflows in the first quarter. There was ongoing demand for “systematic” equities, where specialist fund managers are encouraged to formulate their own opinions than follow a house view.
Global equities benefited from gold and silver, and flows into UK “dynamic strategies” imply that passive fund management has not killed off active. European equities returned to positive net flow for the first time since 2018, helped by strong performance from a new team.
It sounds justified that Jupiter is “in a stronger position than we have been for a number of years...”
- Pensions and IHT: the countdown to new tax rules has started
- Sign up to our free newsletter for investment ideas, latest news and award-winning analysis
On a multi-year view, I therefore retain a “buy” stance with the obvious caveat being how asset managers are significantly hostage to market volatility.
You have to decide your risk tolerance and take a view. If negative on the consequences of this Iran war, then avoid, but if mediators can get the US and Iran to compromise and restore shipping flow, then Jupiter and others can continue to strengthen in a “risk-on” environment.
This fund manager in particular has always had an equities orientation, constituting nearly half of assets under management recently.
Edmond Jackson is a freelance contributor and not a direct employee of interactive investor.
These articles are provided for information purposes only. Occasionally, an opinion about whether to buy or sell a specific investment may be provided by third parties. The content is not intended to be a personal recommendation to buy or sell any financial instrument or product, or to adopt any investment strategy as it is not provided based on an assessment of your investing knowledge and experience, your financial situation or your investment objectives. The value of your investments, and the income derived from them, may go down as well as up. You may not get back all the money that you invest. The investments referred to in this article may not be suitable for all investors, and if in doubt, an investor should seek advice from a qualified investment adviser.
Full performance can be found on the company or index summary page on the interactive investor website. Simply click on the company's or index name highlighted in the article.
Disclosure
We use a combination of fundamental and technical analysis in forming our view as to the valuation and prospects of an investment. Where relevant we have set out those particular matters we think are important in the above article, but further detail can be found here.
Please note that our article on this investment should not be considered to be a regular publication.
Details of all recommendations issued by ii during the previous 12-month period can be found here.
ii adheres to a strict code of conduct. Contributors may hold shares or have other interests in companies included in these portfolios, which could create a conflict of interests. Contributors intending to write about any financial instruments in which they have an interest are required to disclose such interest to ii and in the article itself. ii will at all times consider whether such interest impairs the objectivity of the recommendation.
In addition, individuals involved in the production of investment articles are subject to a personal account dealing restriction, which prevents them from placing a transaction in the specified instrument(s) for a period before and for five working days after such publication. This is to avoid personal interests conflicting with the interests of the recipients of those investment articles.