Stockwatch: do rival shares offer a genuine hedge against uncertainty?
Analyst Edmond Jackson examines two firms in the same sector that have recently reported strong results.
19th September 2025 11:10
by Edmond Jackson from interactive investor

It has been an interesting week for infrastructure-construction shares, with Kier Group (LSE:KIE) and Galliford Try Holdings (LSE:GFRD) declaring annual results to 30 June.
This sector has variously been regarded as offering defensive growth given that Conservative and Labour governments alike have touted infrastructure spending to boost the economy and appease voters with action on “crumbling Britain”. That is supposedly also a key objective for Reform, so whoever is in power, the context looks supportive.
- Invest with ii: SIPP Account | Stocks & Shares ISA | See all Investment Accounts
Despite a gloomy prognosis for the UK economy from Lord Wolfson, CEO of Next (LSE:NXT), which has also just declared results, he sees government proposals to improve the construction planning process as a rare positive.
Coincidentally, a survey of 165 fund managers by Bank of America has revealed that they are 20% underweight UK equities versus only 2% in, apparently over fears around November’s Budget. This is said to represent the biggest shift out of UK shares since 2004, although the domestic-oriented FTSE 250 index is not even down 2% over the past four weeks, so I wonder.
As yet, charts for both infrastructure shares are recent years’ success stories. Kier being a classic example of a supposedly bullish “bowl” pattern from mid-2021 to mid-2024, followed by a 45% re-rate to 216p since this spring (even when adjusting for US tariffs causing an early April drop):
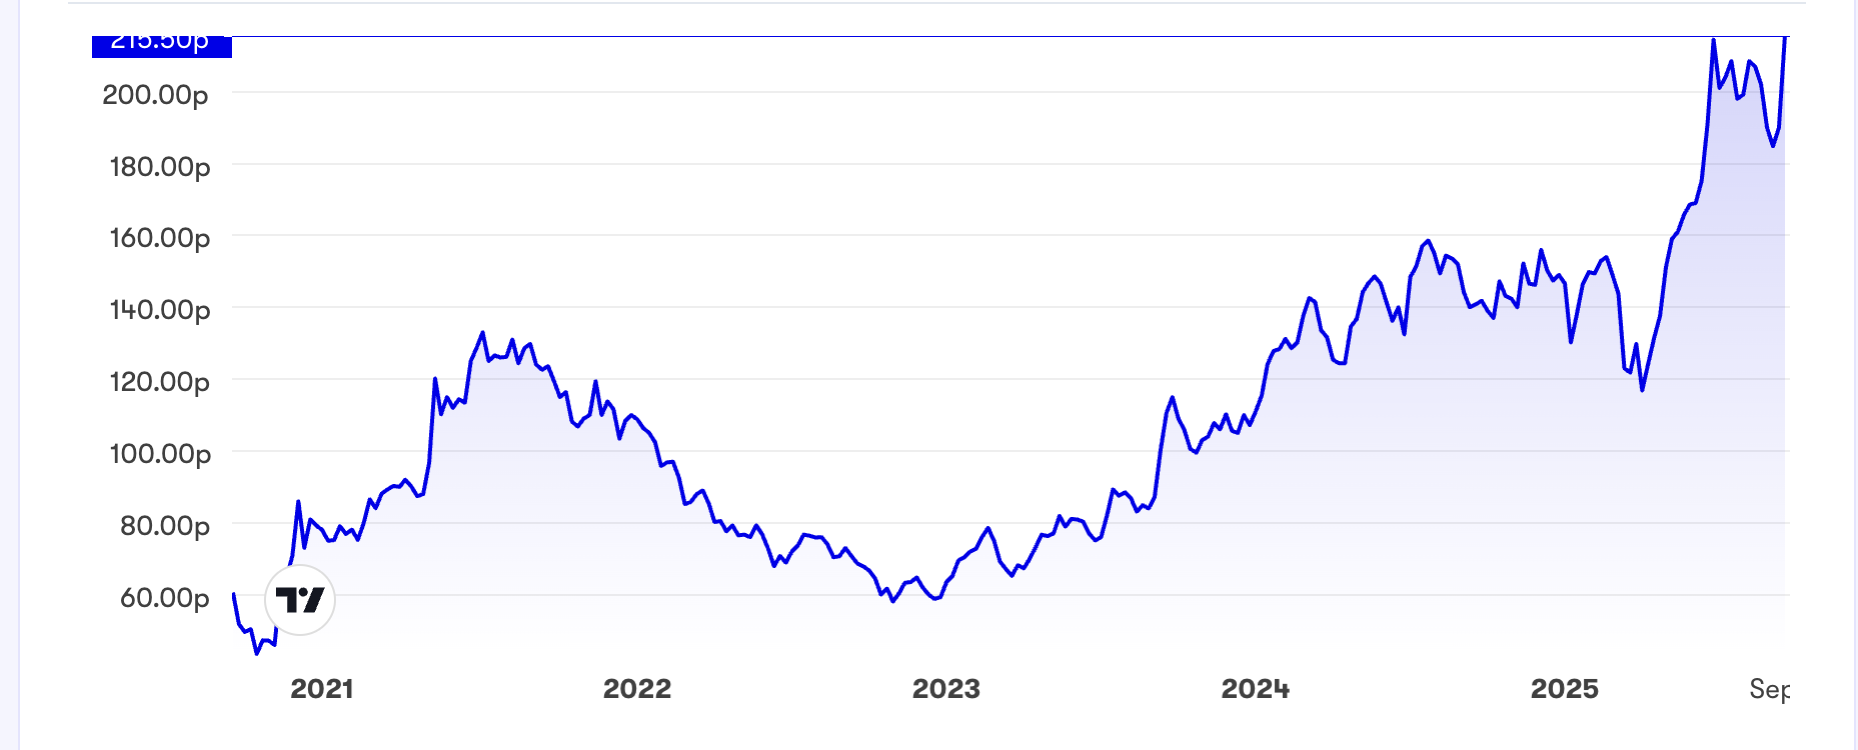
Source: interactive investor. Past performance is not a guide to future performance.
Galliford Try has shown a strong bull trend from 75p in October 2020 - a massive break-out from its 25p to 150p range post the 2008 crisis – rising over 12% to 483p after last Wednesday’s prelims to 30 June:
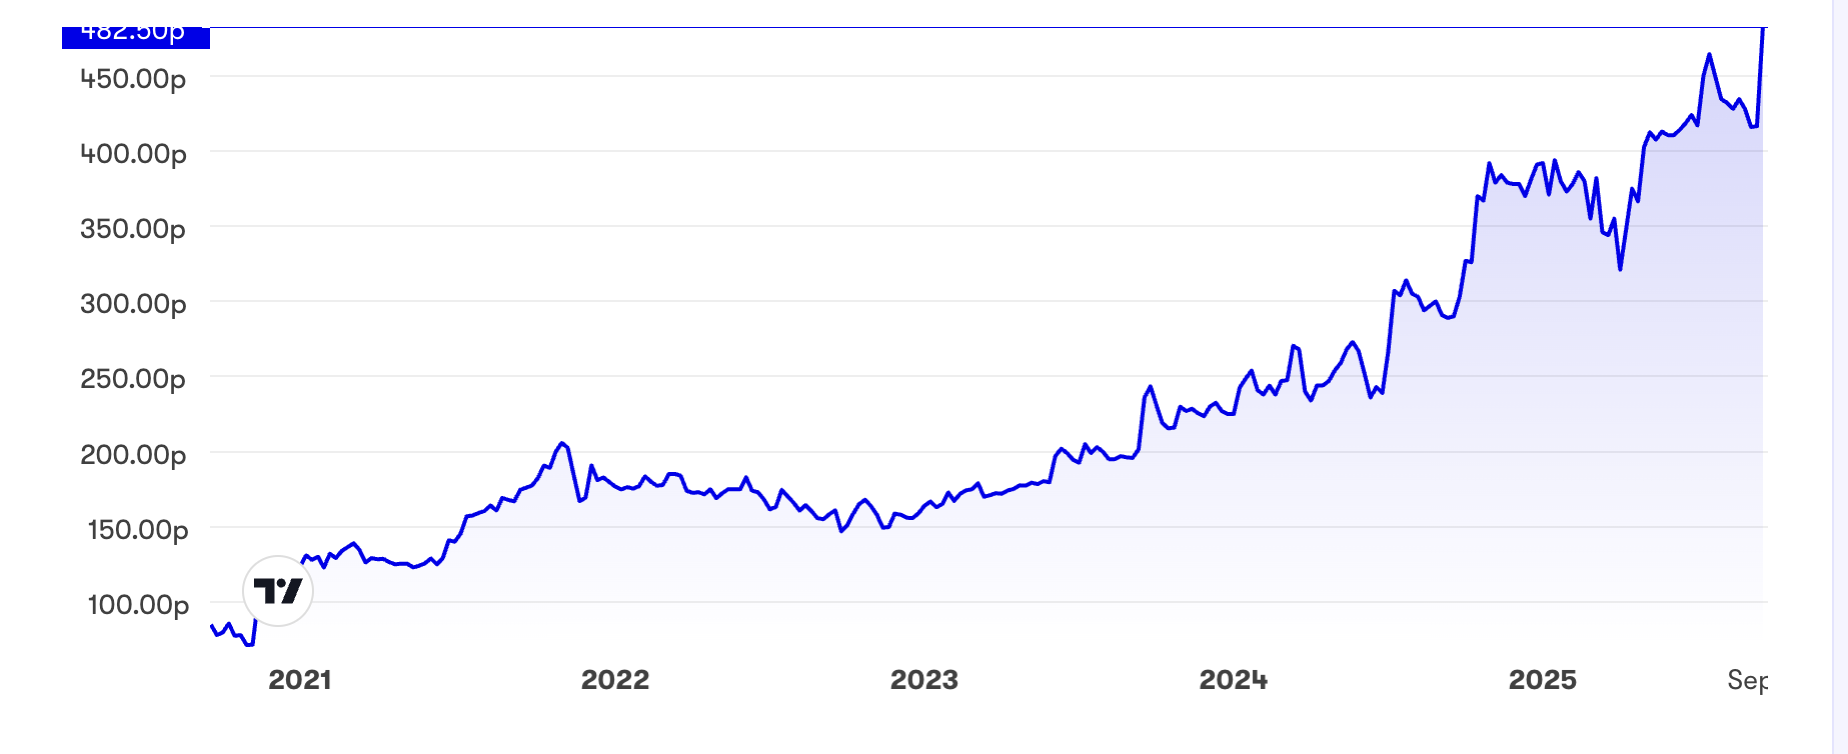
Source: interactive investor. Past performance is not a guide to future performance.
On a simple chart basis, both shares would rate at least a “strong hold”, downside risk having to derive from a general financial crisis. It appears that managers have learned better project management in an inherently low-margin industry, such that occasional disruption does not lead to major losses.
Debt is also under better control unlike when Kier twice had to dilute shareholders in 2018 and 2021. The sector has moved on from the early 2018 collapse of Carillion under £7 billion debt, which created havoc and meant it faced tougher credit.
- FTSE round-up: Games Workshop, Centrica, Galliford Try and Moonpig
- Taylor Wimpey among six construction sector top picks
This was also a factor in creating market valuations low enough as a base for uptrends; Kier is up 330% from its October 2020 low and Galliford Try nearly 600% on a similar scale.
I had rated Galliford Try a “buy” at 97p equivalent (adjusting for share consolidation) in May 2018 after a three-year bear market linked to project overruns and exceptional costs on construction projects.
I also rated Kier as a “buy” at 90p in July 2023 when contract wins were manifesting across highways, rail, infrastructure and nuclear. The late Jim Slater often used to hunt for “status change” shares and both appeared to fit this bill.
Divergence in PE ratings albeit similar yield
Based on consensus forecasts and a 12 months’ forward view, Kier is close to 9x and Galliford Try on 14.5x – I believe significantly due to track record where even Kier’s latest results look mixed in comparison.
Yet relating this to expected earnings growth, near 19% is expected for Kier in its current year to 30 June, easing to 6% in 2027, versus barely 3% for Galliford Try. I hesitate to assume such, after Galliford Try has just said that trading is slightly ahead of expectations in its new financial year to 30 June; also PEG ratings can be a snapshot best applied to consistent growth companies than contractors with potentially lumpy earnings.
For what it's worth, Kier would appear to be on a PEG of 0.7 versus over 2.0 for Galliford Try, as if going forwards Kier might represent a better-value buy.
For yield, Kier offers 3.6% at 216p yield with nearly 3.0x earnings cover and a very strong free cash flow record since its June 2023 year, while Galliford Try offers 3.9% at 483p with around 1.8x earnings cover, and is well-backed by cash flow.
As things stand, both therefore remain attractive for total shareholder return barring some kind of financial crisis.
A UK recession would seem inevitably to compromise construction to some degree although government would likely sustain, if not increase, infrastructure spending. There are already 10-year spending commitments.
An immediate concern is last Tuesday’s UK unemployment figures showing a jump to 4.7% from 4.1% in August. If the UK follows US historical precedent, a recession is imminent if unemployment rises at least 0.5% within a year.
Mixed annual numbers from Kier may help explain its lower PE
There is little progress in inflation-adjusted terms: adjusted operating profit up 6% to £159 million on revenue up 3% to £4,088 million, albeit a 3.9% margin that is decent for the sector.
At the reported level, progress was better: pre-tax profit up 15% to £78 million, earnings per share (EPS) up 8% to 12.8p and the dividend up 38% to 7.2p.
- Bumper upgrade gives this FTSE 250 stock another lift
- Ian Cowie: a new investment trust holding for my ISA
While the order book is up only 2% to a record £11 billion, management says this provides “considerable, multi-year revenue visibility” and the margin is targeted at 4-4.5% - the key to raised forecasts relative to Galliford Try. Time will tell whether the UK employment rights bill going through parliament compromises this.
Net debt has been cut 58% to £49 million (average month-end) but, mind you, big variables to reach this, with nearly £1.7 billion cash offsetting £1.2 billion overdraft where a £35.6 million net interest charge has taken 31% of reported operating profit. Kier’s ratio of current assets to current liabilities was 0.88. Its balance sheet is barely altering overall, not exactly strong for a recession.
Kier Group - financial summary
Year end 30 Jun
| 2014 | 2015 | 2016 | 2017 | 2018 | 2019 | 2020 | 2021 | 2022 | 2023 | 2024 | 2025 | |
| Turnover (£ million) | 2,907 | 3,276 | 3,998 | 4,112 | 4,220 | 3,966 | 3,423 | 3,261 | 3,144 | 3,381 | 3,905 | 4,077 |
| Operating margin (%) | 1.0 | 1.7 | -0.3 | 1.1 | 3.1 | -5.2 | -5.9 | 1.3 | 1.4 | 2.4 | 2.6 | 2.7 |
| Operating profit (£m) | 29.0 | 57.3 | -10.2 | 45.3 | 129 | -205 | -201 | 43.7 | 45.1 | 81.5 | 103 | 112 |
| Net profit (£m) | 10.0 | 4.4 | -17.6 | 10.7 | 87.3 | -210 | -273 | -0.3 | 12.7 | 41.1 | 42.7 | 56.4 |
| Reported EPS (p) | 15.8 | 39.3 | -25.3 | 12.8 | 75.5 | -126 | -90.9 | 11.6 | 2.8 | 9.3 | 11.3 | 12.1 |
| Normalised EPS (p) | 56.1 | 58.0 | 72.9 | 65.3 | 81.7 | 98.7 | 80.8 | 51.7 | 17.8 | 18.3 | 11.8 | 19.3 |
| Earnings per share growth (%) | -10.5 | 3.4 | 25.7 | 4.7 | 25.1 | 20.9 | -18.2 | -35.9 | -65.6 | 3.1 | -35.6 | 63.2 |
| Operating cashflow/share (p) | -8.5 | 168 | 172 | 130 | 111 | -53.5 | -37.9 | 22.8 | 16.3 | 41.6 | 50.9 | 50.4 |
| Capex/share (p) | 78.0 | 58.7 | 53.9 | 52.1 | 54.1 | 20.3 | 4.1 | 3.0 | 1.5 | 1.5 | 3.7 | 3.5 |
| Free cashflow/share (p) | -86.5 | 109 | 118 | 77.6 | 57.3 | -73.8 | -42.0 | 19.8 | 14.8 | 40.1 | 47.2 | 46.9 |
| Dividend per share (p) | 56.5 | 54.2 | 63.4 | 56.7 | 58.0 | 4.2 | 0.0 | 0.0 | 0.0 | 0.0 | 5.2 | 7.2 |
| Covered by earnings (x) | 0.3 | 0.7 | -0.4 | 0.2 | 1.3 | -30.0 | 0.0 | 0.0 | 0.0 | 0.0 | 2.2 | 1.7 |
| Net debt (£m) | 210 | 181 | 143 | 146 | 213 | 195 | 510 | 171 | 163 | 124 | 5.1 | -53.0 |
| Net assets/share (p) | 545 | 603 | 587 | 439 | 517 | 274 | 127 | 97.8 | 124 | 115 | 115 | 114 |
Source: historic Company REFS and company accounts.
Infrastructure has seen a 7% revenue rise albeit a slight reduction in profit after an exceptional gain last year; and like Costain Group (LSE:COST), Kier is enjoying strong demand from water utilities. The order book at 59% of group total has 87% of revenue secure for this fiscal year.
Construction shows flat revenue but moving on from low-margin contracts has supported an 8% rise in operating profit. New business wins include prisons and schools, and any government in the next 10 years is likely to prioritise [these]. At 41% of the group order book, 95% of this year’s revenue is secured.
There is also a relatively smaller property development side – both industrial and residential – which achieved decent adjusted operating profit of £12 million on £38 million revenue.
There were a couple of directors’ share sales following these results: the chief financial officer, £714,000 worth at 204p and the group managing director of transportation, a total of £517,000 worth at just over 200p. At 216p, the market has shrugged these off.
Of the two, Kier possibly gets closer to a “buy” rating in potential earnings terms; but is riskier due to its debt. Overall, I think “hold” appropriate but investors can take encouragement at the recent rally just when fund managers have supposedly turned bearish on the UK.
Galliford Try delivers a fifth year of sequential growth
Adjusted pre-tax profit is up nearly 29% to £45 million on revenue up 6% to £1,875 million, hence the adjusted operating margin up from 2.5% to 3.0%, and adjusted EPS by 16% to 34.4p. At the reported level, there is strong progress with EPS up 23% to 33.7p – no radical difference in the adjustments – and the total dividend is up 23% to 19p.
Galliford Try Holdings - financial summary
Year-end 30 Jun
| 2018 | 2019 | 2020 | 2021 | 2022 | 2023 | 2024 | 2025 | |
| Turnover (£ million) | 2,932 | 1,403 | 1,090 | 1,125 | 1,237 | 1,394 | 1,764 | 1,875 |
| Operating margin (%) | 5.2 | -4.7 | -3.6 | 0.8 | 0.2 | 0.4 | 1.4 | 2.1 |
| Operating profit (£m) | 151 | -66.5 | -39.4 | 8.5 | 2.5 | 5.6 | 13.0 | 39.7 |
| Net profit (£m) | 118 | 86.9 | 320 | 7.7 | 6.3 | 9.1 | 27.4 | 34 |
| Reported EPS (p) | 121 | -46.5 | -29.4 | 9.1 | 5.5 | 8.1 | 26.2 | 32.2 |
| Normalised EPS (p) | 175 | 4.9 | -56.4 | 15.8 | 19.5 | 18.6 | 34.4 | 26.6 |
| Operating cashflow/share (p) | 31.0 | -53.8 | -137 | 55.9 | 19.7 | 31.6 | 52.7 | 52.2 |
| Capex/share (p) | 4.7 | 3.3 | 1.3 | 1.9 | 4.3 | 2.0 | 1.0 | 5.2 |
| Free cashflow/share (p) | 26.3 | -57.1 | -139 | 54.0 | 15.4 | 29.6 | 51.7 | 47.0 |
| Ordinary dividend per share (p) | 74.2 | 58.0 | 0.0 | 4.7 | 8.0 | 10.5 | 15.5 | 19.0 |
| Covered by earnings (x) | 1.6 | -0.8 | 0.0 | 1.9 | 0.7 | 0.8 | 2.2 | 1.7 |
| Return on total capital (%) | 15.1 | -7.5 | -27.5 | 5.8 | 1.7 | 3.9 | 8.1 | 9.3 |
| Cash (£m) | 912 | 591 | 197 | 216 | 219 | 220 | 227 | 238 |
| Net debt (£m) | -98.2 | 56.6 | -175 | -197 | -194 | -181 | -223 | -233 |
| Net assets/share (p) | 614 | 612 | 109 | 121 | 119 | 113 | 118 | 119 |
Source: historic company REFS and company accounts.
Trading momentum continues into the new financial year, slightly ahead of expectations, and strength of cash flow is underlined by another £10 million buyback programme.
There’s a £4.1 billion order book, up 8%, across diversified growth sectors and areas of planned government and regulated spend.
In sharp contrast with Kier – also explaining a better rating – the balance sheet is debt-free aside from £53.8 million lease liabilities, with £238 million cash.
If UK government debt conspires to affect corporate bond yields, raising costs for firms, it makes Galliford Try lower risk to hold.
I think the shares are broadly in a fair value range and I’m wary. The PE can rise towards a classic “growth” rating but there seems genuine underlying momentum, hence “hold” is appropriate.
Edmond Jackson is a freelance contributor and not a direct employee of interactive investor.
These articles are provided for information purposes only. Occasionally, an opinion about whether to buy or sell a specific investment may be provided by third parties. The content is not intended to be a personal recommendation to buy or sell any financial instrument or product, or to adopt any investment strategy as it is not provided based on an assessment of your investing knowledge and experience, your financial situation or your investment objectives. The value of your investments, and the income derived from them, may go down as well as up. You may not get back all the money that you invest. The investments referred to in this article may not be suitable for all investors, and if in doubt, an investor should seek advice from a qualified investment adviser.
Full performance can be found on the company or index summary page on the interactive investor website. Simply click on the company's or index name highlighted in the article.
Disclosure
We use a combination of fundamental and technical analysis in forming our view as to the valuation and prospects of an investment. Where relevant we have set out those particular matters we think are important in the above article, but further detail can be found here.
Please note that our article on this investment should not be considered to be a regular publication.
Details of all recommendations issued by ii during the previous 12-month period can be found here.
ii adheres to a strict code of conduct. Contributors may hold shares or have other interests in companies included in these portfolios, which could create a conflict of interests. Contributors intending to write about any financial instruments in which they have an interest are required to disclose such interest to ii and in the article itself. ii will at all times consider whether such interest impairs the objectivity of the recommendation.
In addition, individuals involved in the production of investment articles are subject to a personal account dealing restriction, which prevents them from placing a transaction in the specified instrument(s) for a period before and for five working days after such publication. This is to avoid personal interests conflicting with the interests of the recipients of those investment articles.