Stockwatch: things just got interesting for this small-cap
A surprisingly positive update has triggered a sharp rally in this company’s share price, and there’s added spice of a potential takeover. Analyst Edmond Jackson gives his view.
13th January 2026 12:41
by Edmond Jackson from interactive investor

In technology especially, it is worth bearing in mind a “feast or famine business”, which can lead both to exceptional gains or losses over time. This involves a company possibly long-established in its specialist field, where the demand pattern is prone to shift radically every few years. When this combines with the crowd sentiment of stock markets, you see classic boom and bust patterns.
- Invest with ii: Top UK Shares | Share Tips & Ideas | Open a Trading Account
Occasionally the business does go into administration, such as Polaroid in 2001, having been one of the 1960s Nifty Fifty US growth stocks. With the rise of digital photography, it failed to reinvent itself or apply its base technology elsewhere. Nokia did better, from mobile phones towards telecoms infrastructure, software and licensing.
For enterprising share traders, the tops and bottoms of charts get particularly interesting as inflection points, although short-sellers of Tesla Inc (NASDAQ:TSLA) often lost out, failing to appreciate the business was doing well despite a high valuation. It did not underperform sufficiently (or involve aggressive accounting) to short with conviction.
Two classic examples from London-listed tech shares
Enterprise software group Microfocus (re-named Merant for a while) proved a big winner in the late 1990s tech boom, partly due to fears about the “Year 2000 problem”, but it slumped thereafter. Opportunistic acquisitions also raised the risk profile, yet the group had a high-calibre record including as the first software company to win a Queen’s Award for Industry. In February 2021 on its share roller coaster, I rated it a “buy” at 433p when the mood was sceptical. In August 2022, it received an all-cash offer at 532p per share from Canada’s OpenText.
Filtronic (LSE:FTC) in radio frequency has seen numerous feast and famine periods relating, for example, to defence and telecoms. I drew attention to the shares at 12.4p in September 2017 when the company’s antennae were selling due to adoption of 4G networks, yet investors had broadly lost interest and the price/earnings (PE) ratio was only 8x.
The next stage of 5G looked like another major opportunity, hence the shares deserved steady accumulation. But the feast is coming from space: in later 2023 the price started to rise to over 20p on contracts for solid state power amplifiers in satellite communications equipment. This led in April 2024 to a strategic partnership with SpaceX, which saw the shares jump to 47p, heralding a bull market. The shares are currently worth 178p.
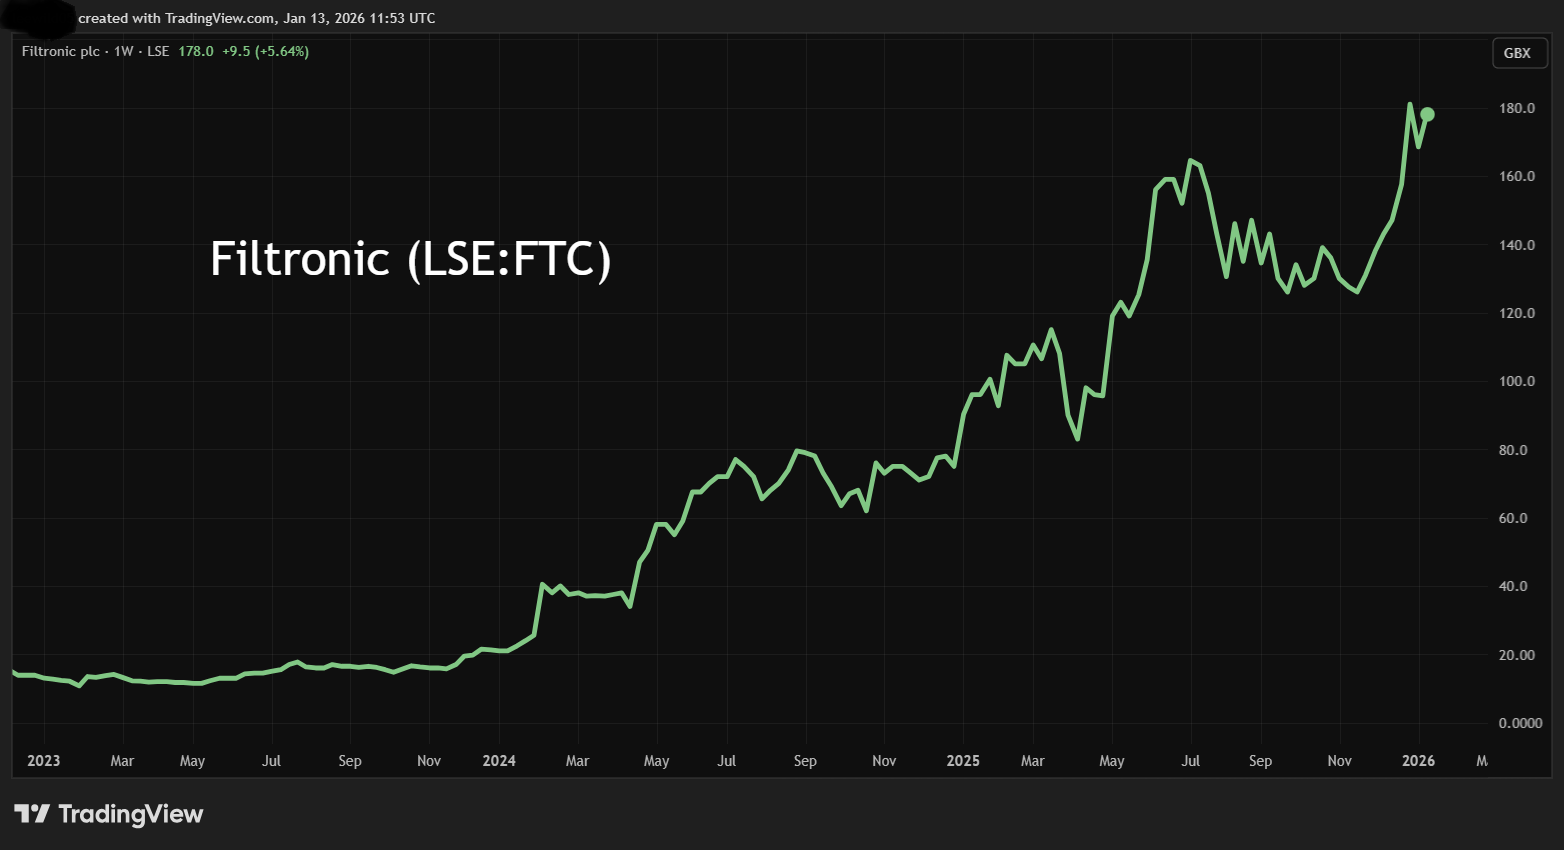
Source: TradingView. Past performance is not a guide to future performance.
Somewhat similar to Tesla, we now see a big PE for Filtronic on nearly 50x versus a relatively modest £8 million net profit expected in each of the next two years, on revenue rising towards £60 million. However, the Space X relationship – involving equity warrants up to 15% of the company – implies this should be an ongoing feast, hence I rate it a “hold”.
Does upturn in IQE have legs or is it speculative?
Yesterday’s turnaround in the trading story from IQE (LSE:IQE), a Cardiff and Newport-based manufacturer of semiconductor wafers, saw its shares jump 42% to 10.4p, marking a rebound of 100% (even factoring in the spread) from 5p on 6 January.
Mind you, since listing on AIM in 2003 this share has not rewarded long-term investors, although traders who backed a run from 17p in 2010 to 57p in early 2011 did well before a slide back below 20p later that year. There was then a huge rally from 17p in 2016 to over 170p by late 2017 before a long bear market – with at least three false rallies - to where it trades today.
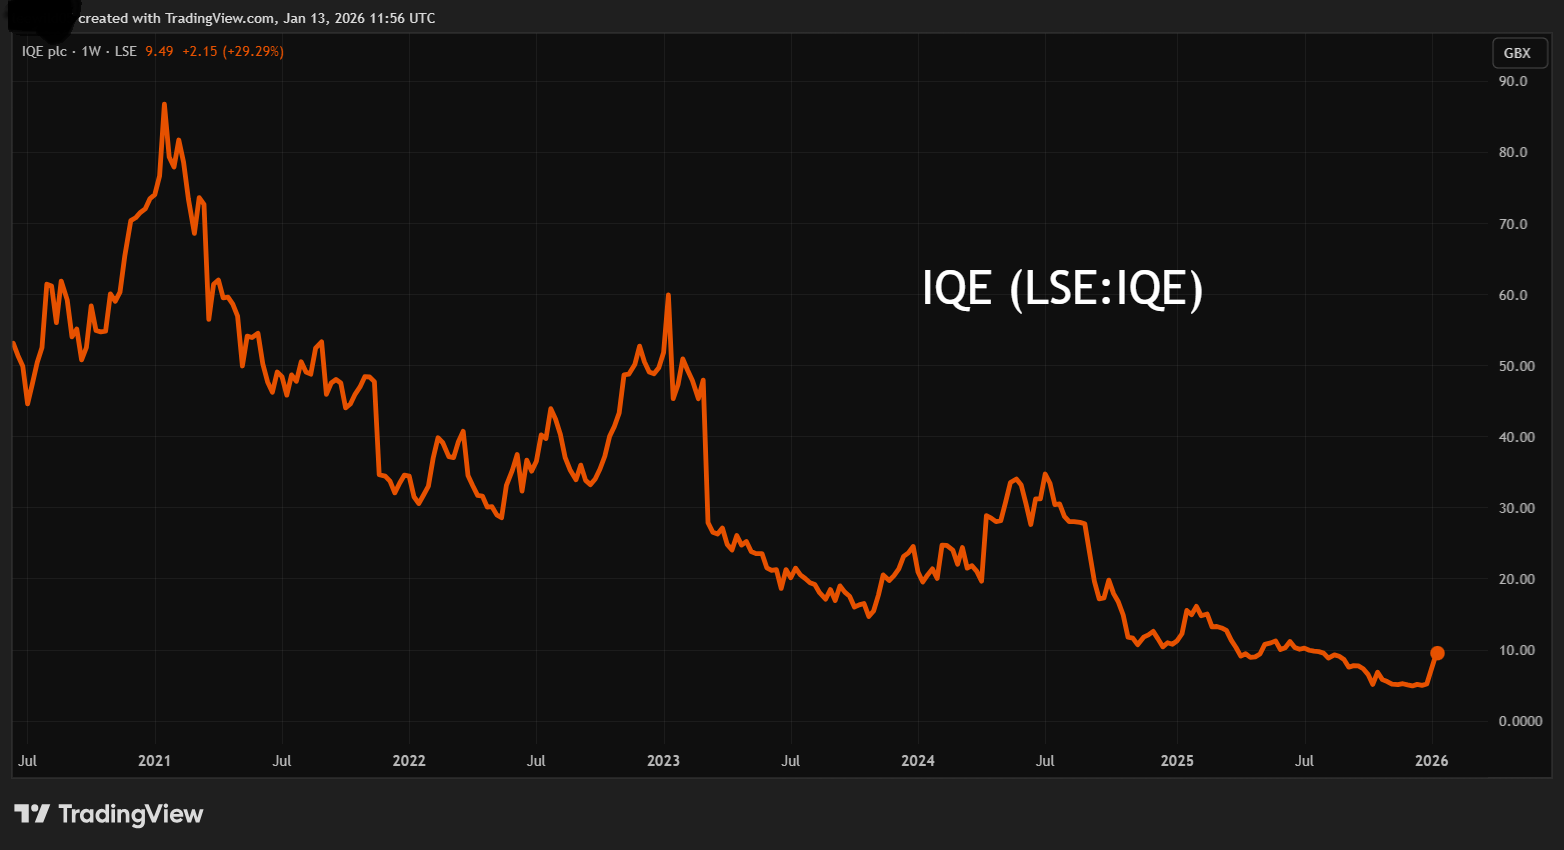
Source: TradingView. Past performance is not a guide to future performance.
My recollection and research suggests that IQE had an even bigger boom to over 800p in the 1999-2000 boom – as a fully listed share – but collapsed to 3p in 2003. Having been aware of it for many years, I drew attention to it in July 2016 at 23p after a bullish revenue update and interim profit/cash flow numbers proved strong. I then declared the shares over-priced at 140p in August 2017.
More recently, IQE has languished in losses and negative free cash flow, with a variable revenue profile also:
IQE - financial summary
year-end 31 Dec
| 2019 | 2020 | 2021 | 2022 | 2023 | 2024 | |
| Turnover (£ million) | 140 | 178 | 154 | 167 | 115 | 118 |
| Operating margin (%) | -13.4 | -3.1 | -13.0 | -43.6 | -22.4 | -27.9 |
| Operating profit (£m) | -18.8 | -5.5 | -20.0 | -73.0 | -25.8 | -33.0 |
| Net profit (£m) | -35.5 | -3.3 | -31.0 | -74.5 | -29.4 | -38.2 |
| EPS - reported (p) | -4.5 | -0.4 | -3.9 | -9.3 | -3.3 | -4.0 |
| EPS - normalised (p) | -2.5 | 1.4 | -2.3 | -0.5 | -3.0 | -2 |
| Operating cashflow/share (p) | 1.0 | 4.0 | 1.9 | 0.7 | 0.7 | 0.3 |
| Capital expenditure/share (p) | 5.4 | 1.3 | 2.3 | 2.2 | 2.0 | 1.5 |
| Free cashflow/share (p) | -4.4 | 2.7 | -0.4 | -1.5 | -1.3 | -1.8 |
| Dividends per share (p) | 0.0 | 0.0 | 0.0 | 0.0 | 0.0 | 0.0 |
| Return on total capital (%) | -5.5 | 1.7 | -6.7 | -29.8 | -11.9 | -16.0 |
| Cash (£m) | 8.8 | 24.7 | 10.8 | 11.6 | 5.6 | 4.7 |
| Net debt (£m) | 63.9 | 45.1 | 60.2 | 66.1 | 48.5 | 69.3 |
| Net assets (£m) | 267 | 260 | 235 | 175 | 170 | 134 |
| Net assets per share (p) | 33.5 | 32.5 | 29.2 | 21.8 | 17.7 | 13.9 |
Source: company accounts.
This is partly due to depreciation of intangible assets, which were £7.7 million in the first half of 2025, albeit less significant than £16.3 million of administrative expenses behind a £23.5 million interim loss. However, net cash from operations did rebound from £2.6 million negative to £3.6 million positive. The first half did, overall, fall short of expectations, “driven by a combination of market headwinds and the unwinding of customer inventory”. Annual revenue was guided at £90 million to £100 million and adjusted EBITDA in a range from minus £5.0 million to £2.0 million positive.
The story shifted radically yesterday, however, to “strong momentum in the second half year” due to US military programmes brought forward and also higher photonics demand in relation to AI and data centres, plus wireless products linked to new handsets. 2025 revenue was guided at £97 million and adjusted EBITDA for “at least £2.0 million”. It seemed a remarkable and broad-based turnaround in a short space of time.
Although the shares rose ahead of the news, yesterday’s jump held, although the price is 4% easier this morning at 10.0p – still not exactly a “pump and dump” although 83 million shares were traded yesterday, about 8.5% of IQE’s issued share capital.
September’s update also cited a potential sale of the entire company being explored, not just its Taiwan operation to fully repay £40.5 million debt (as of 30 June). While HSBC waived a fourth-quarter 2025 covenant, the sale does rather look like capitulation to a creditor. Yesterday’s update did not even estimate year-end net debt, although cash cited at £15.6 million had implicitly declined 9.0% over six months.
The first quarter 2026 order book is described as “strong”, a term I dislike without quantifying as this could even include “flat”. But given the narrative and expectation that “the momentum in wireless demand observed in the fourth quarter is expected to continue”, it is an upturn of sorts, and highly convenient for takeover terms.
With a current market value of £102 million, IQE is an intriguing speculative play on whether this update can enhance terms where “the board is encouraged by the level of interest received and the recognition of the intrinsic value of the group and its component parts”. There is a standard caveat on how there can be no certainty of any deal completing.
However, potential offerers for the entire group were already cited last September, so this is starting to drag on, if not untypical of some takeovers.
At 10p per share, IQE trades at 1.1x net tangible assets of £86.2 million or 8.8p per share. A full takeover seems unlikely to happen at a discount even though IQE’s back is against the wall with ongoing losses.
More ‘cigar butt’ speculation than feast ahead
Overall, I suspect IQE is nearing an endgame as a listed company given its record of losses, although £80 million over the last three years might have value to an acquirer besides IQE’s strategic appeal, if such losses can be utilised against tax. You understand why any deal is taking time to evaluate.
Any profit-taking – the price did ease to 9.62p earlier – is getting absorbed, although it’s unclear whether the shares will fall again after this surprise element peters out. But advisers Lazard should be incentivised to earn a takeover fee, so I tend to think that a deal will happen, hence the shares rate a speculative “buy”.
Edmond Jackson is a freelance contributor and not a direct employee of interactive investor.
AIM stocks tend to be volatile high-risk/high-reward investments and are intended for people with an appropriate degree of equity trading knowledge and experience.
These articles are provided for information purposes only. Occasionally, an opinion about whether to buy or sell a specific investment may be provided by third parties. The content is not intended to be a personal recommendation to buy or sell any financial instrument or product, or to adopt any investment strategy as it is not provided based on an assessment of your investing knowledge and experience, your financial situation or your investment objectives. The value of your investments, and the income derived from them, may go down as well as up. You may not get back all the money that you invest. The investments referred to in this article may not be suitable for all investors, and if in doubt, an investor should seek advice from a qualified investment adviser.
Full performance can be found on the company or index summary page on the interactive investor website. Simply click on the company's or index name highlighted in the article.
Disclosure
We use a combination of fundamental and technical analysis in forming our view as to the valuation and prospects of an investment. Where relevant we have set out those particular matters we think are important in the above article, but further detail can be found here.
Please note that our article on this investment should not be considered to be a regular publication.
Details of all recommendations issued by ii during the previous 12-month period can be found here.
ii adheres to a strict code of conduct. Contributors may hold shares or have other interests in companies included in these portfolios, which could create a conflict of interests. Contributors intending to write about any financial instruments in which they have an interest are required to disclose such interest to ii and in the article itself. ii will at all times consider whether such interest impairs the objectivity of the recommendation.
In addition, individuals involved in the production of investment articles are subject to a personal account dealing restriction, which prevents them from placing a transaction in the specified instrument(s) for a period before and for five working days after such publication. This is to avoid personal interests conflicting with the interests of the recipients of those investment articles.