Stockwatch: two oversold shares or a warning sign?
These shares haven’t been so low in many years, and the slump has caught the eye of analyst Edmond Jackson. Here’s what he thinks of prospects.
25th November 2025 11:16
by Edmond Jackson from interactive investor

Despite yesterday’s initial relief rally in UK shares on the back of US interest rate cut hopes, it was notable how two marketing services groups began the week with further material falls after issuing financial downgrades. Irrespective of whether you invest in this sector or not, this event is significant as a litmus test of wider business activity.
- Invest with ii: Top UK Shares | Share Tips & Ideas | Open a Trading Account
Both M&C Saatchi (LSE:SAA) and S4 Capital (LSE:SFOR) cited a difficult second half of the year. The only saving grace was Saatchi blaming an exceptional factor of the 43-day US government shutdown, although you could say that will impact various US businesses. This higher margin Global and Social Issues division represents nearly a third of group revenue. Indeed, “Non-Advertising Specialisms” accounted for 67% of interim group revenue and 87% of profit.
Consequently, despite only perhaps a 2% reduction in 2025 revenue from £213 million expected, adjusted operating profit is guided down from £31 million to £26 million. Then in 2026, £219 million revenue and £28 million profit.
After falling to 110p, the AIM-listed shares closed down 5% at 120p as some buyers perceived value in an implied 2026 price/earnings (PE) ratio below 8x. As ever with cyclically exposed shares, the dilemma is whether seemingly cheap might become even cheaper. Meanwhile, a prospective yield below 2% is no real support and the balance sheet has intangibles at 81% of net assets.
For what the chart is worth, this latest drop affirms a support level of 120-125p lows in 2021 and 2023 after a plunge from near 200p last July:
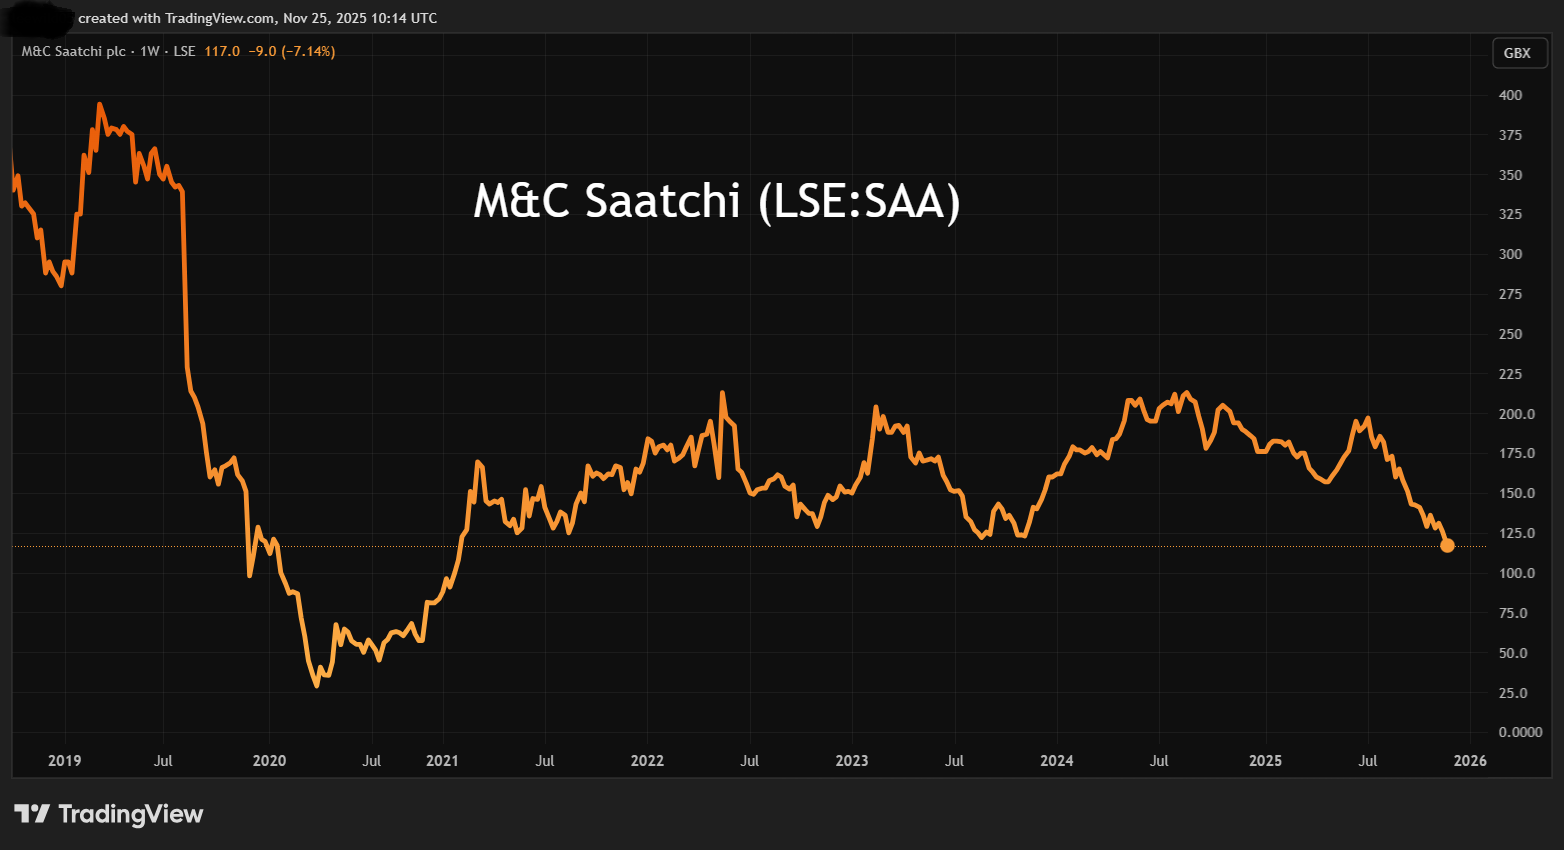
Source: TradingView. Past performance is not a guide to future performance.
Despite cutting costs, there is a £5 million buyback programme which seems modestly useful relative to £146 million market value and is supported by £11 million net cash as of end-June. This could prove astute if Saatchi’s businesses are approaching a cyclical low. Some might say that artificial intelligence (AI) is displacing such services, but my feeling is that this could be correct up to a point, and Saatchi is apparently less exposed to this given its operational bias.
The 10-year table shows volatile performance, implying this share should never deserve a growth PE, but see how dividends per share were at 7-11p pre-2019. Considering projected earnings cover is implied at over 6x, then there ought to be scope to raise the payout once they’re past a cyclical low. This could mean a significantly higher yield for patient investor.
M&C Saatchi - financial summary
year end 31 Dec
| 2015 | 2016 | 2017 | 2018 | 2019 | 2020 | 2021 | 2022 | 2023 | 2024 | |
| Turnover (£ million) | 179 | 225 | 251 | 417 | 381 | 323 | 395 | 463 | 420 | 395 |
| Operating margin (%) | 8.2 | 3.0 | 2.1 | -1.0 | -0.8 | -1.4 | 6.8 | 2.3 | 1.4 | 5.7 |
| Operating profit (£m) | 14.7 | 6.7 | 5.3 | -4.0 | -3.2 | -4.4 | 26.9 | 10.5 | 5.7 | 22.5 |
| Net profit (£m) | 6.5 | 0.1 | 2.7 | -13.1 | -11.8 | -9.9 | 12.8 | 0.1 | -3.5 | 14.7 |
| Reported EPS (p) | 9.1 | 0.2 | 3.2 | -15.5 | -13.1 | -9.1 | 10.5 | 0.1 | -3.7 | 9.4 |
| Normalised EPS (p) | 10.0 | 0.5 | 6.2 | -11.8 | -7.2 | -4.4 | 12.4 | 14.7 | 9.0 | 17.6 |
| Return on total capital (%) | 19.7 | 7.1 | 4.6 | -3.5 | -3.2 | -4.7 | 22.9 | 10.1 | 13.5 | 23.2 |
| Operating cashflow/share (p) | 22.7 | 24.9 | 27.8 | 8.4 | 31.0 | 30.9 | 15.6 | 10.5 | -2.9 | 15.4 |
| Capital expenditure/share (p) | 3.4 | 5.2 | 4.5 | 6.7 | 6.4 | 3.4 | 2.2 | 4.6 | 1.5 | 2.4 |
| Free cashflow/share (p) | 19.3 | 19.7 | 23.3 | 1.7 | 24.6 | 27.6 | 13.5 | 6.0 | -4.4 | 13.1 |
| Dividend per share (p) | 7.2 | 8.3 | 9.5 | 11.0 | 2.5 | 0.0 | 0.0 | 1.5 | 1.6 | 2.0 |
| Covered by earnings (x) | 1.3 | 0.0 | 0.3 | -1.4 | -5.3 | 0.0 | 0.0 | 0.1 | -2.3 | 4.8 |
| Cash (£m) | 32.3 | 32.2 | 49.0 | 50.1 | 69.0 | 76.3 | 69.4 | 41.5 | 24.3 | 25.9 |
| Net debt (£m) | -5.5 | -0.3 | -7.5 | 2.5 | 38.2 | 13.4 | 22.0 | 25.3 | 41.1 | 29.8 |
| Net assets (£m) | 37.7 | 42.6 | 57.5 | 68.0 | 49.2 | 44.9 | 32.5 | 38.0 | 29.0 | 40.0 |
Source: historic company REFS and company accounts.
As for near-term financial risk, say if the US economy falters, the 30 June balance sheet had £39.5 million net assets supporting £14.9 million long-term debt and £40.8 million leases versus £24.2 million cash. The ratio of current assets to current liabilities was satisfactory at 1.5x. Significantly, there were no contingent liabilities such as earnouts.
While a true “margin of safety” is elusive for this share, it is notable how earlier this month the board rejected a £50 million offer for the M&C Saatchi Performance – responsible for media planning and buying across digital channels – from Brave Bison Group (LSE:BBSN), on grounds of undervaluing it.
I therefore consider Saatchi rates at least a “hold” at 119p currently, with the obvious caveat about how tariffs, public debt and possible further downside in stock markets could conflate for economic weakness in 2026. If management truly believes in prospects (although material share buying tailed off last May), now would be the time to propose a buyout.
Is S4 Capital’s fourth downgrade indicative of a trough?
The adage is that profit warningscome in threes, and basic maths might imply scope at least for stabilisation – even if a mean-reversion in performance requires more proof.
Fully listed but behaving more like an AIM share nowadays, S4 Capital shares have continued to plumb fresh lows after falling from 828p in 2021:
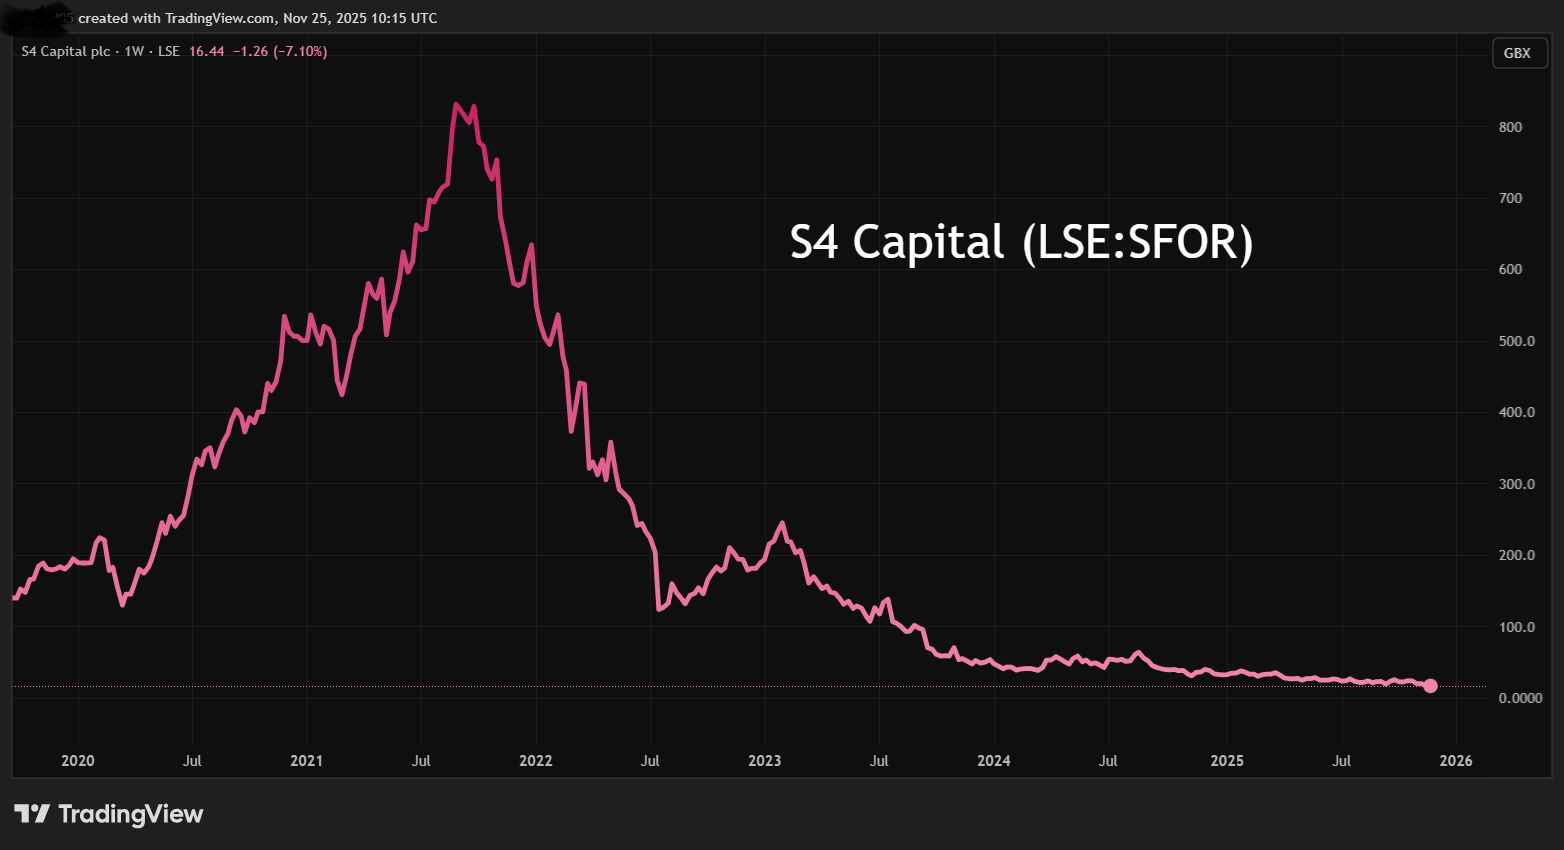
Source: TradingView. Past performance is not a guide to future performance.
Yesterday, the price did not recover as well as Saatchi. Shares closed down 6% near 17p after an update cited annual revenue is now expected down almost 10% due to lower project-based revenue, client caution and slower new business build. All appear to me symptomatic of a faltering economy, and although it is fashionable to knock executive chair and founder Sir Martin Sorrell for the investment disaster S4 has become, I would treat its warning seriously in a wider context.
Compared with the 15 September interim results, management then was guiding for revenue down by mid-single digits – somewhat ironically with technology services down more due to longer sales cycles and near-term revenue reduction by a major client. I think this underlines how technology is not necessarily a cyclical hedge unless you can be specific about how a segment offers growth. Otherwise, a broadly volatile tag can be more realistic. Marketing services were expected down low single digits, reflecting the timing of significant new business wins from US blue-chip clients.
- Insider: three CEOs exploit weak share prices
- 10 hottest ISA shares, funds and trusts: week ended 21 November 2025
As if reflecting an aspect of operational gearing, operating profit is expected to be about 8% lower than consensus at around £75 million, which is still material, and year-end targeted net debt remains between £100 million and £140 million.
S4 Capital - financial summary
year-end 30 Dec
| 2018 | 2019 | 2020 | 2021 | 2022 | 2023 | 2024 | |
| Turnover (£ million) | 54.8 | 215 | 343 | 687 | 1,069 | 1,012 | 848 |
| Operating margin (%) | -15.4 | -1.8 | 2.4 | -6.3 | -12.5 | 2.1 | -35.9 |
| Operating profit (£m) | -8.5 | -3.8 | 8.1 | -43.4 | -134 | 21.5 | -304 |
| Net profit (£m) | -8.1 | -10.0 | -3.9 | -56.7 | -160 | -14.3 | -307 |
| EPS - reported (p) | -3.3 | -2.7 | -0.8 | -10.3 | -27.0 | -2.2 | -45.7 |
| EPS - normalised (p) | -2.0 | -0.5 | 2.4 | 4.8 | 2.7 | -1.2 | -0.2 |
| Operating cashflow/share (p) | 1.3 | 6.7 | 12.5 | 9.9 | 13.2 | -1.7 | 12.5 |
| Capital expenditure/share (p) | 0.6 | 2.8 | 1.5 | 2.7 | 3.0 | 1.3 | 1.2 |
| Free cashflow/share (p) | 0.7 | 3.9 | 11.0 | 7.2 | 10.2 | -3.0 | 11.3 |
| Dividends per share (p) | 0.0 | 0.0 | 0.0 | 0.0 | 0.0 | 0.0 | 1.0 |
| Cash (£m) | 25.0 | 65.4 | 142 | 301 | 224 | 146 | 168 |
| Net debt (£m) | 20.6 | 3.7 | -22.6 | 52.0 | 162 | 224 | 182 |
| Net assets (£m) | 342 | 466 | 716 | 801 | 850 | 892 | 577 |
| Net assets per share (p) | 94.2 | 99.4 | 132 | 144 | 150 | 153 | 93.2 |
Source: company accounts.
Versus a lack of recent share buying at Saatchi, last September an investment company owned by two former S4 executive directors bought one million shares at just over 22p. It’s unclear whether they are right to sense longer-term value, and catching a low is usually treacherous. Or does this show that they are not exactly in touch with the underlying business, or the bigger economic winds that are disrupting it?
If we default to guidance from the 30 June balance sheet – as to how S4 might weather any storm – it is only modestly good in parts.
Versus a capitalisation of £111 million, there were £502 million net assets albeit constituted 130% by goodwill/intangibles. There was £317 million long-term debt alongside £37 million lease liabilities, hence with £175 million cash, net debt of £179 million, which is 1.6x market cap. The interim income statement showed £14 million net finance costs swiping 85% of adjusted operating profit, or exacerbating a £22 million net loss.
At least the ratio of current assets to current liabilities is fair enough at near 1.3x within which £397 million trade payables were 1.1x trade receivables. Contingent considerations (such as earnouts for acquisitions) were a modest £11 million.
I recall, however, a brilliant buying opportunity in WPP (LSE:WPP), for which Sorrell is best known as founding and running, down as a single penny share amid the 1992 sterling crisis. Quite similarly, the group had embarked on an acquisitions spree, carried substantial debt, then was met with a downturn. So, I wouldn’t be dismissive of S4, a turnaround could chiefly be a matter of timing versus the wider economy.
The group does appear to be taking appropriate AI initiatives, although it’s hard to judge what the net upshot will be. Moreover, what forecast trimming has appeared in response to this latest update is marginal with respect to 2026. Given the debt, I’m wary of expectations for a dividend above 1.0p in respect of next year, implying a circa 7% yield.
At least the business looks to be trading amply within its debt covenants, so I would tag the shares broadly with a “hold” stance than “sell”. But with fresh money, notice how two hedge funds very slightly increased their short positions to 0.5% and 0.6% of S4’s issued share capital on 10 and 19 November respectively.
Edmond Jackson is a freelance contributor and not a direct employee of interactive investor.
AIM stocks tend to be volatile high-risk/high-reward investments and are intended for people with an appropriate degree of equity trading knowledge and experience.
These articles are provided for information purposes only. Occasionally, an opinion about whether to buy or sell a specific investment may be provided by third parties. The content is not intended to be a personal recommendation to buy or sell any financial instrument or product, or to adopt any investment strategy as it is not provided based on an assessment of your investing knowledge and experience, your financial situation or your investment objectives. The value of your investments, and the income derived from them, may go down as well as up. You may not get back all the money that you invest. The investments referred to in this article may not be suitable for all investors, and if in doubt, an investor should seek advice from a qualified investment adviser.
Full performance can be found on the company or index summary page on the interactive investor website. Simply click on the company's or index name highlighted in the article.
Disclosure
We use a combination of fundamental and technical analysis in forming our view as to the valuation and prospects of an investment. Where relevant we have set out those particular matters we think are important in the above article, but further detail can be found here.
Please note that our article on this investment should not be considered to be a regular publication.
Details of all recommendations issued by ii during the previous 12-month period can be found here.
ii adheres to a strict code of conduct. Contributors may hold shares or have other interests in companies included in these portfolios, which could create a conflict of interests. Contributors intending to write about any financial instruments in which they have an interest are required to disclose such interest to ii and in the article itself. ii will at all times consider whether such interest impairs the objectivity of the recommendation.
In addition, individuals involved in the production of investment articles are subject to a personal account dealing restriction, which prevents them from placing a transaction in the specified instrument(s) for a period before and for five working days after such publication. This is to avoid personal interests conflicting with the interests of the recipients of those investment articles.