Why I'm worried about ITM Power shares
21st October 2021 07:31
by Alistair Strang from Trends and Targets
Since making a record high in January, share price performance has been less convincing. Here's what independent analyst Alistair Strang's charts tell him about possible future direction.

Our previous report on ITM Power (LSE:ITM) in November 2019 has proven quite extraordinary. We had the courage to show some future targets on the illustrative charts but opted to “bottle it” in the text. To be honest, the only thing which permitted movement from 80p to 248p was a calculation, rather than any specific chart logic.
Not only did the price reach 248p, it was gapped above this level in 2020 and somehow made its way to 724p eventually!
We had been impressed at the company's technological Hydrogen Cell base, and it certainly appears that the market was equally fascinated.
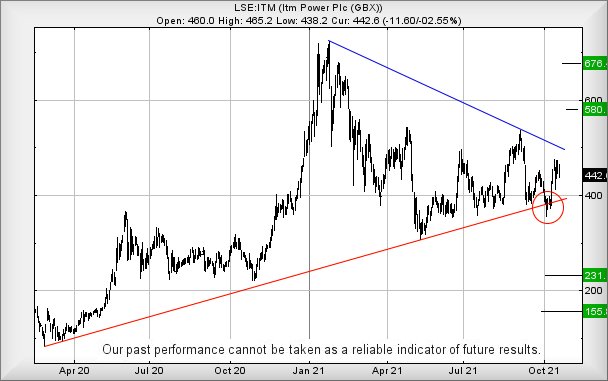
However, on the chart below, we’ve circled something which bothers us a little. Since March 2020, there has been a pretty solidly defined uptrend and, earlier this month, the share price briefly spiked below the uptrend. As we’ve mentioned previously, this sort of one session event can often be taken as a warning signal, the market essentially broadcasting the uptrend cannot be trusted.
- Will this share take off like a rocket again?
- AIM stock performance: winners and losers in 2021 so far
- ITM Power Q&A: annual results 2021
If this is indeed the case, weakness next below 356p risks promoting trouble, allowing reversal to an initial 231p with secondary, if broken, calculating at a bottom of 155p. Visually, there are plenty of arguments favouring a bounce at the 231p level.
Perhaps we’re being too negative, reading too much into whatever happened on October 6th!
Presently trading around 442p, the share price now needs to exceed 479p as this, allegedly, should trigger price recovery to 580p.
If playing safe, waiting until the share price closes above Blue (currently 504p), should make some sense. Our longer term secondary, should 580p be exceeded, works out at 676p. The chart visuals suggest some hesitation at such a level.
Source: Trends and Targets. Past performance is not a guide to future performance
Alistair Strang has led high-profile and "top secret" software projects since the late 1970s and won the original John Logie Baird Award for inventors and innovators. After the financial crash, he wanted to know "how it worked" with a view to mimicking existing trading formulas and predicting what was coming next. His results speak for themselves as he continually refines the methodology.
Alistair Strang is a freelance contributor and not a direct employee of Interactive Investor. All correspondence is with Alistair Strang, who for these purposes is deemed a third-party supplier. Buying, selling and investing in shares is not without risk. Market and company movement will affect your performance and you may get back less than you invest. Neither Alistair Strang or Interactive Investor will be responsible for any losses that may be incurred as a result of following a trading idea.
These articles are provided for information purposes only. Occasionally, an opinion about whether to buy or sell a specific investment may be provided by third parties. The content is not intended to be a personal recommendation to buy or sell any financial instrument or product, or to adopt any investment strategy as it is not provided based on an assessment of your investing knowledge and experience, your financial situation or your investment objectives. The value of your investments, and the income derived from them, may go down as well as up. You may not get back all the money that you invest. The investments referred to in this article may not be suitable for all investors, and if in doubt, an investor should seek advice from a qualified investment adviser.
Full performance can be found on the company or index summary page on the interactive investor website. Simply click on the company's or index name highlighted in the article.