11 investment trust discount opportunities
A Kepler analyst offers a three-month market review and examines the state of the trust universe.
16th April 2021 17:38
A Kepler analyst offers a three-month market review and examines the state of the trust universe.

This content is provided by Kepler Trust Intelligence, an investment trust focused website for private and professional investors. Kepler Trust Intelligence is a third-party supplier and not part of interactive investor. It is provided for information only and does not constitute a personal recommendation.
Material produced by Kepler Trust Intelligence should be considered a marketing communication, and is not independent research.
When we last updated our portfolio of discounted opportunities, markets were basking after a vaccine-pumped rally which proved good for NAVs and saw discounts narrow. The last three months (since 7 January 2021) have been rockier.
While the news about the timetable for re-openings has been good in the UK and in the US, and the results from the Israeli experiment have been close to ideal, Europe and the emerging markets have had setbacks. There has been some volatility in the hottest sectors in the rally and, indeed, in the growth sectors which have dominated the post-crisis period. For example, Scottish Mortgage (LSE:SMT)’s share price was up 16% for 2021 at one point, fell 28% and is now back where it started the year.
Overall, however, it has been a good three months for investors in investment trusts. A weighted average of the whole investment trust sector has generated share price returns ahead of global and UK stock indices, in part because their discounts have narrowed on the whole. Below, we discuss the state of the investment trust universe before turning to the 11 trusts we have previously highlighted as having wide discounts that we would expect to close over time, whilst also retaining, in our opinion, good NAV potential.
Three-month market review
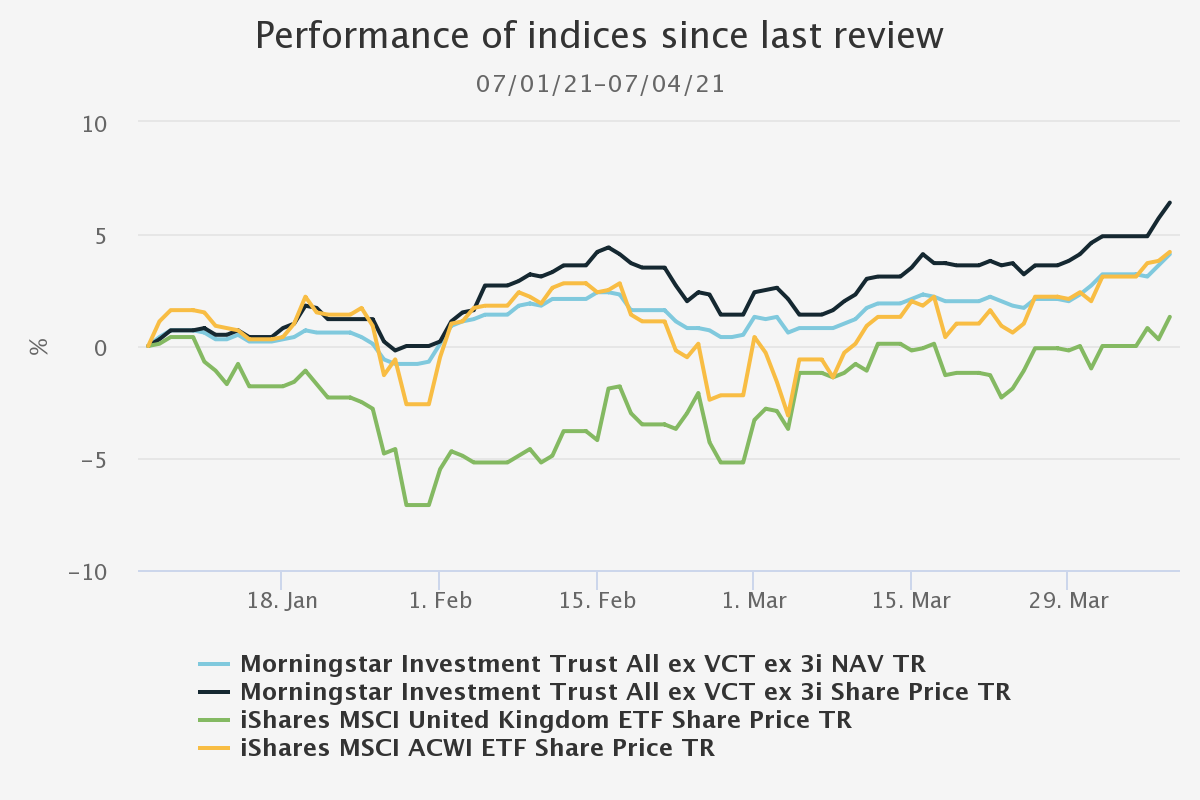
It is exactly three months at the time of writing since our last review of our discounted opportunity portfolio. In the quarter to 7 April 2021, markets have ground higher, although the UK has lagged relative to global markets after doing exceptionally well in the final quarter of 2020. The investment trust universe as a whole, on a weighted average basis, has performed in line with the MSCI ACWI (using an iShares ETF as a proxy) on a NAV basis, with the average share price outperforming as on average discounts have narrowed.
Investment trust sector performance
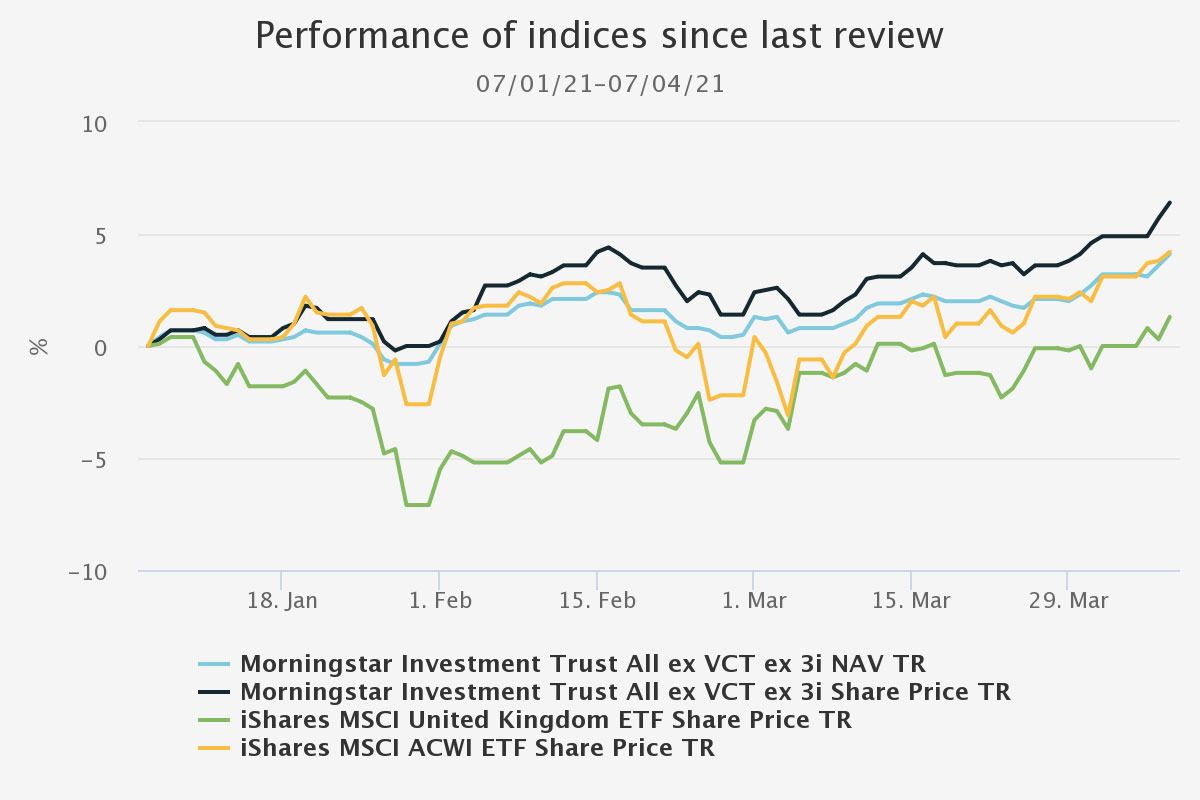
Source: Morningstar. Past performance is not a reliable guide to future returns
In fact, the Morningstar investment trust universe is now trading on a weighted average premium of 6.5% (as of 07/04/2021), up from a discount of just under 2% as of our last review. This is a remarkable turnaround from the discount of over 20% that was seen just over a year ago in the aftermath of the coronavirus crash.
Discount
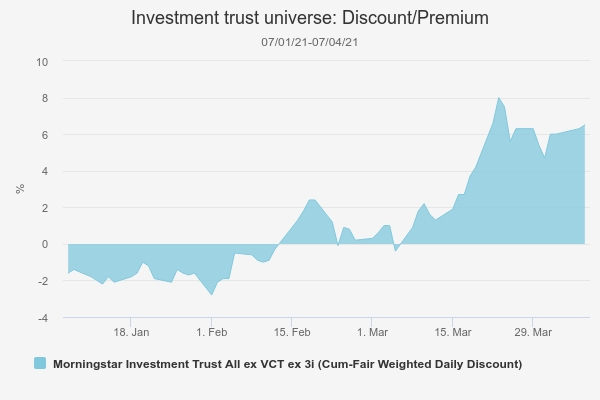
Source: Morningstar. Past performance is not a reliable guide to future returns
As the table below, ordered by the narrowing of the discount over this period, indicates, some ‘value’ sectors and some seen as victims of the pandemic have continued to close their discounts.
We would typically classify Global High Income, Commodities & Natural Resources and UK Equity & Bond in the first category, and the UK Commercial Property sector in the second. The first category saw some excellent NAV total returns as the reflation trade continued (see table below).
However, it hasn’t simply been a case of a rotation into value: the ‘Covid winner’ sectors of Property – UK Logistics, and Growth Capital have continued to see their discounts narrow, even if NAV returns were relatively muted. Among the few sectors to see a widening discount are some high-growth markets which have taken a breather – China, Japan – and the infrastructure funds. Returns in China have actually been good over our period, although this is misleading: the sector peaked in February after a sharp rally and both NAVs and share prices have fallen significantly since then.
Sector discount moves
| Sector | Weighted daily discount 07/01/2021 | Weighted daily discount 07/04/2021 | Discount narrowing (07/01/21 - 07/04/21) | NAV TR (cumulative, 07/01/21-07/04/21) |
|---|---|---|---|---|
| Morningstar IT Property - UK Logistics | 0.8 | 11.5 | 10.7 | 4.9 |
| Morningstar IT Global High Income | -32.7 | -24.8 | 8 | 33.7 |
| Morningstar IT Flexible Investment | -12.2 | -6.4 | 5.8 | 9.2 |
| Morningstar IT Property - UK Commercial | -16.7 | -11 | 5.7 | 3.7 |
| Morningstar IT Royalties | -1.4 | 4.2 | 5.7 | -3.4 |
| Morningstar IT Property - UK Residential | -7.3 | -1.9 | 5.4 | 1.2 |
| Morningstar IT Commodities & Natural Resources | -7.5 | -3 | 4.5 | 26.9 |
| Morningstar IT UK Equity & Bond Income | -9.2 | -4.8 | 4.4 | 26.5 |
| Morningstar IT Property Securities | -8.5 | -4.4 | 4.1 | 8.1 |
| Morningstar IT Growth Capital | 5.5 | 9.4 | 3.8 | 5.2 |
| Morningstar IT Debt - Structured Finance | -13.2 | -9.9 | 3.3 | 9.7 |
| Morningstar IT Environmental | -1 | 2.3 | 3.2 | 16.5 |
| Morningstar IT Private Equity ex 3i | -13.6 | -10.6 | 3 | 1.2 |
| Morningstar IT Infrastructure Securities | -2.3 | 0.8 | 3 | 14.8 |
| Morningstar IT Property - UK Healthcare | 4.3 | 6.5 | 2.2 | 2.3 |
| Morningstar IT Leasing | -34.8 | -32.6 | 2.2 | 2.6 |
| Morningstar IT North American Smaller Companies | -2.7 | -0.5 | 2.2 | 23.3 |
| Morningstar IT UK Equity Income | -3.2 | -1.4 | 1.8 | 24.3 |
| Morningstar IT UK Smaller Companies | -5.7 | -4.6 | 1.1 | 25.7 |
| Morningstar IT Asia Pacific Smaller Companies | -9.3 | -8.3 | 1 | 19.9 |
| Morningstar IT Global Equity Income | -0.2 | 0.8 | 1 | 15.7 |
| Morningstar IT India | -12.1 | -11.2 | 1 | 19.9 |
| Morningstar IT Property - Europe | -22.7 | -22 | 0.7 | -1.3 |
| Morningstar IT Global Emerging Markets | -7.6 | -7.1 | 0.5 | 16.6 |
| Morningstar IT Asia Pacific Equity Income | -2.6 | -2.1 | 0.5 | 17 |
| Morningstar IT North America | -4 | -3.7 | 0.4 | 18.8 |
| Morningstar IT Latin America | -9.1 | -8.9 | 0.3 | 14.5 |
| Morningstar IT UK All Companies | -3.7 | -3.7 | 0.1 | 27.7 |
| Morningstar IT Debt - Loans & Bonds | -5.9 | -5.8 | 0 | 6.6 |
| Morningstar IT Asia Pacific | -3.6 | -3.6 | 0 | 19.3 |
| Morningstar IT Financials | 1 | 1 | -0.1 | 26.2 |
| Morningstar IT Country Specialist | -9.7 | -10.3 | -0.6 | 23.5 |
| Morningstar IT Debt - Direct Lending | -7.5 | -8.3 | -0.7 | 3.9 |
| Morningstar IT China / Greater China | -0.1 | -1.6 | -1.5 | 10.7 |
| Morningstar IT Global Smaller Companies | -2.9 | -4.8 | -1.9 | 17.7 |
| Morningstar IT European Smaller Companies | -9.2 | -11.2 | -2 | 21.3 |
| Morningstar IT Hedge Funds | -12.3 | -14.5 | -2.1 | 6.5 |
| Morningstar IT Property - Rest of the World | -32.2 | -34.5 | -2.2 | -2.2 |
| Morningstar IT Property - Debt | -10.4 | -12.6 | -2.2 | 2.6 |
| Morningstar IT Europe | -5.6 | -7.8 | -2.3 | 12.7 |
| Morningstar IT Biotechnology & Healthcare | 8.6 | 6.3 | -2.3 | 5.2 |
| Morningstar IT Japan | -0.1 | -3.1 | -3 | 11 |
| Morningstar IT Infrastructure | 15.9 | 12.8 | -3.1 | 2.4 |
| Morningstar IT Renewable Energy Infrastructure | 13.2 | 10 | -3.1 | 1.3 |
| Morningstar IT Japanese Smaller Companies | 3.9 | -2.2 | -6.1 | 2.5 |
| Morningstar IT Global | 4.2 | -3.1 | -7.3 | 33.6 |
| MEDIAN | 0.8 | 11.9 | ||
| AVERAGE | 1.1 | 12.7 |
Source: Morningstar, as at 07/01/2021 – 07/04/2021. Past performance is not a reliable guide to future returns
This coincided with a rise and decline in the fortunes of growth versus value (with SMT emblematic, as noted earlier). Since positive vaccine results were announced in September and October 2020, value has outperformed growth. However, with the exception of some very frothy areas, growth indices and trusts have not performed badly but, rather, failed to keep up. As a result, unfortunately the high-quality growth trusts have not yet fallen out of favour enough to qualify for our portfolio.
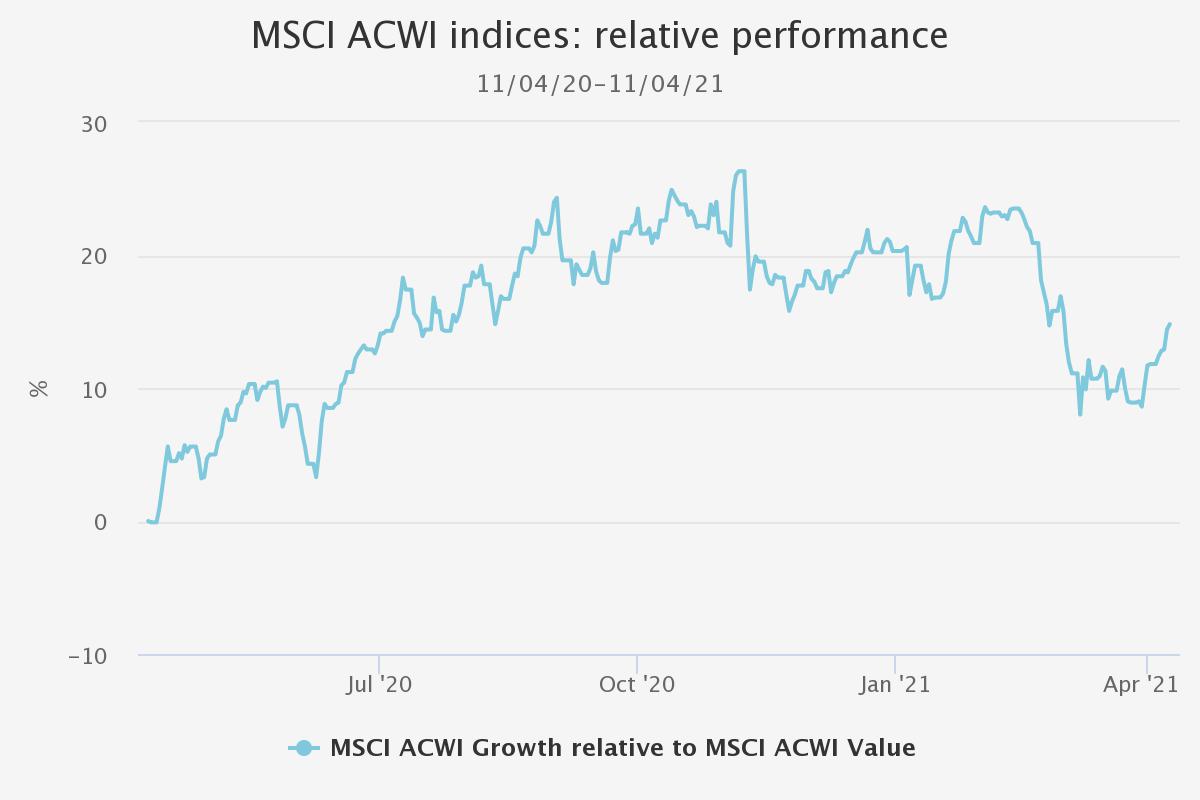
Source: Morningstar. Past performance is not a reliable guide to future returns
The widest discounts on individual trusts continue to be seen in specialist areas which are most obviously threatened by the consequences of the pandemic, or trusts in wind up or otherwise troubled. The aircraft leasing funds, which have seen their business models called into question by the pandemic, have the widest discounts – over 90% in one case.
After various funds in wind-up, and Tetragon Financial Group (LSE:TFG) (which we removed from our list in the last review), Riverstone Energy (LSE:RSE) (a portfolio member) has one of the widest discounts, as does BMO Commercial Property Trust (LSE:BCPT)– although the latter has seen a significant narrowing of the discount from 40% to 34% over this period. We discussed the prospects for BCPT in a recent property sector review.
Performance of discounted opportunities portfolio
Turning to the portfolio of discount opportunities, particularly strong performance was seen from the UK trusts once more. Our relatively recent addition Downing Strategic Micro-Cap (LSE:DSM)has seen good NAV returns over the period (see the table below) compounded by a discount coming in from 21.1% to 11.2%. River and Mercantile UK Micro Cap (LSE:RMMC) saw its discount narrow by almost as much, and now sits at just 7.1% below NAV. When we added RMMC to our portfolio back in February 2019 it was trading on a 13.5% discount. Henderson Opportunities (LSE:HOT) has also seen its discount narrow and it is now almost in single figures – in from over 15% when we added it in 2019. Both have seen very strong NAV returns to back up a narrowing discount as sentiment towards the UK has improved, which could mean it is natural to wonder if the move has run its course. In our view, there is still more to come in terms of catch up in the UK. Sentiment should, in our opinion, continue to improve during the summer as the economy actually opens up and vaccines are shown to work in an open society, as they have in Israel. We believe the UK economy opening up ahead of continental Europe and while the emerging markets are still struggling with the pandemic should give its market impetus.
Discounts and performance of shortlist
| INVESTMENT TRUST | DISCOUNT (CUM FAIR) 07/01/2021 | DISCOUNT (CUM FAIR) 07/04/2021 | DISCOUNT NARROWING | SP TOTAL RETURN (CUMULATIVE) | NAV TOTAL RETURN (CUMULATIVE) |
|---|---|---|---|---|---|
| Downing Strategic Micro-Cap | -21.1 | -11.2 | 9.9 | 21.6 | 9.4 |
| River & Mercantile UK Micro-Cap | -15 | -7.1 | 7.9 | 26.6 | 18.4 |
| Oakley Capital Investments | -28.9 | -25.9 | 3 | 4.6 | 0.6 |
| Henderson Opportunities | -12.5 | -10 | 2.5 | 15.6 | 8.6 |
| Schroder Japan Growth | -12.6 | -10.3 | 2.3 | 5.2 | 3.3 |
| Scottish Oriental Smaller Cos | -13.7 | -11.9 | 1.9 | 3.5 | 2.2 |
| NB Private Equity Partners | -23.8 | -23.9 | -0.1 | 5.7 | 5 |
| Aberdeen Standard Asia Focus | -9.5 | -11.3 | -1.7 | 6.7 | 7.1 |
| Riverstone Energy | -37.5 | -40.4 | -3 | -6.6 | 0 |
| Menhaden | -24 | -27.3 | -3.4 | 0.5 | 6.4 |
| Aberdeen Smaller Cos Income | -11 | -17.6 | -6.5 | -0.9 | 7.2 |
| MEDIAN | 1.9 | 5.2 | 6.4 | ||
| AVERAGE | 1.2 | 7.5 | 6.2 | ||
| FTSE All Share | 2.7 | ||||
| MSCI World | 4.7 |
Source: Morningstar, as at 07/01/2021 – 07/04/2021 Past performance is not a reliable guide to future returns
It is interesting to see Schroder Japan Growth (LSE:SJG)’s discount narrow, too. This is, we would note, the most value-exposed trust in what is typically a growth-dominated sector. Both the Japan and Japanese Smaller Companies sectors have seen their discounts widen over the period, but SJG has bucked the trend. If the global economic picture remains more conducive to value as the developed world comes out of the pandemic, then we think this trend could continue.
The discounts of the private equity trusts are a little more complicated to interpret. Following our last update (data to 07/01/2021), Oakley Capital Investments (LSE:OCI) (OCI) reported a NAV backdated to 31/12/2020 which was up 13% from its NAV last June. This means the real discount was wider than reported at the time of our update, as we highlighted was likely to be the case. Similarly, the current discount of 25% is based off that 31/12/2020 NAV, and so with markets having risen since then it is likely an underestimate. NB Private Equity Partners (LSE:NBPE) publishes its NAV monthly, so there is a less pronounced effect by comparison.
Of those that have seen their discounts widen, Aberdeen Smaller Companies Income (LSE:ASCI) has actually performed well on an NAV basis but the share price has lagged. This may be because investors have been more interested in either high growth or deep value trusts, as this has generally been a period of significant risk appetite. ASCI’s quality growth strategy may have been too conservative for many investors. Its current discount of almost 18% looks very good value, we think, relative to the general picture for UK-focused trusts. Menhaden (LSE:MHN)’s NAV total returns have also been good, with the share price not following, while Riverstone Energy (LSE:RSE) has not reported a NAV.
Portfolio changes and outlook
As a reminder, we have published a target discount level for each of the trusts in this list, whether it be an absolute level or relative to a peer group. Our target for RMMC was the average of the UK Smaller Companies sector. Since it was included in our initial list of ‘discounted opps’ (in February 2019) the discount has roughly halved, coming in from 13.5% to the current 7.1% (it has been as low as 5.5% in the last three months). With the simple average of the sector now at 8.6% (according to JPM Cazenove), RMMC has met our target. It has been a fantastic ride for shareholders since February 2019. The managers have delivered a NAV total return of 54.3% while the shares have risen 65.3% thanks to the narrowing discount. This trounces the returns of the sector, which has generated 35.6% on a weighted average basis and the Numis Smaller Companies ex IT Index, which is up just 29%.
Performance since selection
Source: Morningstar. Past performance is not a reliable guide to future returns
It will be sad to say goodbye to the trust. As a reminder, this list is intended to represent what we see as interesting discount opportunities, where a trust with good NAV prospects has fallen deeply out of favour and where we see the scope for the discount to narrow over time. When we selected RMMC we felt the market was over-reacting to the departure of the previous manager given the new manager had worked closely with him. Furthermore, the opportunity in the micro caps seemed strong and the company structure good. We think RMMC could continue to do well, but it is hard to frame it as a great discount opportunity now! We are being cold and sticking to our price target. HOT and DSM are both on wider discounts and offer a similar exposure to the UK, which we believe will continue to see improving sentiment this year. In the case of HOT, our price target is par, based on the highly geared, cyclically-exposed trust’s performance in past cycles, while DSM still has some way to go to catch up with the sector average. Aside from these UK-focussed trusts, all the others remain some way from our price targets, as the below table indicates.
Old portfolio and price targets
| Sector | Discount (cum fair) 07/04/2021 | Target | |
|---|---|---|---|
| Aberdeen Smaller Companies Inc | AIC UK Smaller Companies | -17.60% | Level with SLS' discount (currently -7.6%) |
| Aberdeen Standard Asia Focus | AIC Asia Pacific Smaller Companies | -11.3 | <5% |
| Downing Strategic Micro-Cap | AIC UK Smaller Companies | -11.2 | Level with UK Smaller Companies sector average (currently -8.6%) |
| Henderson Opportunities | AIC UK All Companies | -10 | Par (we expect this in cyclical rally) |
| Menhaden | AIC Environmental | -27.3 | Level with Global sector average (currently -2.8%) |
| NB Private Equity | AIC Private Equity | -23.9 | <10% |
| Oakley Capital Investments | AIC Private Equity | -25.9 | Level with private equity sector average (currently -11%) |
| River and Mercantile UK Micro Cap | AIC UK Smaller Companies | -7.1 | Level with UK Smaller Companies sector average (currently -8.6%) |
| Riverstone Energy | AIC Commodities & Natural Resources | -40.4 | Par (or wind up) |
| Schroder Japan Growth | AIC Japan | -10.3 | Par |
| Scottish Oriental Smaller Cos | AIC Asia Pacific Smaller Companies | -11.9 | <5% |
Source: Morningstar, Kepler
That deletion takes our list down to 10. After the rally in discounts that we have seen before and since last year’s pandemic crash, and with the universe on a premium of 6.5%, the cupboard is relatively bare in terms of new ideas. We do think the discount on BCPT is too wide, but with so much uncertainty in the property market regarding the long-term future of retail and the fact all the generalist trusts are trading on wide discounts, we find it hard to get conviction on how, when and to where the discount closes. European trusts also look interesting at this point in time in our opinion, with most of them trading on low double-digit discounts and the pace of vaccination starting to pick up in France and Germany. However, we note that, while there may be a relief rally in the short term, these sectors have tended to trade on quite wide discounts in recent years, so the upside to the discount – the point of this shortlist – may be relatively muted.
The one addition we are making is CC Japan Income & Growth (LSE:CCJI). We selected SJG on the basis that its style was deeply out of favour and when the stylistic preference for growth versus value reversed it could do very well on both a NAV and share price basis. We still believe this to be true, but currently CCJI offers an even better opportunity. It is trading on a 12.9% discount, and has outperformed SJG in the reflationary rally. It also has c. 20% of gearing, which should see the NAV respond well as and when risk appetite returns in Japan. Meanwhile it offers a 3.3% yield from a market which generally offers little. Finally, the corporate governance reform which we have discussed many times is highly supportive for a dividend strategy such as this. CCJI traded on a premium prior to the coronavirus pandemic.
New portfolio and price targets
| Sector | Discount (cum fair) 07/04/2021 | Target | |
|---|---|---|---|
| Aberdeen Smaller Companies Inc | AIC UK Smaller Companies | -17.60% | Level with SLS' discount (currently -7.6%) |
| Aberdeen Standard Asia Focus | AIC Asia Pacific Smaller Companies | -11.30% | <5% |
| CC Japan Income & Growth | AIC Japan | -12.10% | Par |
| Downing Strategic Micro-Cap | AIC UK Smaller Companies | -11.2 | Level with UK Smaller Companies sector average (currently -8.6%) |
| Henderson Opportunities | AIC UK All Companies | -10 | Par (we expect this in cyclical rally) |
| Menhaden | AIC Environmental | -27.3 | Level with Global sector average (currently -2.8%) |
| NB Private Equity | AIC Private Equity | -23.9 | <10% |
| Oakley Capital Investments | AIC Private Equity | -25.9 | Level with private equity sector average (currently -11%) |
| Riverstone Energy | AIC Commodities & Natural Resources | -40.4 | Par (or wind up) |
| Schroder Japan Growth | AIC Japan | -10.3 | Par |
| Scottish Oriental Smaller Cos | AIC Asia Pacific Smaller Companies | -11.9 | <5% |
Source: Morningstar, Kepler
Kepler Partners is a third-party supplier and not part of interactive investor. Neither Kepler Partners or interactive investor will be responsible for any losses that may be incurred as a result of a trading idea.
These articles are provided for information purposes only. Occasionally, an opinion about whether to buy or sell a specific investment may be provided by third parties. The content is not intended to be a personal recommendation to buy or sell any financial instrument or product, or to adopt any investment strategy as it is not provided based on an assessment of your investing knowledge and experience, your financial situation or your investment objectives. The value of your investments, and the income derived from them, may go down as well as up. You may not get back all the money that you invest. The investments referred to in this article may not be suitable for all investors, and if in doubt, an investor should seek advice from a qualified investment adviser.
Full performance can be found on the company or index summary page on the interactive investor website. Simply click on the company's or index name highlighted in the article.
Important Information
Kepler Partners is not authorised to make recommendations to Retail Clients. This report is based on factual information only, and is solely for information purposes only and any views contained in it must not be construed as investment or tax advice or a recommendation to buy, sell or take any action in relation to any investment.
This report has been issued by Kepler Partners LLP solely for information purposes only and the views contained in it must not be construed as investment or tax advice or a recommendation to buy, sell or take any action in relation to any investment. If you are unclear about any of the information on this website or its suitability for you, please contact your financial or tax adviser, or an independent financial or tax adviser before making any investment or financial decisions.
The information provided on this website is not intended for distribution to, or use by, any person or entity in any jurisdiction or country where such distribution or use would be contrary to law or regulation or which would subject Kepler Partners LLP to any registration requirement within such jurisdiction or country. Persons who access this information are required to inform themselves and to comply with any such restrictions. In particular, this website is exclusively for non-US Persons. The information in this website is not for distribution to and does not constitute an offer to sell or the solicitation of any offer to buy any securities in the United States of America to or for the benefit of US Persons.
This is a marketing document, should be considered non-independent research and is subject to the rules in COBS 12.3 relating to such research. It has not been prepared in accordance with legal requirements designed to promote the independence of investment research.
No representation or warranty, express or implied, is given by any person as to the accuracy or completeness of the information and no responsibility or liability is accepted for the accuracy or sufficiency of any of the information, for any errors, omissions or misstatements, negligent or otherwise. Any views and opinions, whilst given in good faith, are subject to change without notice.
This is not an official confirmation of terms and is not to be taken as advice to take any action in relation to any investment mentioned herein. Any prices or quotations contained herein are indicative only.
Kepler Partners LLP (including its partners, employees and representatives) or a connected person may have positions in or options on the securities detailed in this report, and may buy, sell or offer to purchase or sell such securities from time to time, but will at all times be subject to restrictions imposed by the firm's internal rules. A copy of the firm's conflict of interest policy is available on request.
Past performance is not necessarily a guide to the future. The value of investments can fall as well as rise and you may get back less than you invested when you decide to sell your investments. It is strongly recommended that Independent financial advice should be taken before entering into any financial transaction.
PLEASE SEE ALSO OUR TERMS AND CONDITIONS
Kepler Partners LLP is a limited liability partnership registered in England and Wales at 9/10 Savile Row, London W1S 3PF with registered number OC334771.
Kepler Partners LLP is authorised and regulated by the Financial Conduct Authority.