eyeQ: a tale of two stocks – which is the better bet?
Experts at eyeQ have used AI and their own smart machine to analyse macro conditions and generate actionable trading signals. Here, they examine a company due to update the market tomorrow, and another in the same sector
14th January 2026 09:51
by Huw Roberts from interactive investor

“Our signals are crafted through macro-valuation, trend analysis, and meticulous back-testing. This combination ensures a comprehensive evaluation of an asset's value, market conditions, and historical performance.” eyeQ
- Discover: eyeQ analysis explained | eyeQ: our smart machine in action | Glossary
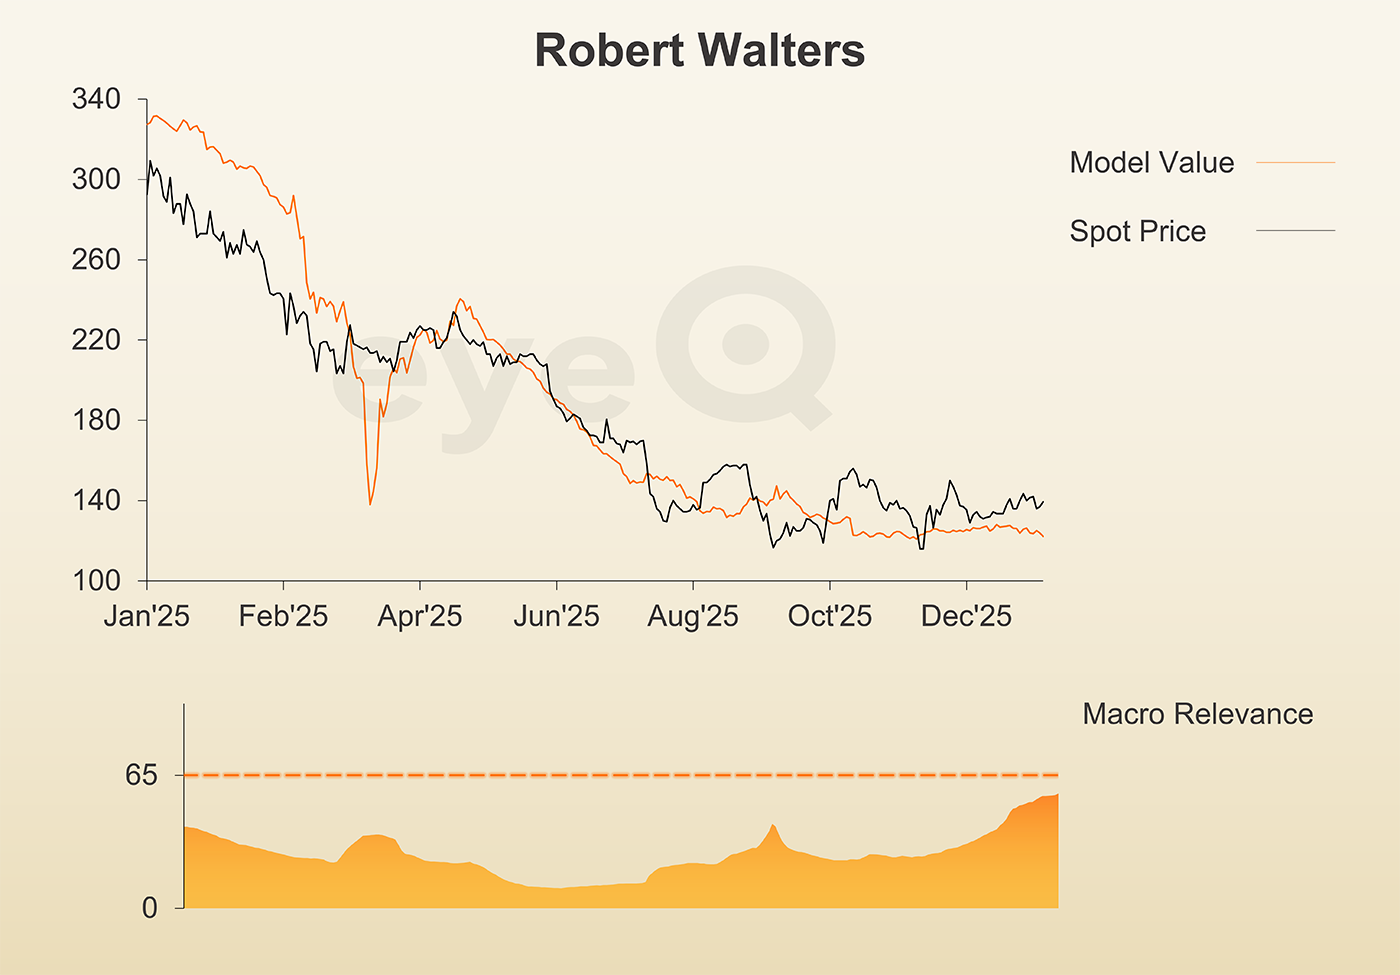
Robert Walters
Macro Relevance: 56%
Model Value: 121.74p
Fair Value Gap: +14.87% premium to model value
Data correct as at 14 January 2026. Please click glossary for explanation of terms. Long-term strategic model.
Yesterday eyeQ flagged PageGroup (LSE:PAGE) as a proxy gauge for the health of the UK labour market. Tomorrow, fellow recruiter Robert Walters (LSE:RWA) provides a trading update and it’s interesting to compare and contrast the two stocks.
First the similarities. Neither model has a macro relevance score greater than 65% - that means company fundamentals matter more than big-picture macro dynamics.
Both model values fell aggressively over the first half of 2025 and have subsequently been flatlining. Put another way, macro conditions worsened dramatically between January and the summer; after that things stopped getting worse, but there’s no definitive signs of any improvement yet.
But there are two subtle but important differences between PAGE & RWA. On eyeQ, PageGroup model value is, at the margin, trying to turn higher; RWA model value is down 3% in the last month. The current macro mix appears to favour Page over Robert Walters.
And then there’s the difference in macro valuations. While Page is cheap to macro, the opposite is true for Robert Walters. The stock has bounced 2.5% so far in 2026. That move isn’t justified by macro and has opened up a fair value gap of almost 15%.
That’s not enough to trigger a bearish signal; plus low macro relevance forbids an official signal. There may be good company reasons for this divergence between the two stocks - tomorrow’s update will need careful studying.
But, from a pure macro perspective, the risk-reward favours PAGE over RWA.
Source: eyeQ. Past performance is not a guide to future performance.
Useful terminology:
Model value
Where our smart machine calculates that any stock market index, single stock or exchange-traded fund (ETF) should be priced (the fair value) given the overall macroeconomic environment.
Model (macro) relevance
How confident we are in the model value. The higher the number the better! Above 65% means the macro environment is critical, so any valuation signals carry strong weight. Below 65%, we deem that something other than macro is driving the price.
Fair Value Gap (FVG)
The difference between our model value (fair value) and where the price currently is. A positive Fair Value Gap means the security is above the model value, which we refer to as “rich”. A negative FVG means that it's cheap. The bigger the FVG, the bigger the dislocation and therefore a better entry level for trades.
Long Term model
This model looks at share prices over the last 12 months, captures the company’s relationship with growth, inflation, currency shifts, central bank policy etc and calculates our key results - model value, model relevance, Fair Value Gap.
These third-party research articles are provided by eyeQ (Quant Insight). interactive investor does not make any representation as to the completeness, accuracy or timeliness of the information provided, nor do we accept any liability for any losses, costs, liabilities or expenses that may arise directly or indirectly from your use of, or reliance on, the information (except where we have acted negligently, fraudulently or in wilful default in relation to the production or distribution of the information).
The value of your investments may go down as well as up. You may not get back all the money that you invest.
Equity research is provided for information purposes only. Neither eyeQ (Quant Insight) nor interactive investor have considered your personal circumstances, and the information provided should not be considered a personal recommendation. If you are in any doubt as to the action you should take, please consult an authorised financial adviser.
Disclosure
We use a combination of fundamental and technical analysis in forming our view as to the valuation and prospects of an investment. Where relevant we have set out those particular matters we think are important in the above article, but further detail can be found here.
Please note that our article on this investment should not be considered to be a regular publication.
Details of all recommendations issued by ii during the previous 12-month period can be found here.
ii adheres to a strict code of conduct. Contributors may hold shares or have other interests in companies included in these portfolios, which could create a conflict of interests. Contributors intending to write about any financial instruments in which they have an interest are required to disclose such interest to ii and in the article itself. ii will at all times consider whether such interest impairs the objectivity of the recommendation.
In addition, individuals involved in the production of investment articles are subject to a personal account dealing restriction, which prevents them from placing a transaction in the specified instrument(s) for a period before and for five working days after such publication. This is to avoid personal interests conflicting with the interests of the recipients of those investment articles.