Five opportunities in the small-cap trust space
12th August 2022 13:57
Attractive discounts in this UK investment trust sector offer investors with a long time horizon a good entry point.

This content is provided by Kepler Trust Intelligence, an investment trust focused website for private and professional investors. Kepler Trust Intelligence is a third-party supplier and not part of interactive investor. It is provided for information only and does not constitute a personal recommendation.
Material produced by Kepler Trust Intelligence should be considered a marketing communication, and is not independent research.
The sell-off over the past year has seen many investments trusts trade at substantial discounts to NAV. Discounts have widened markedly in the small-cap and mid-cap space, leading to some potential opportunities for investors to exploit.
What has happened to discounts?
Over the past 12 months (to 04/08/2022), the FTSE 100 has held up well versus international peers, with the UK Smaller Companies’ indices and investment trust indices underperforming disproportionately. The FTSE has been driven by the outperformance of the oil and gas majors, as well as by its pronounced value tilt.
Global indices performance over 12 months
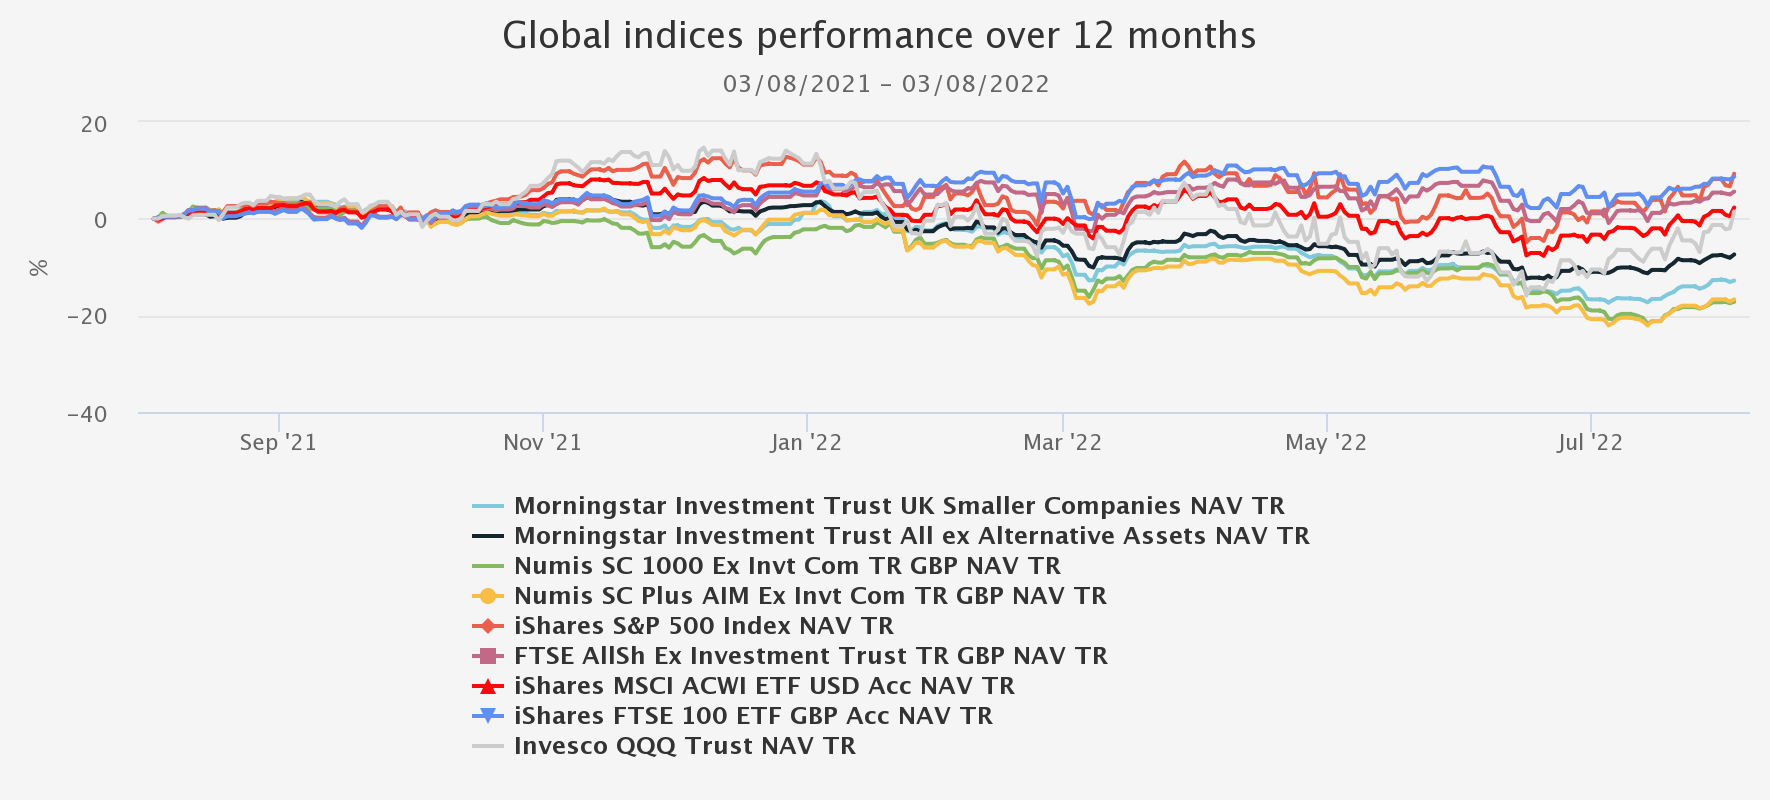
Source: Morningstar. Past performance is not a reliable indicator of future results
This has been reflected in the relative discounts of the sector. As the below graph shows, the UK All Companies has traded on narrower discount than the UK Smaller Companies sector. In fact, as at 05/08/2022, the UK Small Cap sector is trading on a discount significantly wider than the five-year average of -8.9%, a circa 1 standard deviation move away from it.
Sector discounts over 12 months
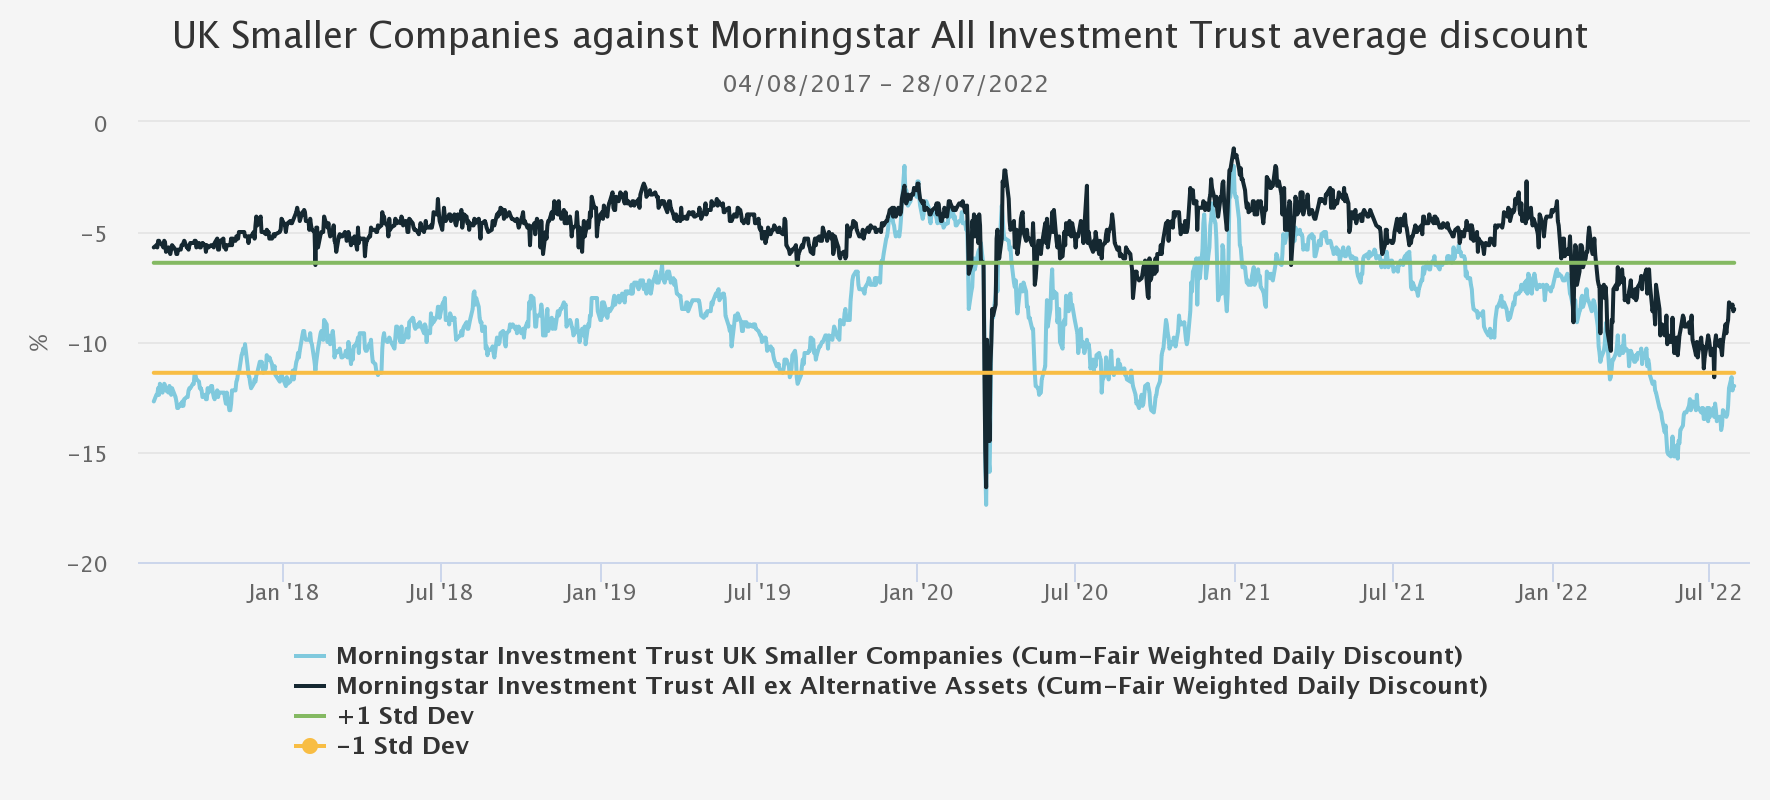
Source: Morningstar
Oil and gas and mining in particular provide global revenue streams, as well as dollar revenue streams. These factors have supported the FTSE 100 and the large-cap trusts and have helped create good cash flow to back dividends in UK equity income funds. The small caps, however, don’t benefit from these factors and are generally more driven by the domestic economy. According to research by FTSE Russell and a separate study by the London Business School, circa 76% of FTSE 100 revenues come from outside the UK versus circa 51% for the FTSE 250 and circa 43% for the FTSE SmallCap Index.
A domestic focus was helpful in 2021 as the UK recovered from the pandemic, with the UK Smaller Companies sector generating a return of circa 48% over this period. In the main, we think the UK handled the impact of the pandemic relatively well with a successful vaccine programme, a more flexible lockdown protocol alongside the further easing of monetary conditions and fiscal benefits provided by the government. Another major concern for investors has been the uncertainty around the finalisation of the Brexit deal, and although there are some details yet to be settled, the impacts of Brexit have been less severe than some expected.
Since Q4 2021, various factors have contributed to a broad equity market sell-off, which has particularly impacted strategies focused on smaller companies. The FTSE 250 is down 15.6% in total return terms and as we go further down the market cap spectrum, we see an even greater decline in performance with the NUMIS Smaller Companies plus AIM Ex. Its Index generating a loss of 17.7% year-to-date, as at 04/08/2022.
In light of this, we have also seen a significant de-rating across the UK Smaller Companies Investment Trust Sector. The average discount in the sector has widened out to -11.3% compared to a -2.8% average for the UK Equity Income sector, for example, and close to the levels seen at the height of the pandemic. As at 28/07/2022, there are 16 trusts out of the 24 in the UK Smaller Companies sector trading at below their three-year average discount/premium value and we will touch on some examples later in this article. So, is the sector oversold?
What has happened with the NAVs?
Year-to-date, the Morningstar UK Smaller Companies sector has delivered an average NAV total return of -12.5%, as at 05/08/2022. The table below illustrates the performance of UK Smaller Companies trusts year-to-date.
Some of the growthier-focused trusts have performed exceptionally well over the longer term but have suffered since the start of 2022. One example is BlackRock Throgmorton Trust (LSE:THRG), which as at 28/07/2022 is down circa 35% in share price total returns over the past 12 months. In addition, of the more micro-cap focused trusts), Miton UK Microcap (LSE:MINI) is currently down circa 25% over the same period.
On a NAV total returns basis Downing Strategic Micro-Cap (LSE:DSM) has maintained the strongest performance in the sector maintaining a flat year-to-date performance of -2.4%– an admirable achievement given the market turmoil. In addition, Aberforth Smaller Companies (LSE:ASL) and Invesco Perpetual UK Smaller Companies (LSE:IPU)have also performed relatively well in the space: the former has struggled in recent years, however the managers have stuck to their guns and maintained a disciplined value approach.
Year-to-date performance
Source: Morningstar. Past performance is not a reliable indicator of future results
What is the outlook for NAVs?
The UK market has been unloved for many years – at least since 2016. When looking at the data, relative valuations still look attractive for the major UK indices such as the FTSE 100 and 250 versus their international peers. However, using the IA sectors to compare international small-cap markets, we see the UK Smaller Companies sector’s average P/E ratio doesn’t look outstanding value versus international peers with a value of 16.4x versus the North American Smaller Companies at 17.1x, European Smaller Companies 13.8x and Japanese Smaller Companies 13.6x.
Equity returns are driven by multiple changes and underlying earnings. While the prospects for earnings growth are obviously hindered by the recession most expect, we believe there are lots of interesting companies in the UK. We note that many of the trusts within the sector have de-levered significantly, which reflects some caution.
For example, JPMorgan UK Smaller Companies (LSE:JMI) andTHRG have net cash levels in their portfolios of circa 9% and circa 7% respectively. Many of the smaller-cap managers, although seeking to generate capital growth over the long term, aim to ensure that their companies are high quality but also trading at the right price. Many will seek to invest in those companies that are undervalued but are able to generate positive cash flow early on in order to invest into company growth. We think those that are less dependent on external forms of financing may prove more resilient than they are currently being given credit for.
Some managers see lots of opportunity in the current market. MINI’s managers Gervais Williams and Martin Turner believe we are entering an inflection point. In short, they believe the era of ‘cheap’ credit availability and globalisation that has acted as an advantage to big business will prove unsustainable in light of elevated levels of geopolitical tensions, supply-chain constraints and persistent inflation. As interest rates continue to rise, this will increase the costs of long-duration assets along with increased pricing competition, which will impact balance sheets and profit margins. This is likely to benefit smaller, more domestically focused companies that haven’t experienced such stretched valuations as seen in international markets and may be more nimble from an operational perspective.
However, investors may still remain reluctant to allocate capital into the UK at this time. From a monetary standpoint, we note that the Bank of England has instigated the biggest single rate rise in more than 25 years, raising the base rate by 50 basis points to 1.75%. With this came stark warnings around the increased ‘possibility’ of a recession, which is likely to persist for much of 2023, alongside revised inflationary forecasts expecting inflation to peak at 13% before showing any signs of slowing. This is likely to put pressure on already historically low levels of consumer confidence, which look set to remain persistent along with the diminishing savings buffers that were built up during the pandemic (the household savings ratio was back down from a peak of 24% to 6.8% in Q1 2022 (Source: ONS)), this may prove difficult for the more domestically focused smaller companies in the medium term.
In addition, investing in smaller companies is inherently more volatile compared to a large-cap focused strategy as demonstrated by the three-year annualised standard deviation levels and the three-year maximum drawdowns of the Numis Smaller Companies plus AIM Ex. ITs Index versus the FTSE 100 in the table below. Interestingly, when we compare the UK Smaller Companies Investment Trust sector versus the IA UK Smaller Companies sector (open-ended funds) we can see some evidence of the superiority of the closed-ended structure. The statistics indicate a significantly less volatile sector with lower drawdowns and a reduced downside capture ratio.
Relative risk versus return
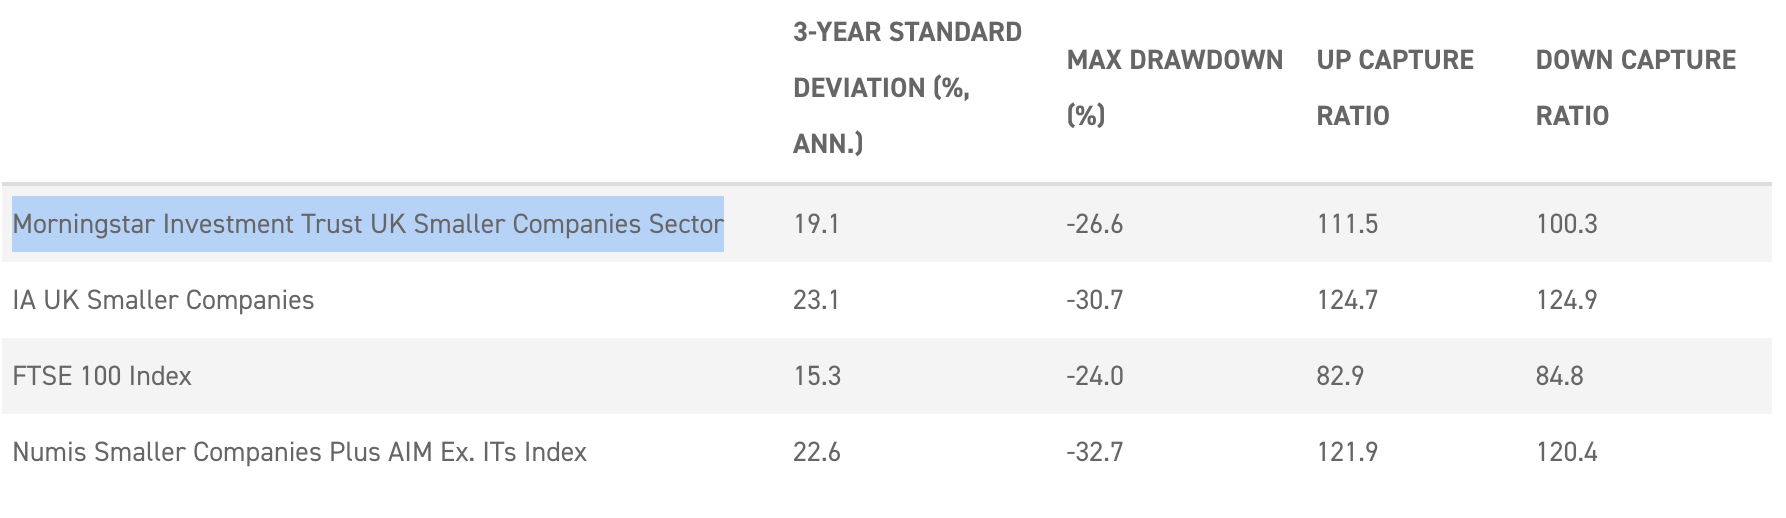
Source: Morningstar. Past performance is not a reliable indicator of future results
Conclusion: where are the opportunities?
We are wary of trying to call the bottom of the market; however, we do believe that as in many bear market scenarios the sell-offs can be overdone, leaving a selection of opportunities for investors to participate in the rally. In a previous article, ‘Five small cup trusts on very wide discounts’, we highlight the outperformance of the Numis Smaller Companies Index versus the FTSE All-Share Index following recessionary time periods in the past. While the pattern may not hold, we think there may be an opportunity for investors to allocate into the diversified offerings the UK Smaller Companies space can offer.
The table below displays some potential opportunities for investors to exploit the current discount levels. When looking at the Z-scores across the UK small-cap sector we get some indication of how far the discounts have moved beyond the trusts’ historical mean discount. We highlight a few opportunities below.
UK smaller companies trusts discounts as at 29/07/2022
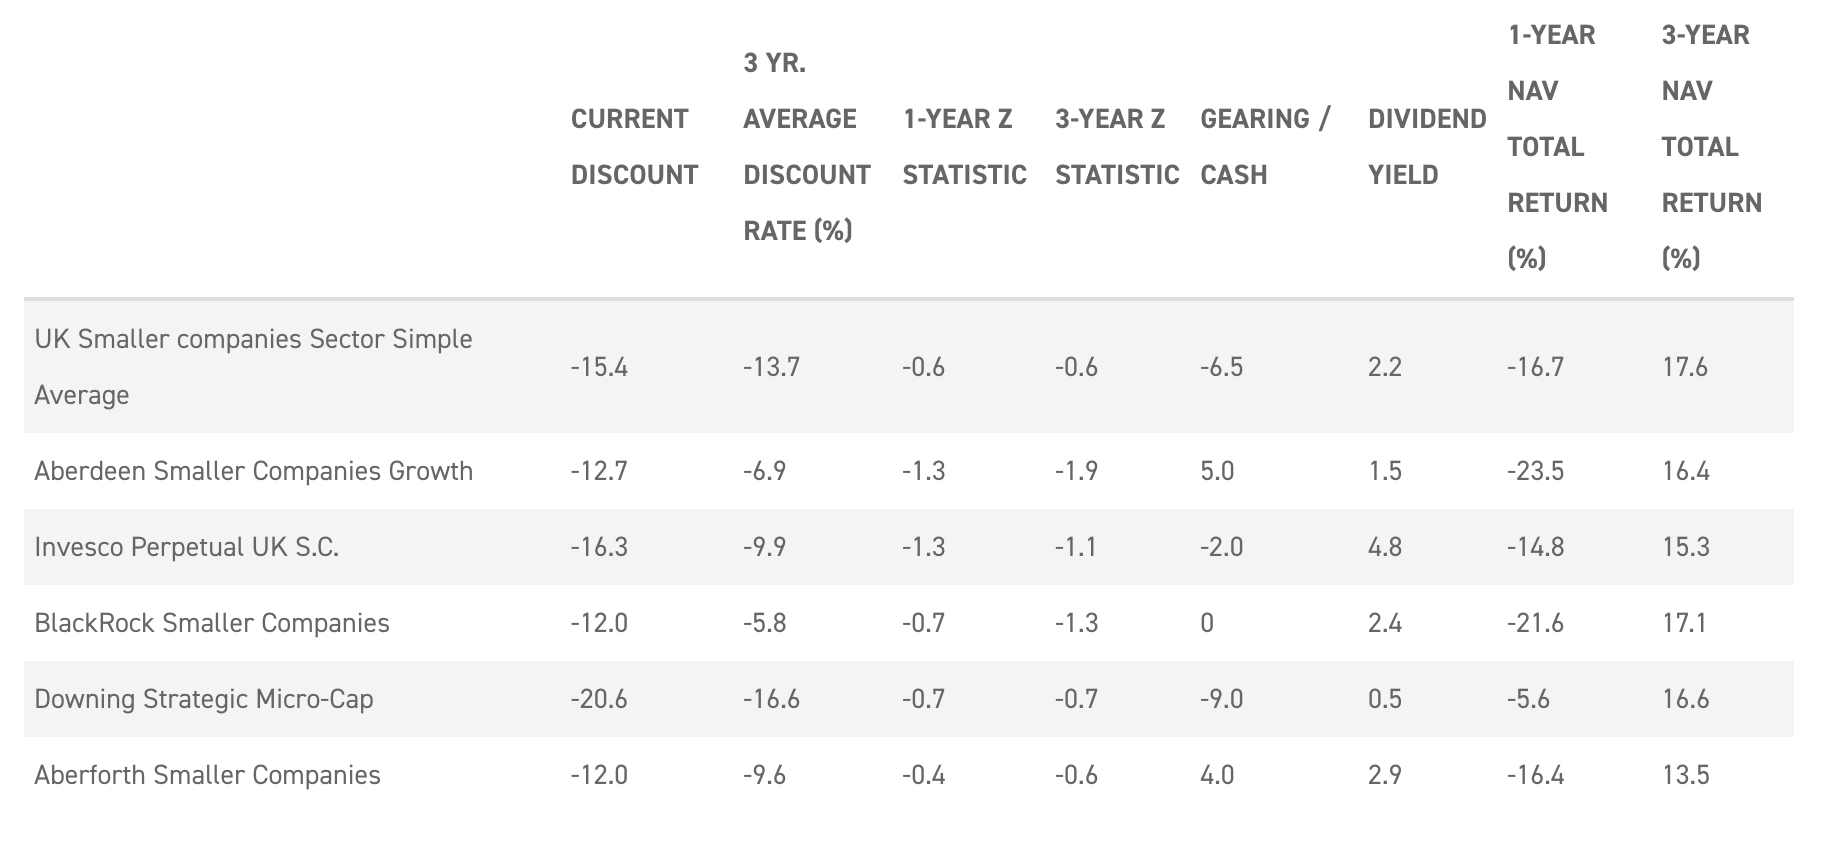
Source: Morningstar, JPMorgan Cazenove, Kepler calculations. Past performance is not a reliable indicator of future results.
Aberforth Smaller Companies (LSE:ASL) is a dedicated value strategy, which is hard to come by in the UK small-cap space. The managers’ investment strategy aims to exploit undervalued companies they believe are likely to outperform those more expensive peers. ASL did particularly well in the reflationary rally following the emergence of vaccines for Covid-19, when value outperformed strongly. ASL has also outperformed its sector and benchmark year-to-date, albeit during a falling market. Value typically outperforms growth in a rising interest rate environment and given the stickiness of inflation, we think rate hikes are likely to continue. Over the past month, we have seen the discount widen somewhat, but we have also seen what can be achieved when the market favours such a value-focused strategy. While ASL still trades at a -13.4% discount, wider than its three-year average of -9.7%, this may provide a good long-term entry point.
Invesco Perpetual UK Smaller Companies (LSE:IPU) is on a wide discount of -15.7%, which is significantly wider than the trust’s one, three and five-year averages. The managers Jonathan Brown and Robin West are focused on identifying high-quality companies while also remaining valuation aware. This barbell approach is central to the portfolio’s construction and leaves it capable of performing across varied market conditions. At the same time, the valuation-led stock-picking leads to a strong sell discipline as the managers look to recycle capital from strong performers into better value opportunities. The trust has experienced a strong record of performance and has generated a NAV total return of circa 29.2% over five years. This has been combined with relatively low levels of NAV volatility, which when compared to peers, is testament to the consistent focus on ‘quality’ throughout the investment process. A bonus is the attractive dividend and therefore yield premium offered by IPU. With the board’s policy to pay out all income earned from the portfolio and to enhance it annually through the use of realised capital profits with a target dividend yield of 4% (currently circa 4.8%) of the financial year-end (31 January), the share price is attractive when compared to the peer groups average yield of 2.4%.
As mentioned earlier, Downing Strategic Micro-Cap (LSE:DSM) has been the top-performing trust in the sector over a 12-month period and year-to-date from a NAV total returns perspective, but what is surprising is that this has not translated into share price performance. DSM’s discount has been trending lower since the start of the year, with it currently at -21.2% which is significantly below its five-year average of -9.9% but is also a wide discount in absolute terms. This in itself is unusual because the trust traded at a premium in the first two years following its IPO, albeit trending lower over this period, before widening significantly during the market volatility in 2020. It is yet to fully recover and with a three-year average discount of -16.5% this has remained a feature of the trust more recently.
Up until now the board has been reluctant to actively buy back shares with the chair – in our view, rightly – stating there was “no point in trying to stand against the tide” during the height of the coronavirus pandemic. The highly concentrated portfolio that ranges between 10-25 holdings, investing in the riskiest area of the small-cap universe, namely micro-caps, meant the board wanted to ensure liquidity was maintained.
However, the persistency of the discount has led DSM’s board to buy back shares regularly at wide discount levels with the latest purchased at an average discount of 17% in May 2022. In its most recent annual report, the board provided clarity around the plans for an investor redemption opportunity in May 2024, enabling shareholders to redeem or have a matched sale for up to 50% of their holding. For these reasons along with the uniqueness of the managers’ investment philosophy in the smaller companies’ space, we believe DSM may provide investors with an opportunity to diversify their current portfolio with the wide discount, and that the likely continued share buybacks will be accretive to shareholders.
Kepler Partners is a third-party supplier and not part of interactive investor. Neither Kepler Partners or interactive investor will be responsible for any losses that may be incurred as a result of a trading idea.
These articles are provided for information purposes only. Occasionally, an opinion about whether to buy or sell a specific investment may be provided by third parties. The content is not intended to be a personal recommendation to buy or sell any financial instrument or product, or to adopt any investment strategy as it is not provided based on an assessment of your investing knowledge and experience, your financial situation or your investment objectives. The value of your investments, and the income derived from them, may go down as well as up. You may not get back all the money that you invest. The investments referred to in this article may not be suitable for all investors, and if in doubt, an investor should seek advice from a qualified investment adviser.
Full performance can be found on the company or index summary page on the interactive investor website. Simply click on the company's or index name highlighted in the article.
Important Information
Kepler Partners is not authorised to make recommendations to Retail Clients. This report is based on factual information only, and is solely for information purposes only and any views contained in it must not be construed as investment or tax advice or a recommendation to buy, sell or take any action in relation to any investment.
This report has been issued by Kepler Partners LLP solely for information purposes only and the views contained in it must not be construed as investment or tax advice or a recommendation to buy, sell or take any action in relation to any investment. If you are unclear about any of the information on this website or its suitability for you, please contact your financial or tax adviser, or an independent financial or tax adviser before making any investment or financial decisions.
The information provided on this website is not intended for distribution to, or use by, any person or entity in any jurisdiction or country where such distribution or use would be contrary to law or regulation or which would subject Kepler Partners LLP to any registration requirement within such jurisdiction or country. Persons who access this information are required to inform themselves and to comply with any such restrictions. In particular, this website is exclusively for non-US Persons. The information in this website is not for distribution to and does not constitute an offer to sell or the solicitation of any offer to buy any securities in the United States of America to or for the benefit of US Persons.
This is a marketing document, should be considered non-independent research and is subject to the rules in COBS 12.3 relating to such research. It has not been prepared in accordance with legal requirements designed to promote the independence of investment research.
No representation or warranty, express or implied, is given by any person as to the accuracy or completeness of the information and no responsibility or liability is accepted for the accuracy or sufficiency of any of the information, for any errors, omissions or misstatements, negligent or otherwise. Any views and opinions, whilst given in good faith, are subject to change without notice.
This is not an official confirmation of terms and is not to be taken as advice to take any action in relation to any investment mentioned herein. Any prices or quotations contained herein are indicative only.
Kepler Partners LLP (including its partners, employees and representatives) or a connected person may have positions in or options on the securities detailed in this report, and may buy, sell or offer to purchase or sell such securities from time to time, but will at all times be subject to restrictions imposed by the firm's internal rules. A copy of the firm's conflict of interest policy is available on request.
Past performance is not necessarily a guide to the future. The value of investments can fall as well as rise and you may get back less than you invested when you decide to sell your investments. It is strongly recommended that Independent financial advice should be taken before entering into any financial transaction.
PLEASE SEE ALSO OUR TERMS AND CONDITIONS
Kepler Partners LLP is a limited liability partnership registered in England and Wales at 9/10 Savile Row, London W1S 3PF with registered number OC334771.
Kepler Partners LLP is authorised and regulated by the Financial Conduct Authority.