FTSE 100 hits record high as Santa rally continues
Six weeks after achieving its previous best, the UK blue-chip index managed another all-time high on the final full trading day of 2025.
30th December 2025 16:54
by Lee Wild from interactive investor

The index of Britain’s biggest companies continued its Christmas rally on Tuesday, the last full trading day of the calendar year, racing closer to the magic 10,000 level.
- Invest with ii: SIPP Account | Stocks & Shares ISA | See all Investment Accounts
With the London Stock Exchange shutting at 12:30 on New Year’s Eve, and many investors likely to pack up early in time for the celebrations, for many this was the final chance to beef up their portfolios in 2025.
The FTSE 100 closed at 9,649 on Friday 12 December and at lunchtime today reached a new peak of 9,931.26, just exceeding the previous best of 9,930.09.
But despite a disappointing open on Wall Street, the FTSE 100 found an extra gear mid-afternoon, trading up 88 points, or 0.88%, at 9,954.32. That puts the rally since 12 December at 3.2%.
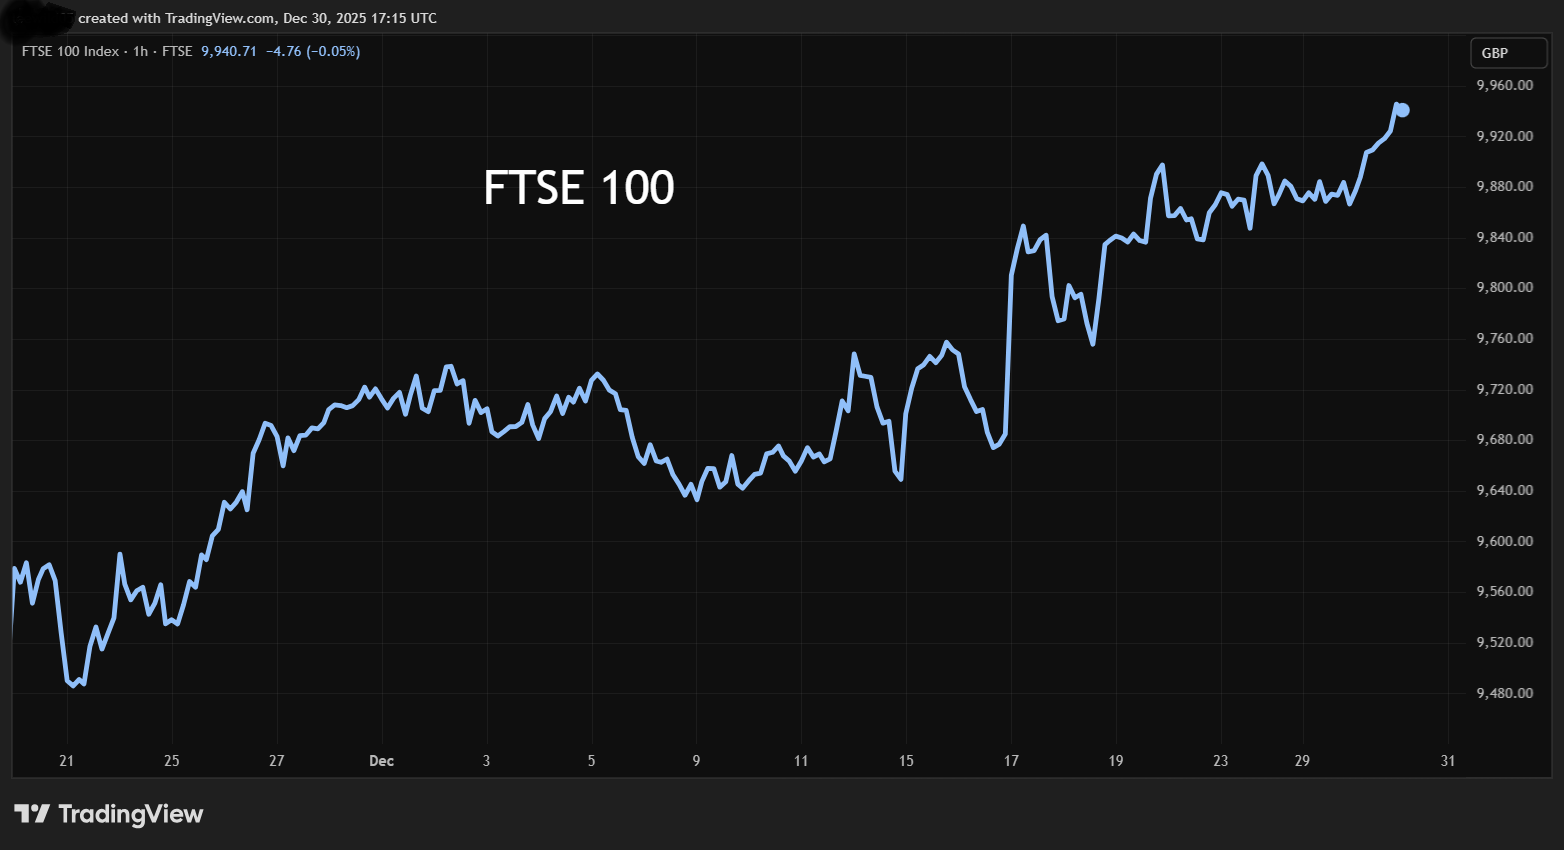
Source: TradingView. Past performance is not a guide to future performance.
If you take the rally back to the 9,423 low of 21 November, gains calculate at 530 points, or 5.6%. And today’s jump extends FTSE 100 gains for 2025 to 21.7%.
That compares with returns of 17.5% for the S&P 500, 21.7% for the Nasdaq Composite tech index and 33.4% for Brazil, the best performing major index of the year.
- Investment outlook: expert opinion, analysis and ideas
- Stockwatch: is value investing the best strategy in 2026?
- Special: 10 hottest ISA shares, funds and trusts in 2025
Stocks leading the Santa rally
Company | Price | Share price since close on 12 Dec 2025 (%) | Share price since close on 21 Nov 2025 (%) | Share price in 2025 (%) | Forward dividend yield (%) | Forward PE ratio | |
1 | 3412p | 17.5 | 49.0 | 449.0 | 1.9 | 28.5 | |
2 | 355.4p | 15.8 | 16.5 | 213.0 | 1.5 | 29.6 | |
3 | 3316p | 13.1 | 28.7 | 109.0 | 1.0 | 40.4 | |
4 | 3902p | 10.3 | 23.4 | 174.0 | 2.4 | 15.4 | |
5 | 737.5p | 9.0 | 11.7 | 44.6 | 7.5 | 14.4 | |
6 | 2555p | 8.8 | -7.9 | -13.3 | 3.9 | 12.9 | |
7 | 3056p | 8.5 | 12.8 | 29.3 | 0.6 | 54.6 | |
8 | 406.5p | 8.3 | 21.3 | 15.0 | 1.9 | 29.9 | |
9 | 6026p | 7.8 | 13.5 | 27.6 | 4.6 | 12.8 | |
10 | 624.5p | 7.5 | 6.0 | 6.9 | 6.6 | 12.2 |
Source: ShareScope
These articles are provided for information purposes only. Occasionally, an opinion about whether to buy or sell a specific investment may be provided by third parties. The content is not intended to be a personal recommendation to buy or sell any financial instrument or product, or to adopt any investment strategy as it is not provided based on an assessment of your investing knowledge and experience, your financial situation or your investment objectives. The value of your investments, and the income derived from them, may go down as well as up. You may not get back all the money that you invest. The investments referred to in this article may not be suitable for all investors, and if in doubt, an investor should seek advice from a qualified investment adviser.
Full performance can be found on the company or index summary page on the interactive investor website. Simply click on the company's or index name highlighted in the article.