Stockwatch: is value investing the best strategy in 2026?
As well as substantial gains in 2025, there have been worthwhile lessons learned, prompting analyst Edmond Jackson to consider the case for value investors in the year ahead.
30th December 2025 09:36
by Edmond Jackson from interactive investor

In my last article I concerned myself with key macro influences such as US tariffs and a scarcity of high-calibre flotations in the UK. As uncertainties have grown, investors have prized listed companies that can beat expectations, which has particularly boosted US big tech firms.
- Invest with ii: SIPP Account | Stocks & Shares ISA | See all Investment Accounts
Lest the growth party strikes midnight, however, a balanced portfolio would include classic “value” shares; companies with strong market positions but experiencing current challenges, hence their shares lacking growth appeal. It typically means low price/earnings (PE) multiples and pricing for a material yield to attract income investors.
The risk is that inherent problems mean profit warnings and a risk that investors are regularly tempted to average down. Chartists would say buy a rising, not falling, trend. A compromise is to wait for a bottoming out and new uptrend to begin.
Stock markets have just lately celebrated interest rate cuts, albeit in response to weak data from both countries. But if the US and UK economies were to turn down, industrial cyclical and consumer shares would suffer.
Fears over the macro outlook were significantly why UK bank shares fell so low, although over the past two years they have enjoyed big re-ratings, for example, Barclays (LSE:BARC), Lloyds Banking Group (LSE:LLOY) and NatWest Group (LSE:NWG), also so-called challenger banks such as Metro Bank Holdings (LSE:MTRO) and Paragon Banking Group (LSE:PAG), which I have favoured.
It can be useful therefore to draw on lessons with “value”-type shares as part of 2026 portfolio planning and investment tactics.
Healthcare: GSK maintains overall sideways-volatile trend
In times of uncertainty, healthcare tends to be seen as defensive given the demographics of an ageing population, and also medical advances that are able to spur drug company revenues.
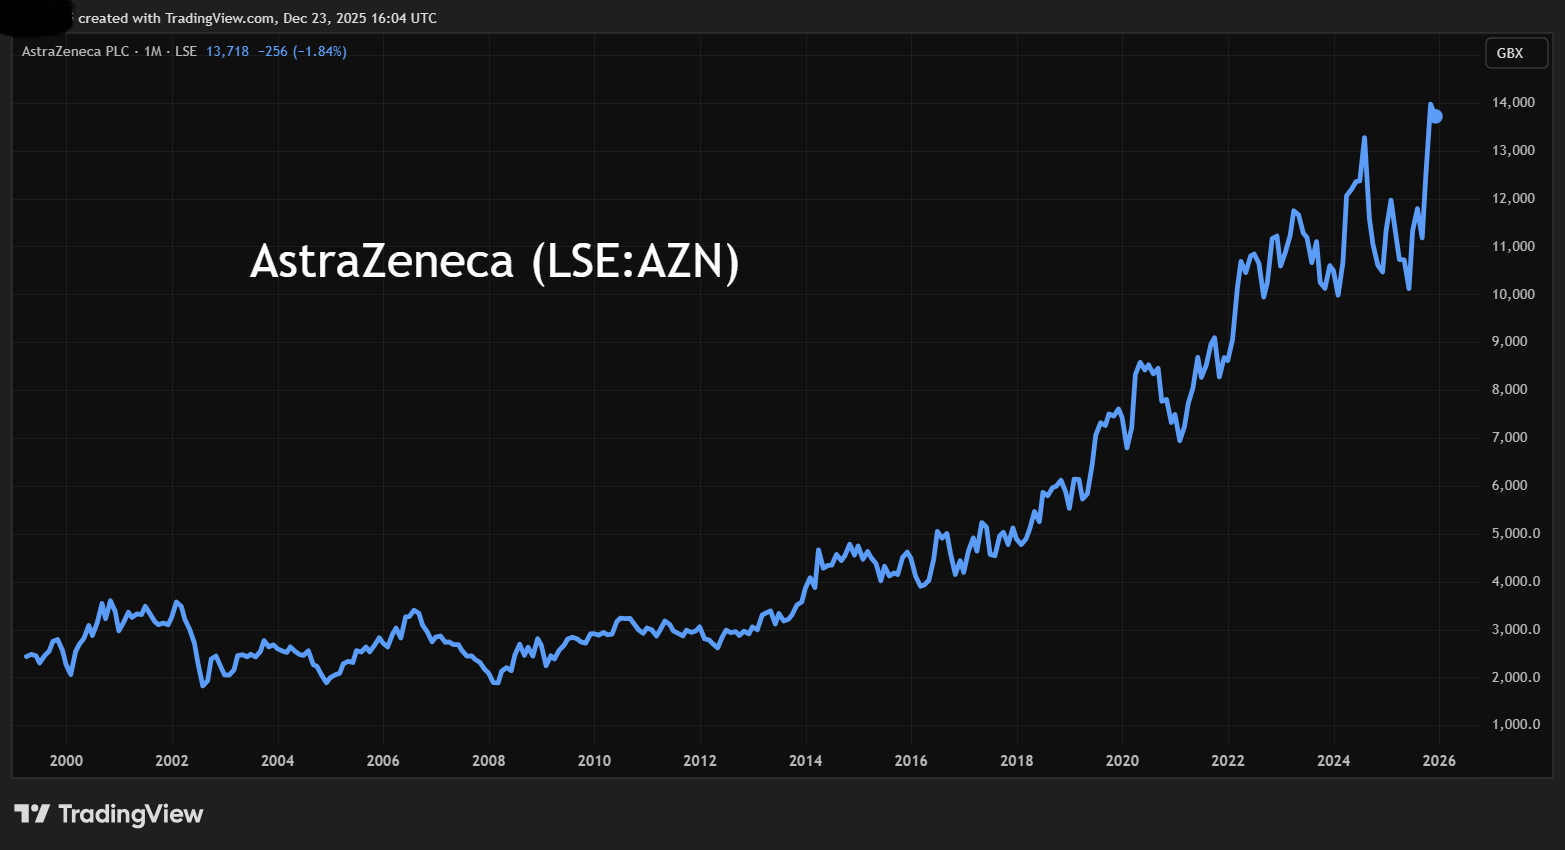
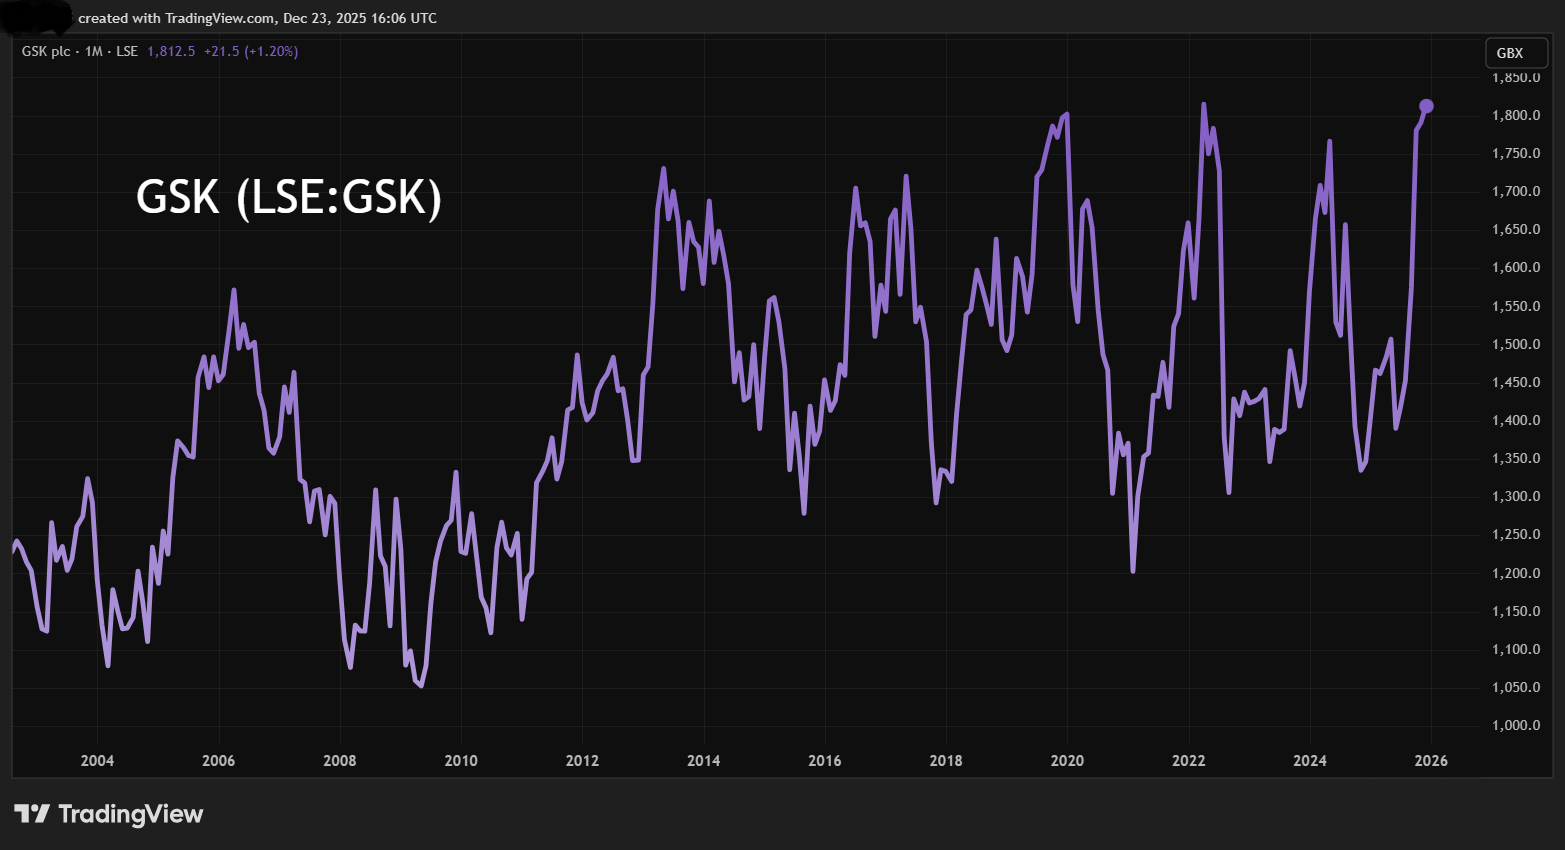
AstraZeneca (LSE:AZN) vs GSK (LSE:GSK) is a perennial “growth vs value” comparison, with Astra often trading on a growth PE around 20x, while GSK has languished on high single digits.
- Investment outlook: expert opinion, analysis and ideas
- ii view: AstraZeneca on track to achieve ambitious target
- Income Investor: a blue-chip stock for income and growth
After drawing attention to Astra at 7,100p in February 2021 and it being a success up to 13,500p, although volatile, I thought turnaround initiatives by GSK’s CEO ought to see mean-reversion upwards in the PE multiple, supported also by a material yield versus Astra.
Source: TradingView. Past performance is not a guide to future performance.
Yet despite GSK’s progress from 1,400p in January 2023, when I rated “buy”, to 1,810p currently, this has chiefly happened since last September when the Trump administration was so gracious as to exempt foreign pharmaceutical groups from 100% tariffs if they invest substantially in US manufacturing and R&D.
Astra pre-empted this, committing to $50 billion (£37 billion) last July and GSK followed in September, declaring $30 billion over the next five years. Both shares rallied but Astra has sustained its bull run since the 2008 crisis, while GSK is only near breaking out of its all-time range:
Source: TradingView. Past performance is not a guide to future performance.
I continue to veer towards a “buy” at GSK and a “hold” at Astra. GSK’s recently strong third-quarter results, drug approvals and share buybacks could finally help it achieve a chart breakout if stock markets remain firm.
Asset managers benefit from market’s strong second half
Low PE/high yield has applied, especially in the asset management sector, while it has struggled with redemptions, hence a lower asset base from which to generate fees.
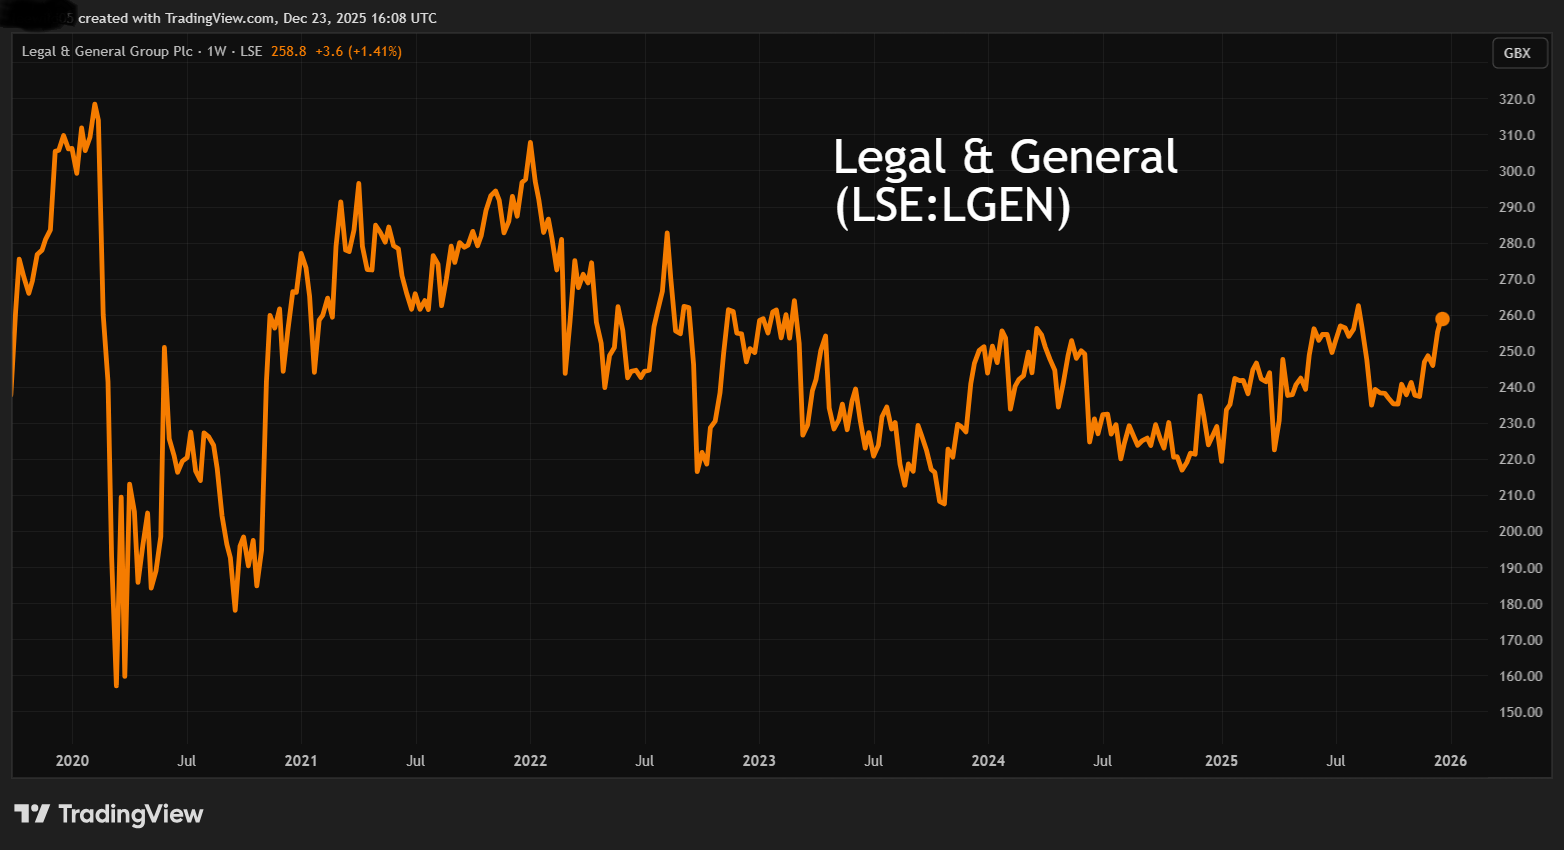
FTSE 100 shares such as Legal & General Group (LSE:LGEN) are also often avoided due to their overall complexity (including insurance), even if a near 9% dividend yield can appear to compensate.
Like GSK, this share is chronically sideways-volatile though, and could now be viewed as an emerging “bowl” pattern:
Source: TradingView. Past performance is not a guide to future performance.
I rated L&G a “buy” at 227p in June 2024 against a 9% yield and new CEO targeting earnings per share (EPS) growth in high single digits, although by last April the shares were still only 237p when I retained a “buy” stance.
An advance followed to 263p by mid-August, if hard to distinguish from the wider rally, then a plunge to 235p despite interim results headlined “Core operating EPS up 9% as strategic momentum builds”, also it promising to return over £5 billion in dividends and share buybacks over three years. The shares have since improved to 256p and I retain it as a “buy”, if primarily for income-seekers given L&G’s challenge to establish an uptrend.
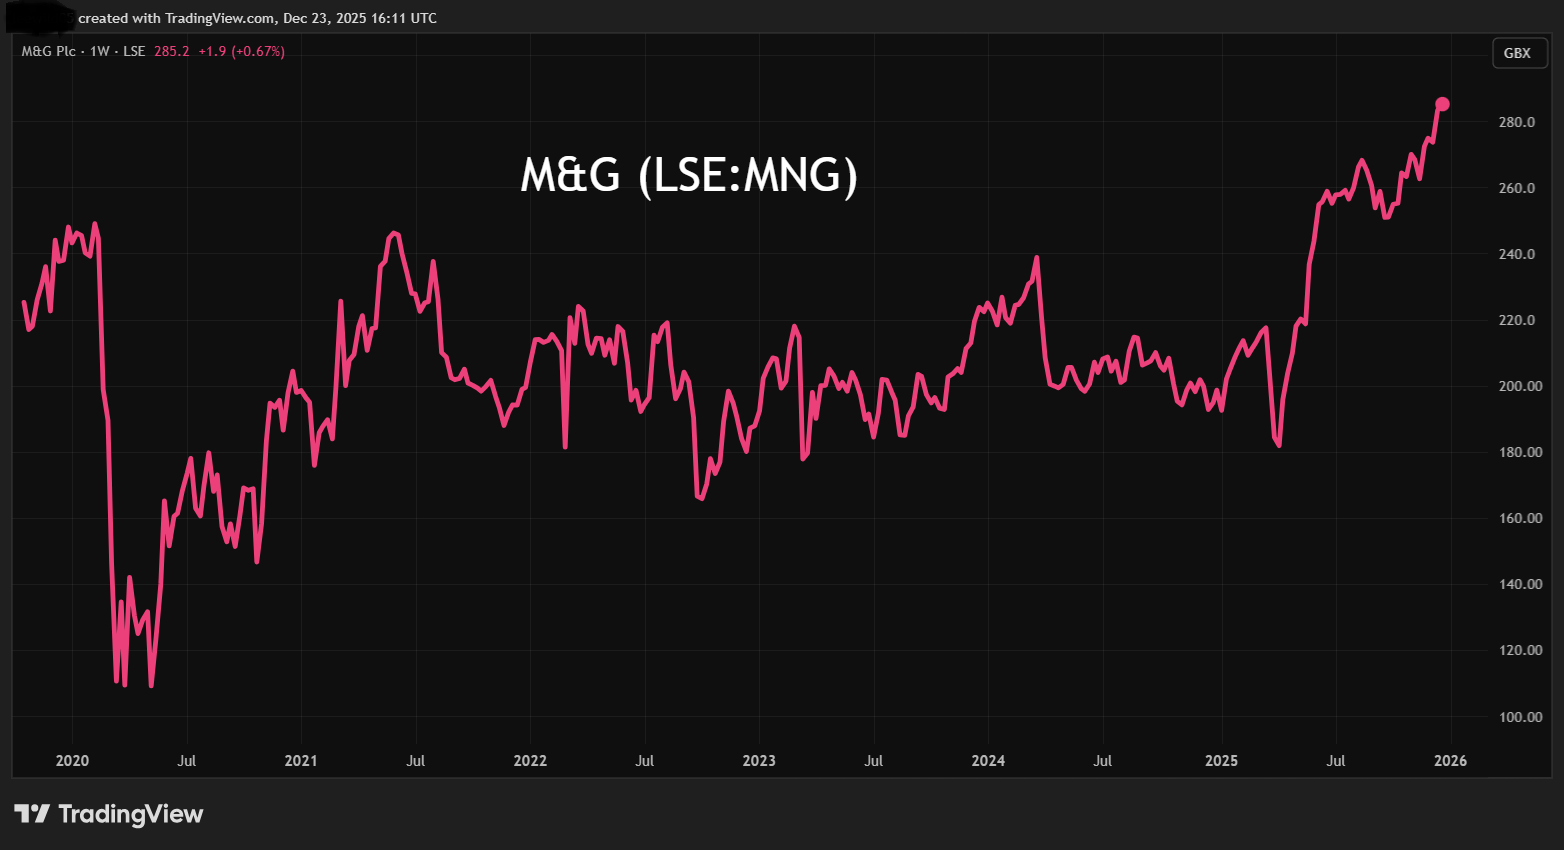
M&G Ordinary Shares (LSE:MNG) I rated “buy” at 207p in April 2024, adjusting to “hold” last March at 217p, instead favouring Prudential (LSE:PRU) as a “buy” at 785p on a 10x forward PE.
M&G has, however, enjoyed an overall steady bull run to 283p, hence a total return near 50% over 21 months:
Source: TradingView. Past performance is not a guide to future performance.
Prudential has advanced similarly to 1,150p if one benchmarks it against April 2024 and despite a lower circa 2% yield:
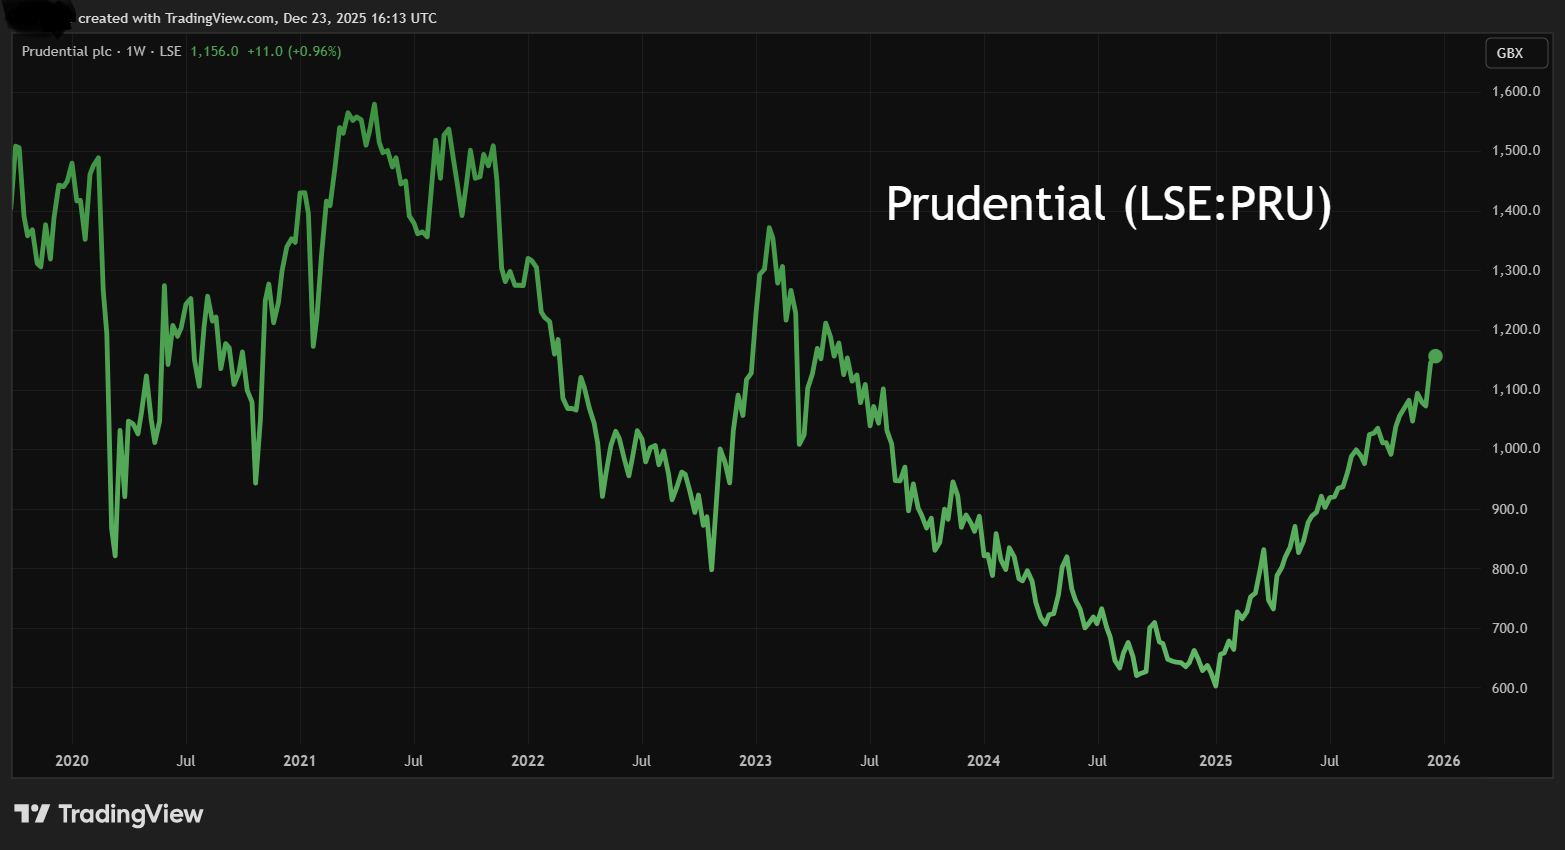
Source: TradingView. Past performance is not a guide to future performance.
Jupiter Fund Management (LSE:JUP) has been a hairier proposition as a mid-cap, more specifically geared to confidence in markets and having suffered redemptions. At 92p last May, I noted a potential “double bottom” chart reversal, although forecasts were cautious and I adopted a “hold” stance while awaiting better news. This came in July by way of an acquisition managing £15 billion versus Jupiter’s £44 billion, hence I upgraded to “buy”.
Adding critical mass in rising markets has thus helped Jupiter advance to 157p where the yield is still usefully near 4% with projected twice earnings cover.
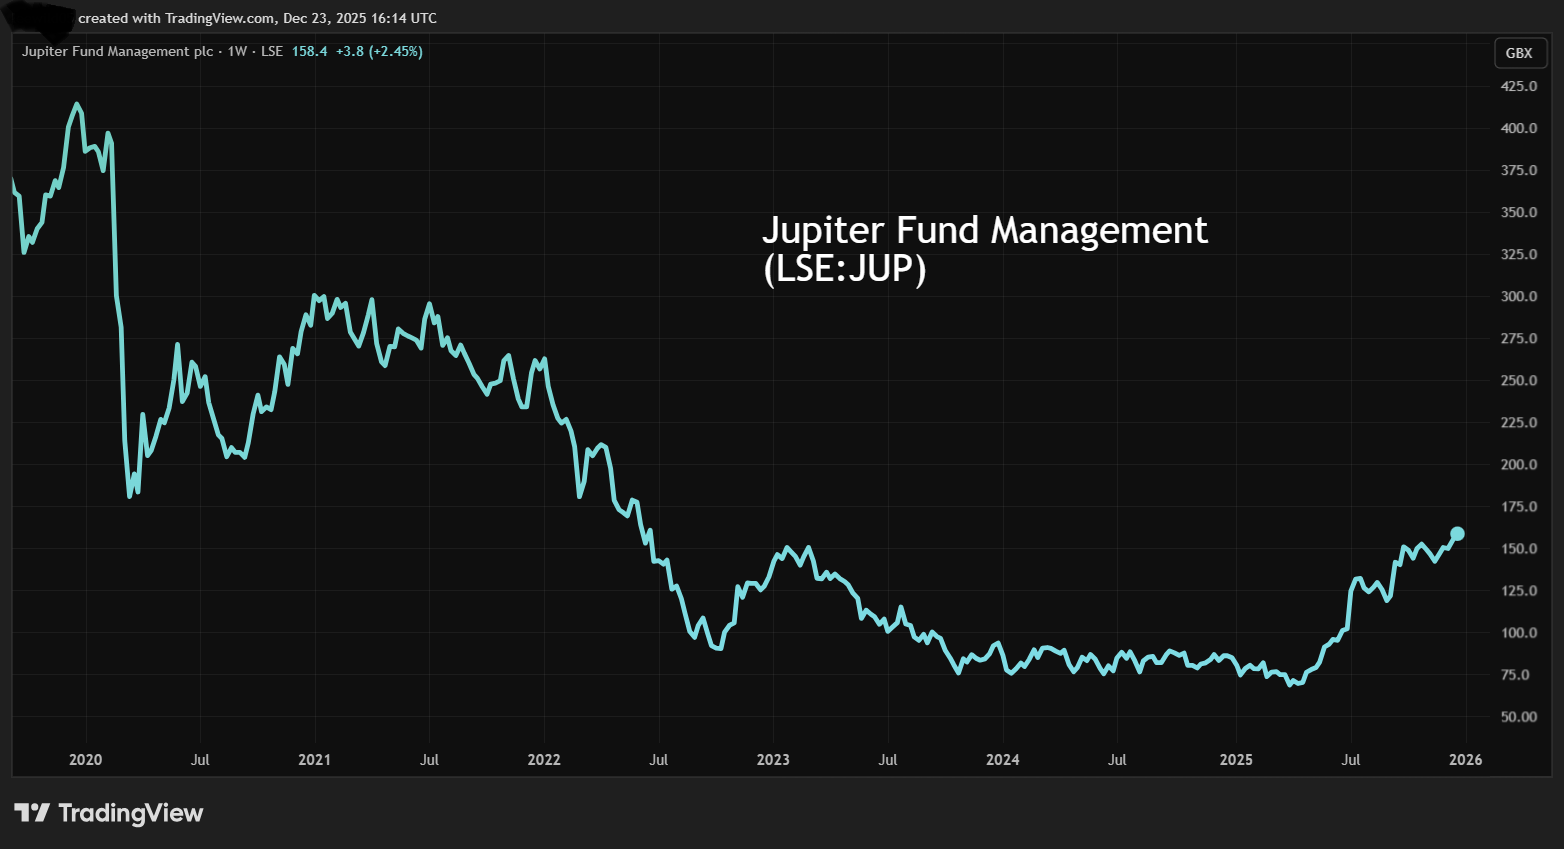
Source: TradingView. Past performance is not a guide to future performance.
Unless there is a major break in markets, it appears that both the underlying fundamentals and share technical indicators for asset managers hint at the positive trend persisting.
As ever, financial shares tend to lead markets either way, asset managers being an especially geared play.
Retailing: the paradox of Sainsbury’s as a leading short sell
In November 2024, I took a “buy” stance on Sainsbury (J) (LSE:SBRY) at 248p given a 5.5% prospective yield, 97% backed by net tangible assets. Sainsbury’s had been fashionable to short sell, with around 6% of its share capital (over the 0.5% disclosure threshold) out on loan. This had edged up to 7.3% by mid-April while the shares soared over 30% - showing how capital gains are possible even in big “boring” shares that are prominently shorted.
- Stockwatch: share tips, IPOs, tech and value in 2025
- Sign up to our free newsletter for investment ideas, latest news and award-winning analysis
Despite the 2016 acquisition of Argos for £1.4 billion viewed as questionable and failing to achieve a sale on satisfactory terms last September, I think Sainsbury’s marketing has defied sceptics who expected it to suffer from Aldi/Lidl’s UK expansion. Operating margins held at around 2.8% have helped sustain a 5% dividend yield even after the rise to 322p:
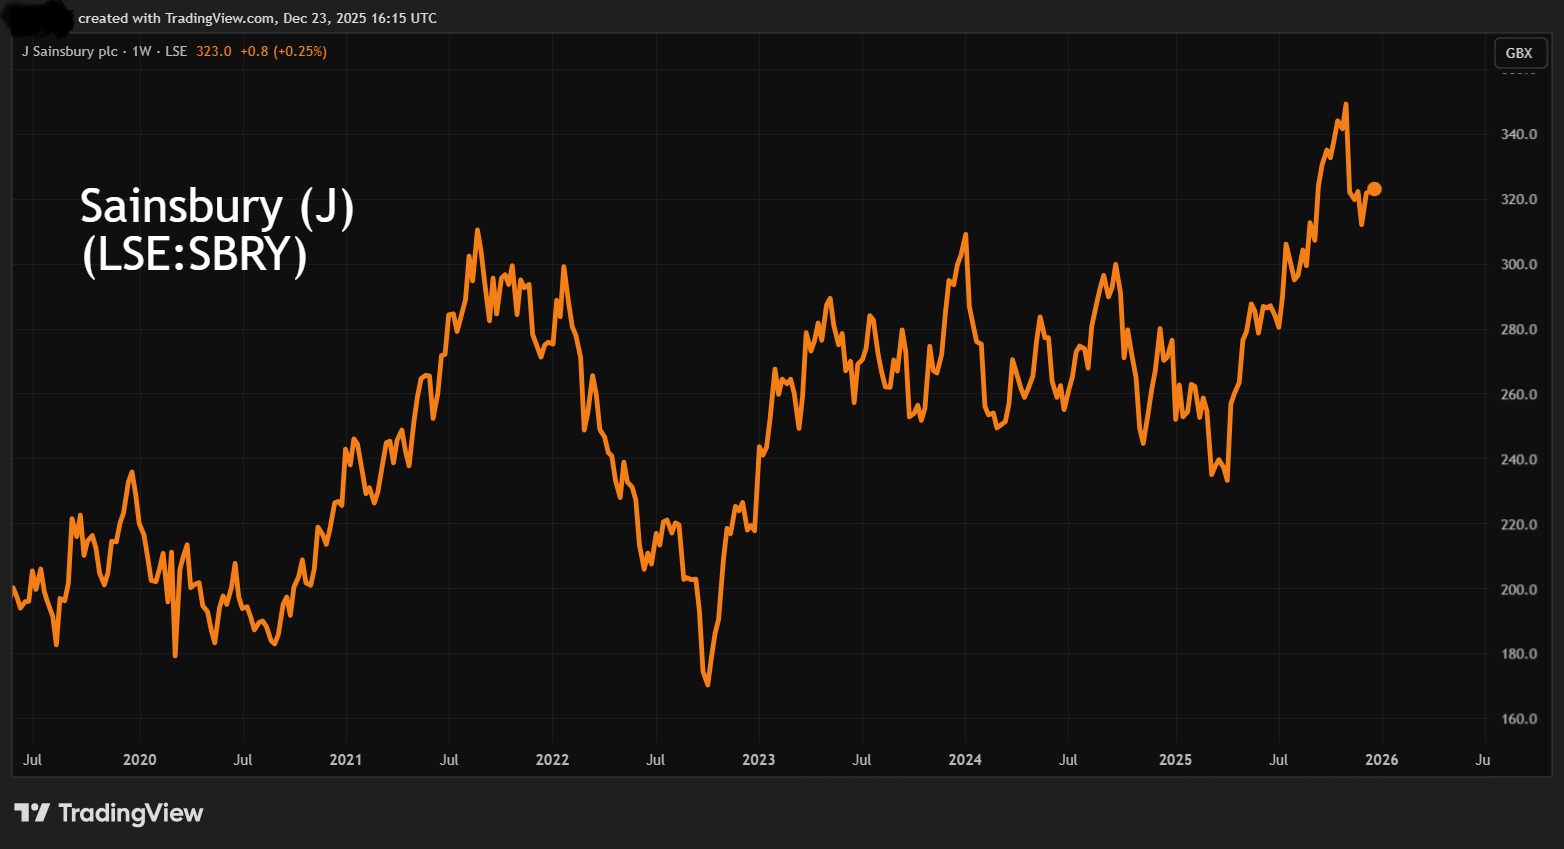
Source: TradingView. Past performance is not a guide to future performance.
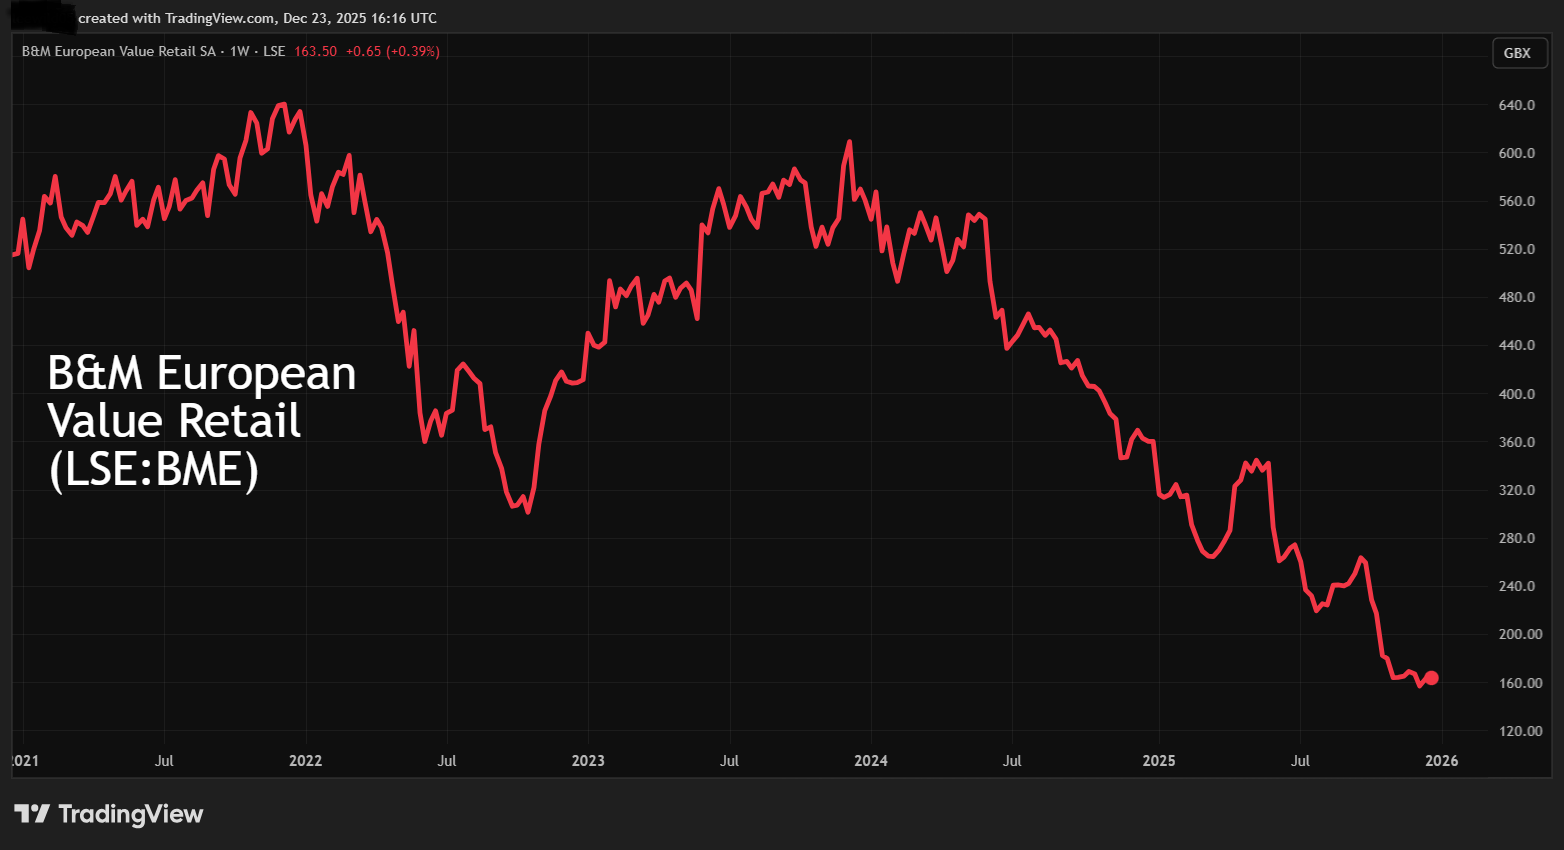
Yet B&M European Value Retail SA (LSE:BME) has been frustrating in terms of trying to call a low, underlining how perhaps it is best to let the chart confirm this despite potentially missing some early upside.
I was intrigued due to its strong record on free cash flow that has historically enabled special dividends, plus double-digit operating margins three times those of Tesco (LSE:TSCO). Last February, I engaged B&M at 280p but could muster only a “hold” rating. I took the same view at the same price in June.
Then a highly experienced new CEO waxed lyrical about turnaround prospects and bought £1.3 million worth of shares. I tilted to “buy” at 253p, only for 2026 subsequently to be downgraded due to accounting issues and lower margin plus higher debt going forward.
Source: TradingView. Past performance is not a guide to future performance.
At around 160p, the forward PE is supposedly below 7x and dividend yield around 8%, albeit a prime example of how the supposed “value” approach can court trouble.
The CEO has, however, continued to buy a further near £200,000 worth of shares at around 160p. Perhaps similar to how I prioritised Sainsbury’s marketing, I should have taken more notice of competition from privately owned Home Bargains for B&M and waited for a new CEO to settle in.
However, as mentioned in my 19 December article, Currys (LSE:CURY) has delivered consistent capital gains over two years despite its white goods seemingly of discretionary appeal.
Best be streetwise with “value” shares; there may be a key factor irrespective of the chart and director’s dealings that defines favourable risk/reward.
Edmond Jackson is a freelance contributor and not a direct employee of interactive investor.
These articles are provided for information purposes only. Occasionally, an opinion about whether to buy or sell a specific investment may be provided by third parties. The content is not intended to be a personal recommendation to buy or sell any financial instrument or product, or to adopt any investment strategy as it is not provided based on an assessment of your investing knowledge and experience, your financial situation or your investment objectives. The value of your investments, and the income derived from them, may go down as well as up. You may not get back all the money that you invest. The investments referred to in this article may not be suitable for all investors, and if in doubt, an investor should seek advice from a qualified investment adviser.
Full performance can be found on the company or index summary page on the interactive investor website. Simply click on the company's or index name highlighted in the article.
Disclosure
We use a combination of fundamental and technical analysis in forming our view as to the valuation and prospects of an investment. Where relevant we have set out those particular matters we think are important in the above article, but further detail can be found here.
Please note that our article on this investment should not be considered to be a regular publication.
Details of all recommendations issued by ii during the previous 12-month period can be found here.
ii adheres to a strict code of conduct. Contributors may hold shares or have other interests in companies included in these portfolios, which could create a conflict of interests. Contributors intending to write about any financial instruments in which they have an interest are required to disclose such interest to ii and in the article itself. ii will at all times consider whether such interest impairs the objectivity of the recommendation.
In addition, individuals involved in the production of investment articles are subject to a personal account dealing restriction, which prevents them from placing a transaction in the specified instrument(s) for a period before and for five working days after such publication. This is to avoid personal interests conflicting with the interests of the recipients of those investment articles.