ii investment performance review: Q1 2026
The outbreak of conflict in Iran in late February was the defining event of Q1, with oil and gas prices surging as a result.
17th April 2026 08:52

Market round-up
Note: all returns are quoted on a sterling basis unless otherwise stated.
- Our Services: SIPP Account | Stocks & Shares ISA | See all Investment Accounts
Global markets experienced a volatile start to the year, shaped by trade tensions, geopolitical developments, artificial intelligence (AI), persistent inflation concerns and shifting expectations for monetary policy.
Tariff threats continued to loom over the global economy as US President Donald Trump threatened to impose additional tariffs on a number of European countries due to a dispute over the control of Greenland. Although the threats ultimately did not come to pass, the market saw a sharp sell-off in mid-January as a result.
In early March, the US Supreme Court ruled against the use of the International Economic Emergency Powers Act that the Trump administration used to impose reciprocal tariffs last year. In response, President Trump imposed a flat 10% tariff on all imports under alternative authority, adding to policy uncertainty.
AI continued to play a major role in global markets, with software as a service (SaaS) companies experiencing a sell-off as new AI capabilities threaten to undermine the SaaS model. The technology sector also continued to come under pressure as it faced increased scrutiny over the scale of planned capital expenditure by hyperscalers and the sustainability of returns on that investment, despite the sector generally reporting good Q4 earnings. However, hardware suppliers to the AI infrastructure build-out fared better over Q1.
The outbreak of conflict in Iran in late February was the defining event of Q1, as the conflict stopped oil supply through the Strait of Hormuz, with companies in the region dramatically lowering or halting production. Oil and gas prices surged as a result, supporting broad energy sector performance, while global equities and bonds sold off as investors anticipated upward pressures on inflation and interest rates and a weaker economic outlook.
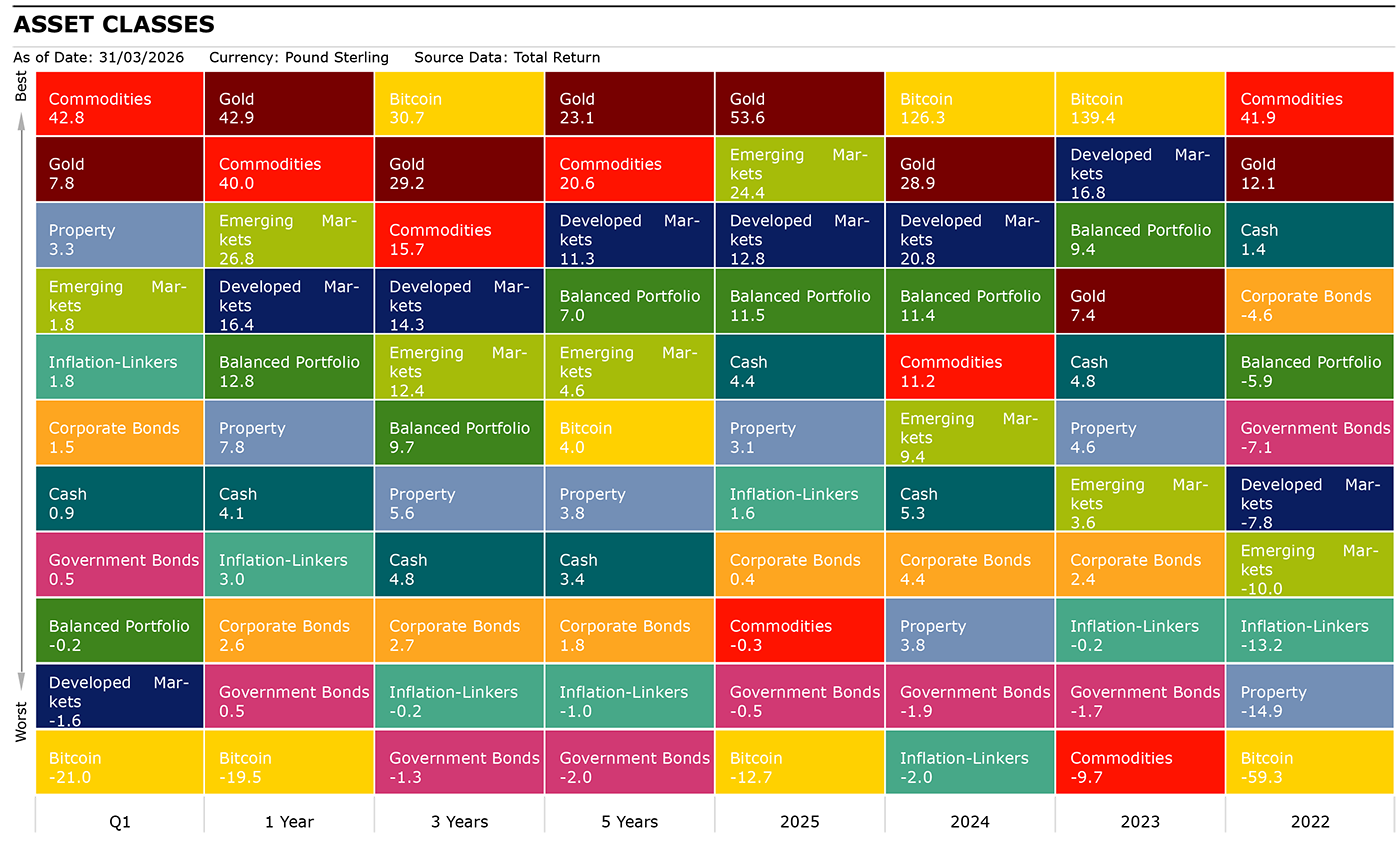
Source: Morningstar as of 31st March 2026. Total Returns in GBP. Developed Markets: MSCI World, Emerging Markets: MSCI EM, Corporate Bonds: Bloomberg Global Aggregate Corporate, Commodities: S&P GSCI, Property: FTSE EPRA Nareit Developed, Inflation-Linkers: Bloomberg Global Inflation Linked, Government Bonds: Bloomberg Global Treasury, Bitcoin: S&P Bitcoin, Balanced Portfolio: FTSE UK Private Investor Balanced, Cash: SONIA Lending Rate, Gold : LBMA Gold Price.
Shares
Global equities as measured by the MSCI ACWI fell 1.27% in Q1, with emerging markets (1.83%) outperforming developed markets (-1.65%).
The S&P 500 declined 2.42% for the quarter with Financials (-7.68%), Consumer Discretionary (-7.42%) and IT (-7.35%) being the main detractors. Macro shocks and a worsening outlook contributed to the sell-offs, while Financials also suffered from worries over private credit where defaults and elevated levels of redemption requests have exposed liquidity risks. Meanwhile, IT was affected by the new AI threat to SaaS businesses and increased scrutiny over AI-related spending.
Energy was the best-performing sector having returned 40.70% as oil prices surged over supply disruptions in the Middle East. More defensive sectors such as Utilities (10.19%) and Consumer Staples (9.62%) also outperformed as investors sought to de-risk.
UK equities outperformed global equities as the FTSE All-Share index saw a positive return of 2.41% in Q1, buoyed by a relatively large weighting to the energy sector which rose 35.01%, with Basic Materials (17.23%), Utilities (12.07%) and Telecoms (12.04%) also seeing strong returns. The main detractors were IT (-17.66%) and Consumer Discretionary (-12.61%).
European equities underperformed as they fell 2.29% for the quarter. Consumer Discretionary (-19.40%) was the worst performer due to worsening consumer sentiment and lower demand from Asia on top of economic and geopolitical uncertainty. Financials (-7.11%) and Health Care (-4.40%) also lagged, while the best performers in Europe were Energy (51.17%) and Utilities (13.25%).
- ISA investing: nine ii experts reveal their ISA tips for 2026-27
- The 11 ‘forever shares’ I’ve picked for my kids’ Junior ISAs
- How to start accessing your pension the right way
In Japan, the TOPIX index was a strong performer having risen 4.15%. Japanese stocks rallied in February on expectations of more growth stimulus following a landslide victory for the Liberal Democratic Party (LDP) before retreating due to oil disruptions in the Middle East. The best-performing sectors were Energy Resources (37.10%), Steel & Nonferrous (29.87%) and Trade & Wholesale (21.67%), while Power & Gas (12.10%), Machinery (10.99%), Financials (10.48%) and Pharmaceuticals (10.00%) also saw double-digit returns. In terms of laggards, IT & Services (-10.20%) was the worst performer, with Auto & Transport Equipment (-5.50%), Electrical Appliances (-2.19%) and Retail Trade (-1.25%) also seeing negative returns.
The MSCI EM Index rose 1.83% in Q1, with Latin American countries such as Colombia (23.54%), Peru (23.20%) and Brazil (21.48%) performing strongly due to rising commodities prices. In Asia, South Korea (18.87%) and Taiwan (11.27%) ended the quarter with double-digit returns as they benefited from soaring demand for hardware from hyperscalers for the AI infrastructure build out. That was prior to a sell-off due to the Iran conflict, with South Korea hit particularly hard due to a higher dependency on energy exports from the Middle East.
Notable underperformers in EM were India (-16.50%) and China (-7.12%), two major index constituents. From a sector perspective, IT (13.51%), Energy (13.05%) and Utilities (6.47%) led the way, while Communication Services (-13.59%) and Consumer Discretionary (-9.86%) were the worst performers.
| Q1 (%) | 1 year | 3 years | 5 years | |
| FTSE All-Share | 2.41 | 21.54 | 13.33 | 11.11 |
| FTSE 100 | 3.42 | 22.63 | 14.15 | 12.72 |
| FTSE 250 | -5.05 | 12.95 | 7.47 | 2.81 |
| FTSE Small Cap | -3.62 | 15.10 | 9.67 | 4.79 |
| Europe Ex UK | -2.29 | 14.77 | 9.84 | 8.71 |
| S&P 500 | -2.42 | 15.31 | 15.80 | 13.08 |
| Asia Pacific Ex Japan | 1.37 | 24.63 | 11.10 | 4.45 |
| TOPIX Japan | 4.15 | 23.88 | 13.70 | 8.00 |
| Emerging Markets | 1.83 | 26.81 | 12.40 | 4.63 |
| Brazil | 21.48 | 53.04 | 17.18 | 12.73 |
| China | -7.12 | 1.65 | 4.29 | -4.05 |
| India | -16.50 | -15.27 | 4.16 | 5.48 |
| World | -1.65 | 16.38 | 14.29 | 11.27 |
| MSCI ACWI | -1.27 | 17.47 | 14.10 | 10.48 |
| World Growth | -6.62 | 17.67 | 15.94 | 11.36 |
| World Value | 3.20 | 14.13 | 12.17 | 10.58 |
Source: Morningstar as of 31 March 2026. Total Returns in GBP. MSCI ACWI World Indexes. Past performance is not a guide to future performance.
Sectors
Stylistically, global value (3.20%) outperformed global growth (-6.62%) in Q1 as Energy (36.26%) led all sectors due to surging oil & gas prices, with Materials (8.70%) also performing well due to rising commodity prices. Other value sectors such as Utilities (10.55%) and Consumer Staples (5.36%) also outperformed as investors sought to de-risk amid geopolitical and economic uncertainty.
Within the growth segment, IT (-4.86%) suffered as SaaS businesses came under pressure due to AI advancements threatening the business model and increased scrutiny over AI spending, while Consumer Discretionary suffered on the worsening economic outlook impacting consumer sentiment.
At the global level, small- (3.08%) and mid-caps (1.57%) saw positive returns while large-caps fell 1.79% in Q1 as the index heavyweight's AI-exposed companies all posted negative Q1 returns. Microsoft Corp (NASDAQ:MSFT) (-21.74%), Tesla Inc (NASDAQ:TSLA) (-15.69%) and Meta Platforms Inc Class A (NASDAQ:META) (-11.51%) were hit particularly hard. There are, however, regional differences. In the UK, large-caps (3.42%) outperformed mid- (-5.05%) and small-caps (-3.62%), while mid-caps led large and small-caps in EM, Europe and Japan.
| Q1 (%) | 1 year | 3 years | 5 years | |
| Consumer Discretionary | -9.10 | 3.40 | 7.59 | 2.90 |
| Healthcare | -2.68 | 2.05 | 3.00 | 5.64 |
| Industrials | 4.49 | 23.23 | 15.65 | 11.59 |
| Information Technology | -4.86 | 30.58 | 22.18 | 16.15 |
| Materials | 8.70 | 31.30 | 8.84 | 7.64 |
| Utilities | 10.55 | 22.94 | 12.37 | 10.41 |
| Consumer Staples | 5.36 | 3.91 | 2.76 | 5.54 |
| Financials | -4.79 | 10.83 | 17.95 | 12.66 |
| Energy | 36.26 | 36.18 | 16.19 | 21.14 |
| Communication Services | -5.99 | 22.72 | 21.03 | 9.14 |
Source: Morningstar as of 31 March 2026. Total Returns in GBP. MSCI ACWI World Indexes. Past performance is not a guide to future performance.
Fixed income
The Bloomberg Global Aggregate Index saw a modest gain of 0.90% in Q1 but outperformed global high yield 0.66%, while global government bonds 0.54% fared worse than global corporates 1.46%.
In the UK, gilts fell 1.85% which was comparable to UK corporates which fell 1.66%. Gilts were one of the best-performing government bonds in the lead up to the conflict in Iran, as inflationary pressures looked to finally be easing which increased market expectations for rate cuts. Gilts subsequently sold off as the possibility of rate cuts faded due to the energy shock following the closure of the Strait of Hormuz, which fuelled inflationary fears given the UK’s high reliance on natural gas and limited storage capacity. The Bank of England opted to keep the base rate at 3.75% in March but indicated that it stands ready to act as necessary. UK inflation-linked bonds, however, were a bright spot as they rose 1.26% in Q1.
US Treasuries were flat (0.10%) on a sterling-hedged basis, faring better than global government bonds due to the US being a net energy exporter, making it better insulated from the supply disruptions, and due to the cooling labour market reducing upward pressures on inflation. The Federal Reserve opted to keep the Fed Funds Rate at 3.50-3.75% in March.
| Q1 (%) | 1 year | 3 years | 5 years | |
| Global Aggregate | 0.90 | 2.05 | 0.41 | -0.57 |
| Global Government | 0.54 | 0.46 | -1.28 | -2.03 |
| UK Gilts | -1.85 | 2.52 | 0.42 | -4.25 |
| Global Corporate | 1.46 | 2.63 | 2.68 | 1.84 |
| Sterling Corporate | -1.66 | 4.45 | 4.27 | -0.71 |
| EURO Corporate | -0.94 | 6.39 | 4.09 | 0.24 |
| Global Inflation Linked | 1.75 | 3.02 | -0.18 | -1.02 |
| UK Inflation Linked | 1.17 | 4.06 | -3.28 | -7.27 |
| Global High Yield | 0.66 | 6.28 | 7.77 | 5.10 |
Source: Morningstar as of 31 March 2026. Total Returns in GBP. Global Aggregate: Bloomberg Global Aggregate, Global Government: Bloomberg Global Treasury, UK Gilts: FTSE Act UK Conventional Gilts All Stocks. Global Corporate: Bloomberg Global Corporate, Sterling Corporate: Bloomberg Sterling Non-Gilt, Euro Corporate: Markit iBoxx EUR, Global High Yield: Bloomberg Global High Yield, Global Inflation Linked: Bloomberg Global Inflation Linked, UK Inflation Linked: Bloomberg Global Inflation Linked UK.
Alternatives
The S&P GSCI Index saw strong returns in Q1 as it rose 42.82%, driven by an 86.42% rise in Energy, as the component surged due to disruptions to production and transportation in the Middle East. The outbreak of the Iran conflict practically closed the Strait of Hormuz, which is responsible for 20% of the global oil supply, as well as natural gas and fertilisers. Precious Metals closed Q1 up 9.18% despite a significant retreat as higher interest rate expectations weighed. Industrial Metals (8.16%), Livestock (7.43%) and Agriculture (6.64%) also saw positive returns in Q1.
| Q1 (%) | 1 year | 3 years | 5 years | |
| Global REITs | 3.33 | 7.77 | 5.57 | 3.75 |
| UK REITs | -8.52 | -0.38 | 0.24 | -3.30 |
| Gold | 7.82 | 42.86 | 29.22 | 23.10 |
| Global Infrastructure | 10.45 | 24.22 | 13.75 | 13.10 |
| Global Natural Resources | 22.23 | 41.98 | 11.40 | 13.90 |
| Volatility | 72.27 | 10.93 | 8.18 | 6.37 |
| Cash | 0.94 | 4.15 | 4.80 | 3.35 |
| Commodity | 42.82 | 39.96 | 15.66 | 20.64 |
| Brent crude oil | 74.28 | 36.11 | 6.86 | 11.63 |
| Energy | 86.42 | 61.92 | 22.86 | 28.89 |
| Bitcoin | -21.00 | -19.50 | 30.71 | 3.95 |
Source: Morningstar as of 31 March 2026. Total Returns in GBP. Global REITS: FTSE EPRA Nareit Developed, UK REITs: FTSE EPRA Nareit UK, Gold: LBMA Gold Price AM, Oil: Oil Price Brent Crude, Global Infrastructure: S&P Global Infrastructure, Natural Resources: S&P Global Natural Resources, Commodities: S&P GSCI , Energy : S&P GSCI,Volatility: CBOE Market Volatility (VIX), Cash: SONIA Lending Rate, Bitcoin: S&P Bitcoin
Most-traded shares on the ii platform in Q1 2026
Most-bought shares
| Legal & General Group (LSE:LGEN) |
| Rolls-Royce Holdings (LSE:RR.) |
| Lloyds Banking Group (LSE:LLOY) |
| Microsoft Corp (NASDAQ:MSFT) |
| Glencore (LSE:GLEN) |
Most-sold shares
These articles are provided for information purposes only. Occasionally, an opinion about whether to buy or sell a specific investment may be provided by third parties. The content is not intended to be a personal recommendation to buy or sell any financial instrument or product, or to adopt any investment strategy as it is not provided based on an assessment of your investing knowledge and experience, your financial situation or your investment objectives. The value of your investments, and the income derived from them, may go down as well as up. You may not get back all the money that you invest. The investments referred to in this article may not be suitable for all investors, and if in doubt, an investor should seek advice from a qualified investment adviser.
Full performance can be found on the company or index summary page on the interactive investor website. Simply click on the company's or index name highlighted in the article.