Stockwatch: time to lock in profits on these three shares?
In the wake of the Supreme Court’s ruling on car finance redress, analyst Edmond Jackson reviews a banking trio.
5th August 2025 11:34
by Edmond Jackson from interactive investor

Various bank shares were stand-out performers yesterday after winning an appeal in the UK Supreme Court; that hidden commissions on car loans were not unlawful, and that lenders did not owe a fiduciary duty to customers.
Mid-cap Close Brothers Group (LSE:CBG) surged nearly 24% to 491p and small-cap Secure Trust Bank (LSE:STB) by 12% to 1,095p also S & U (LSE:SUS) by 9% to 1,900p; with Lloyds Banking Group (LSE:LLOY) also gaining 9% to 82.5p.
- Invest with ii: Top UK Shares | Share Tips & Ideas | Cashback Offers
The extent of knee-jerk reaction seems a bit curious given that uncertainties remain. The Financial Conduct Authority (FCA) will start a consultation procedure on customer redress from October, which could cost banks from £9 billion to £18 billion when compensation starts from next year. That each claim is likely to settle below £950 a claim, underlines the biggest UK consumer finance scandal since payment protection insurance (PPI).
But in another sense it shows how the market often defaults to a cautious view. Last March, I drew attention to Close Brothers at 284p and Secure Trust at 572p as justifying “buy” ratings given a pragmatic outcome in the UK motor finance scandal was most likely. This would see respectful compensation that any guilty parties are able to pay, it making no sense to cripple those businesses [and also] reduce choice and competition on price for consumers.
My previous experience with Barclays (LSE:BARC) and Metro Bank Holdings (LSE:MTRO) had shown that when bank shares fall as low as 0.3x net tangible asset value, this can at least imply a support level if not inflection point for a new uptrend.
After Close has soared 72% to 491p, this still only represents around 0.5x net tangible assets of 10,053p per share as of last January. Perhaps the market remains wary that the board’s £165 million provision for compensation will be enough, although the shares have rallied consistently from early April.
Taking a five-year view, this can be interpreted as mean reversion after a prolonged fall, as much an “everything rally” after the initial shock of US tariffs:
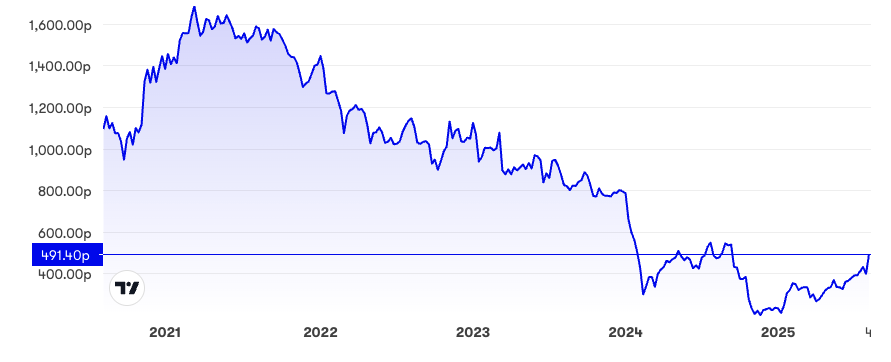
Source: interactive investor. Past performance is not a guide to future performance.
Consensus as yet anticipates net profit of around £85 million in the current year to 31 July, rising to over £90 million in 2026, not dissimilar to 2023 and 2024, and implying a 12-months’ forward price/earnings (PE) just over 9x versus no dividends.
Market sentiment seems liable to remain capricious on that basis, just as financial shares are prone to lead market rallies, they can sell off on economic fears, with the big question being the extent of tax rises a Labour chancellor could enact this autumn, rather than spending cuts. It makes Close Brothers an especially tricky call given the extent you trust management’s £165 million provision; and yet the ongoing material discount to net tangible assets provides comfort.
- Sign up to our free newsletter for investment ideas, latest news and award-winning analysis
- The stock paying half of all FTSE 100 dividend income in August
On 25 July, Close sold its Winterflood market-making operation for £104 million, further supporting a relatively strong balance sheet and the Common Equity Tier 1 capital ratio (CET1), a key measure of a bank’s ability to withstand losses. This should also mitigate cyclicality and enable Close to be seen as a focused, specialist lender, potentially good for its longer-term rating.
Within an overall “hold” stance, I would still expect some profit-taking, especially if US shares come off the boil and UK macro fears grow. Holders might therefore want to consider locking in some gains according to risk preference and their view on the economy.
Close Brothers Group - financial summary
Year end 31 July
| 2019 | 2020 | 2021 | 2022 | 2023 | 2024 | |
| Turnover (£ million) | 889 | 950 | 1,038 | 1,025 | 1,028 | 1,048 |
| Operating profit (£m) | 265 | 141 | 265 | 233 | 112 | 142 |
| Net profit (£m) | 202 | 110 | 202 | 165 | 81.1 | 100 |
| Operating margin (%) | 29.8 | 14.8 | 25.5 | 22.7 | 10.9 | 13.5 |
| Reported earnings/share (p) | 133 | 72.5 | 134 | 110 | 54.2 | 66.9 |
| Normalised earnings/share (p) | 133 | 75.5 | 135 | 110 | 54.2 | 68.4 |
| Operational cashflow/share (p) | 13.5 | 284 | 78.7 | 106 | 683 | -255 |
| Capital expenditure/share (p) | 31.1 | 32.8 | 37.5 | 38.9 | 41.4 | 29.7 |
| Free cashflow/share (p) | -17.6 | 251.0 | 41.2 | 66.7 | 641 | -284 |
| Dividend per share (p) | 66.0 | 40.0 | 60.0 | 66.0 | 67.5 | 0.0 |
| Covered by earnings (x) | 2.0 | 1.8 | 2.2 | 1.7 | 0.8 | 0.0 |
| Return on total capital (%) | 2.5 | 1.3 | 2.2 | 1.8 | 0.8 | 1.0 |
| Cash (£m) | 1,106 | 1,376 | 1,331 | 1,255 | 1,937 | 1,584 |
| Net debt (£m) | 1,509 | 1,233 | 1,270 | 1,615 | 907 | 772 |
| Net assets (£m) | 1,407 | 1,451 | 1,570 | 1,658 | 1,645 | 1,843 |
| Net assets per share (p) | 930 | 959 | 1,041 | 1,102 | 1,093 | 1,224 |
Source: company accounts.
S&U asserts ‘a victory for common sense’
While I didn’t include it in last March’s tips, S&U is an interesting comparator with Close given its rally – on a quite similar five-year chart – has restored the shares to around 1,900p relative to last January’s net tangible asset value of 1,959p per share with no goodwill/intangibles.
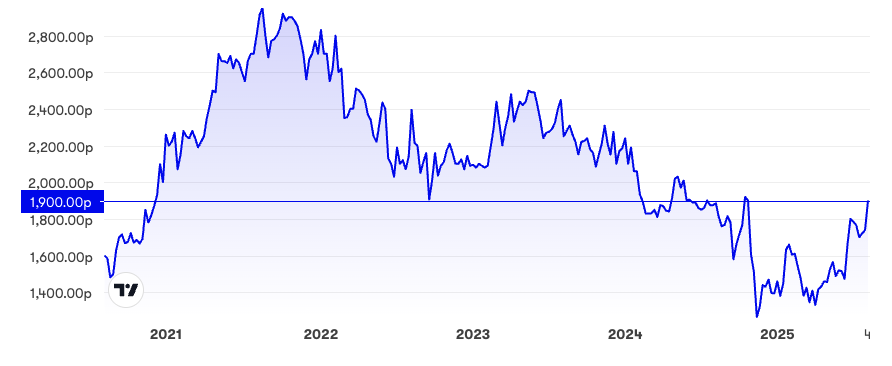
Source: interactive investor. Past performance is not a guide to future performance.
Moreover, and if you want to take a more positive stance on scope for car-purchase lending, S&U’s chair asserts that the latest ruling “will significantly boost confidence throughout the motor finance industry and benefit lenders and consumers alike in attracting investment and increasing competition”.
His “common sense” view refers to whether car dealers and credit brokers have a fiduciaryduty to customers, similar to a pension trustee where they should empathise with customers’ best interests. The Court of Appeal had previously decided this did apply here but the Supreme Court overturned it; it being reasonable to assume that both sides in a finance sale are pursuing their own interests. Implicitly, a dealer did not need to assure the customer that in finding a suitable credit deal it was putting aside its own commercial interest.
Otherwise, it would have greatly enlarged the sense of “compensation culture” in other areas of the economy, possibly raising services’ prices as firms adjust to liability for a duty of care.
- Stockwatch: how far can this smoking rally go?
- Insider: a £100k bet on FTSE 250 stock at 18-month low
Some customers will still have means of redress where the relationship has been “unfair”, according to section 148 of the Consumer Credit Act; although S&U believes the impact should be minimal.
S&U last updated investors at its 18 June AGM, saying collections in its now smaller motor finance division were getting back to normal, and at the best level since 2023; also the property bridging finance side was continuing to perform well.
First-quarter motor lending had jumped 50%, but we have seen cyclicals such as advertising and recruitment warn of a downturn in the second quarter, so quite how sustainable this improvement will be remains to be seen. S&U’s chair obviously backs a sense that confidence in motor financing should improve generally.
Consensus expects high teens’ earnings per share (EPS) growth in the current year to 31 January 2026, also 2027, implying an attractive PEG ratio of 0.6 - where below 1.0 classically implies value. The measure is meant, however, to apply to growth shares demonstrating consistent improvement, rather than a cyclical financial recovering from falls since 2021. Some investors may still respond to a sense, a 12 months’ forward P/E around 9x divided by the expected earnings growth rate, generated this 0.6x PEG.
S&U - financial summary
Year end 31 Jan
| 2020 | 2021 | 2022 | 2023 | 2024 | 2025 | |
| Turnover (£ million) | 89.9 | 83.8 | 87.9 | 103 | 115 | 116 |
| Operating profit (£m) | 40.0 | 21.7 | 50.8 | 48.9 | 48.6 | 42.1 |
| Net profit (£m) | 28.9 | 14.6 | 38.0 | 33.7 | 25.4 | 17.9 |
| Operating margin (%) | 44.5 | 25.9 | 57.8 | 47.6 | 42.1 | 36.4 |
| Reported earnings/share (p) | 239 | 121 | 313 | 278 | 209 | 147 |
| Normalised earnings/share (p) | 239 | 121 | 313 | 278 | 209 | 164 |
| Operational cashflow/share (p) | 41.0 | 271 | -17.2 | -517 | -3.7 | 535 |
| Capital expenditure/share (p) | 2.5 | 10.0 | 3.1 | 6.8 | 2.2 | 6.0 |
| Free cashflow/share (p) | 38.5 | 261 | -20.3 | -523 | -5.9 | 529 |
| Dividend per share (p) | 120 | 90 | 126 | 133 | 120 | 100 |
| Covered by earnings (x) | 2.0 | 1.3 | 2.5 | 2.1 | 1.7 | 1.5 |
| Return on total capital (%) | 13.4 | 7.8 | 15.9 | 11.6 | 10.6 | 9.7 |
| Cash (£m) | 0.7 | 0.0 | 0.0 | 3.1 | 0.0 | 5.2 |
| Net debt (£m) | 119 | 99.8 | 114 | 193 | 225 | 193 |
| Net assets (£m) | 179 | 181 | 207 | 225 | 234 | 238 |
| Net assets per share (p) | 1,481 | 1,492 | 1,702 | 1,851 | 1,927 | 1,959 |
Source: company accounts
Time will tell whether the extent of management’s confidence at the AGM for “improved profitability this year and in the future” will be affirmed by the UK economy; but contrasting with Close, S&U offers a near 6% yield covered twice by expected earnings, and with its free cash-flow profile having massively improved in its January 2025 year.
Along with possibly lower compensation due to motor finance customers, I therefore attach a firmer sense of a “hold” rating to S&U shares.
Secure Trust Bank hasn’t added any comment on this final ruling
Its last update was 2 July when declaring a strategic pivot to run off its motor finance book, which made a £22 million pre-tax loss on 558 million net lending last year; also representing over 30% of the cost base. The priority henceforth being to focus on profitable property and business lending operations; again we will see what medium-term prospects for the UK economy allow.
Secure Trust shares are similar to Close Brothers’ by way of price to tangible book value of around 0.6x, but also sporting a moderate 3.3% prospective yield with enormous cover of 7x over 8x if consensus for 74% EPS rebound, and 33% in 2026, is fair.
The chart is an even sharper roller coaster at times than Close Brothers’ or S&U, with a strong firm rally this year. Once again, the UK economy will be the ultimate arbiter of how this small-cap specialist fares, but at 1,110p, up 94% since March, I apply an overall “hold” stance.
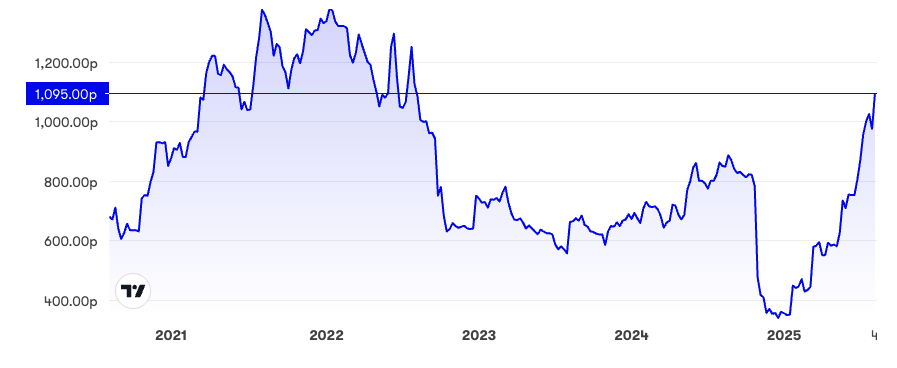
Source: interactive investor. Past performance is not a guide to future performance.
Edmond Jackson is a freelance contributor and not a direct employee of interactive investor.
These articles are provided for information purposes only. Occasionally, an opinion about whether to buy or sell a specific investment may be provided by third parties. The content is not intended to be a personal recommendation to buy or sell any financial instrument or product, or to adopt any investment strategy as it is not provided based on an assessment of your investing knowledge and experience, your financial situation or your investment objectives. The value of your investments, and the income derived from them, may go down as well as up. You may not get back all the money that you invest. The investments referred to in this article may not be suitable for all investors, and if in doubt, an investor should seek advice from a qualified investment adviser.
Full performance can be found on the company or index summary page on the interactive investor website. Simply click on the company's or index name highlighted in the article.
Disclosure
We use a combination of fundamental and technical analysis in forming our view as to the valuation and prospects of an investment. Where relevant we have set out those particular matters we think are important in the above article, but further detail can be found here.
Please note that our article on this investment should not be considered to be a regular publication.
Details of all recommendations issued by ii during the previous 12-month period can be found here.
ii adheres to a strict code of conduct. Contributors may hold shares or have other interests in companies included in these portfolios, which could create a conflict of interests. Contributors intending to write about any financial instruments in which they have an interest are required to disclose such interest to ii and in the article itself. ii will at all times consider whether such interest impairs the objectivity of the recommendation.
In addition, individuals involved in the production of investment articles are subject to a personal account dealing restriction, which prevents them from placing a transaction in the specified instrument(s) for a period before and for five working days after such publication. This is to avoid personal interests conflicting with the interests of the recipients of those investment articles.