Time to tilt to quality? Investment trusts to consider
Could the quality factor return to outperforming the broader market? A Kepler analyst examines the argument for exposure to the factor.
6th February 2026 14:00

This content is provided by Kepler Trust Intelligence, an investment trust focused website for private and professional investors. Kepler Trust Intelligence is a third-party supplier and not part of interactive investor. It is provided for information only and does not constitute a personal recommendation.
Material produced by Kepler Trust Intelligence should be considered a marketing communication, and is not independent research.
Every year, when football seasons kick off across Europe, it would not be much of a gamble to bet on Bayern Munich emerging as German champions, given that they have won circa 76% of the past 20 completed seasons. The Bavarian club’s dominance of the Bundesliga has earned it the moniker Rekordmeister (meaning record champion) in reference to the fact that it has won more German championships than any other team since the league’s foundation.
Arguably, this dominance is reminiscent of the quality factor’s outperformance of the broader market in global equity markets since the global financial crisis (GFC). Since 15 September 2008 — the day Lehman Brothers filed for bankruptcy — the MSCI All-Country World Index (ACWI) Quality has returned 806.7%, compared with 496.6% for the MSCI ACWI.
One could also argue that Bayern Munich’s ability to consistently hoard trophies is akin to the capacity of quality companies to consistently generate higher return on equity (ROE) and/or ROIC than the broader market. The comparison does not stop there. Like quality stocks, Bayern Munich is arguably protected by a moat: its stronger financial position and prestige enable it to attract global talent, such as England’s Harry Kane, as well as top domestic players, while also nurturing and retaining its most promising youth prospects. This, in turn, helps ensure the club remains well positioned to continue outperforming its domestic rivals.
However, as the 76% figure suggests, there have been seasons when the Rekordmeister has had to cede its crown. The most recent example came in the 2023–24 season, when underdog Bayer Leverkusen won its first-ever German championship. Similarly, the quality factor has not outperformed the broader market in every calendar year since the GFC, with 2025 being the most recent example.
Interestingly, the underperformance of the quality factor relative to the broader market has been consistent across regions over the last year. That said, there were important nuances in terms of which factors outperformed. In the US, it was growth which outstripped quality, while it was value that outperformed in other key developed markets. This continues a trend of value outperformance over single calendar years in ex-US markets that has been in place since 2022 (which we discussed in a recent strategy article).
The chart below shows the performance of MSCI indices across different regions, alongside their quality, growth, and value declinations, in 2025. For instance, for global equities, we used the MSCI ACWI, MSCI ACWI Quality, MSCI ACWI Growth, and MSCI ACWI Value indices.
Performance of investment factors
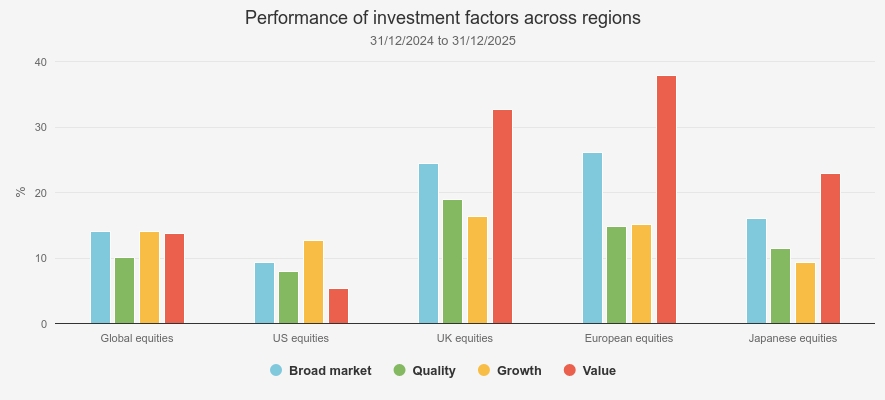
Source: Morningstar
The outperformance of the value factor relative to quality in 2025 was largely concentrated in the first half of the year. Concerns over elevated US equity valuations, the potential impact of tariffs, and a weakening US dollar prompted investors to rotate out of US equities and into international markets. Given that many equity indices outside the US (e.g. Europe and UK) are tilted toward value-oriented sectors such as financials, industrials, and materials, this rotation proved a headwind for the quality factor.
In addition, non-US quality stocks may not have been perceived as compelling alternatives, as they arguably only partially addressed valuation concerns. While they are often less expensive than their US counterparts, international quality stocks still generally trade at a premium to their respective broader markets.
Moreover, non-US quality stocks tend to have higher exposure to the US economy than other factor cohorts. For example, they typically generate a larger share of their revenues in the US, as the chart below shows. As a result, they may have been viewed as particularly vulnerable to US tariffs.
By contrast, value stocks tend to have a more domestic revenue profile than companies in other factor cohorts. In our view, quality stocks’ deeper integration in the global economy could prove to be a headwind, as these companies are likely to be more vulnerable to trade tariffs, supply-chain disruptions, etc. That said, a counterargument would be that quality companies often provide hard-to-replace goods or services, which grant them pricing power and may help mitigate some of these challenges.
Revenue exposure
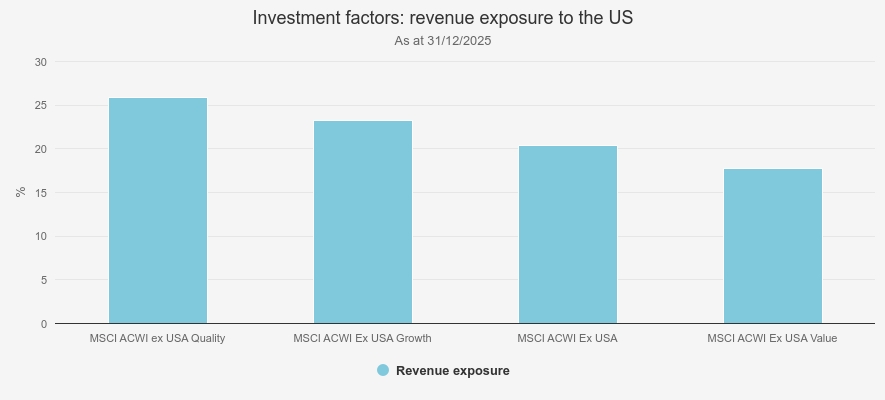
Source: Morningstar
The growth factor rebounded in the second half 2025 as investor sentiment improved following tariff reductions and the signing of trade agreements. In addition, leading technology companies exposed to artificial intelligence (AI) reported earnings growth exceeding expectations at the end of the first half of the year, reigniting investor enthusiasm for the AI theme.
While global quality indices do have exposure to some established AI leaders — including NVIDIA Corp (NASDAQ:NVDA), ASML Holding NV (EURONEXT:ASML), and Taiwan Semiconductor Manufacturing Co Ltd ADR (NYSE:TSM) — their emphasis on stable earnings and low financial leverage means that they exclude more speculative, pre-profit companies.
However, these higher-risk names drove market gains in the second half of the year, resulting in further headwind for the quality factor. The chart below shows the relative performance of the MSCI ACWI Quality Index versus the MSCI ACWI Growth and MSCI ACWI Value indices in 2025.
Relative performance
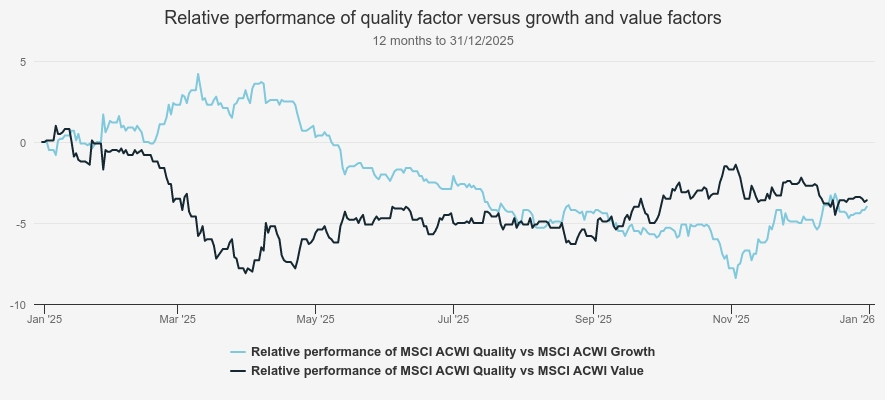
Source: Morningstar. Past performance is not a reliable indicator of future results
Is now an attractive entry point?
After losing its crown to Bayer Leverkusen in the 2023–24 season, Bayern Munich reasserted its dominance in the following season. This raises the question: could the quality factor similarly return to outperforming the broader market?
History seems to be on the side of quality. Looking at past patterns, underperformance of the quality factor over a single calendar year has been more the exception than the rule. Since 2006, it has occurred in only six out of 20 calendar years, and these periods have generally been followed by strong outperformance in the subsequent year. Moreover, the quality factor has consistently outperformed the broader market and other investment factors over full market cycles (defined here as five-year periods).
For example, the MSCI ACWI Quality has outperformed both the MSCI ACWI and MSCI ACWI Value in every annual five-year rolling period between 01/02/2006 and 31/12/2025, and the MSCI ACWI Growth in c. 93% of these periods. That said, it’s important to note that these five-year periods have occurred either entirely or mostly within the post-GFC era, a period characterised by low interest rates and a relatively stable geopolitical environment.
Since 2022, however, this landscape has shifted, marked by higher interest rates and heightened geopolitical tensions. While central banks have been cutting interest rates since 2024, long-term treasury yields remain higher than they were at the end of 2022, which weighs on quality stocks by lowering the present value of their future cash flows.
Meanwhile, rising geopolitical tensions are prompting countries to rely on or develop domestic champions rather than foreign players. A recent example is France’s move to phase out Microsoft Teams - Microsoft Corp (NASDAQ:MSFT) being a staple of global equity strategies - from government departments, replacing it with lesser-known domestic alternatives.
The deglobalisation trend is also reflected in changing consumer behaviours worldwide, with consumers increasingly favouring local products over global brands. This shift is impacting some companies classified as consumer staples, many of which frequently feature in the portfolios of global quality strategies. We believe these examples highlight the broader trend of global fragmentation and the potential challenges it may pose for quality names, although many of these companies offer products or services that may be difficult to fully replace or decouple from existing systems.
Rolling returns
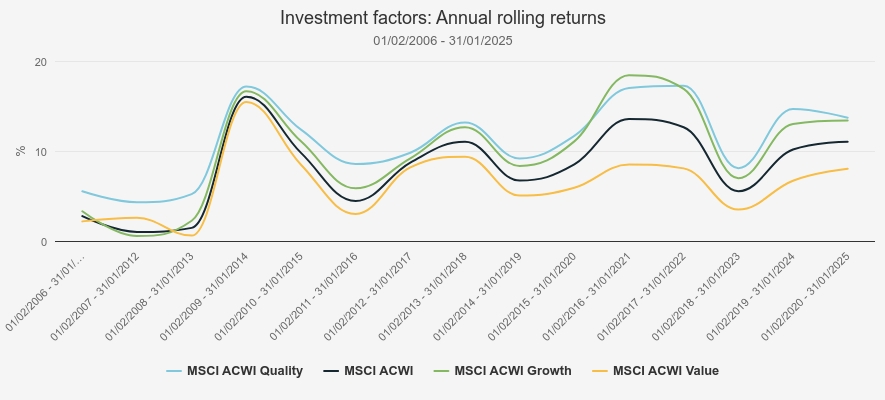
Source: Morningstar. Past performance is not a reliable indicator of future results
In terms of valuations, the MSCI ACWI Quality is commanding a price-to-earnings (P/E) ratio of 26x, which compares to 22.1x for the MSCI ACWI. This premium is to be expected and is reflective of the stronger fundamentals of quality names. However, the quality index’s current P/E is above its 10-year average of 22.5x, meaning that quality stocks are expensive relative to their history.
In addition, consensus forecasts suggest that the MSCI ACWI Quality will deliver slower earnings growth over the next 12 and 24 months than the broader index, as the bar chart below shows. However, this may reflect expectations that the more speculative AI-related names — which are typically not included in quality indices — will continue to outperform. That said, we believe that if the global economy weakens, investors may pivot towards quality stocks due to their strong balance sheets, which could enable them to weather challenging periods, and the hard-to-replace nature of their goods and services, which may support continued revenue generation.
Earnings growth expectation
Source: Bloomberg.
Getting exposure to the quality factor through investment trusts
Investors are spoiled for choice when it comes to actively managed strategies focusing on quality names, including within the investment trust space. However, investment trusts offer investors the possibility to access these strategies through vehicles that may trade at a discount - offering potential for rerating alongside the performance of the underlying holdings - and/or that may use gearing, which can amplify returns (as well as losses).
However, it is worth noting that quality can have different interpretations depending on the managers, while others use quality stocks to achieve specific goals. For example, James Harries and Tomasz Boniek, managers of STS Global Income & Growth Trust Ord (LSE:STS), approach quality through the lens of dividend growth and capital preservation. This results in a moderate correlation and low R² with the MSCI ACWI Quality Index over five years.
Conversely, Mid Wynd International Inv Tr Ord (LSE:MWY), managed by Louis Florentin-Lee and Barnaby Wilson, focusses on businesses capable of generating sustainably high returns on capital and reinvesting cash flows to drive future growth. Their preferred measure is cash flow return on investment (CFROI), which gauges how much cash a company generates relative to its invested capital. This approach results in a higher correlation and R² with the MSCI ACWI Quality; however, it is worth noting that the current managers have only been in place since October 2023, meaning the calculations also incorporate periods under the previous management team.
Interestingly, we note that F&C Investment Trust Ord (LSE:FCIT)has the highest correlation to the MSCI ACWI Quality than any other constituent of the AIC Global and AIC Global Equity Income sectors over five years. However, FCIT is a multi-manager strategy, covering different geographies, as well as investment styles, including quality, but also growth, value, GARP, etc. We think this high correlation is a byproduct of FCIT’s investment approach, aiming to be a core holding for investors, resulting in a high correlation to the broader market, which is itself highly correlated to the MSCI ACWI Quality. The table below shows the correlation and R2 of each investment trust in the AIC Global and AIC Global Equity Income sectors to the MSCI ACWI Quality in the five years to 31/12/2025.
Correlation & R²
| Trust | sector | Correlation | R² |
| F&C Investment Trust Ord (LSE:FCIT) | AIC Global | 0.95 | 89.5 |
| Franklin Global Trust Ord (LSE:FRGT) | AIC Global | 0.94 | 81.9 |
| Mid Wynd International Inv Tr Ord (LSE:MWY) | AIC Global | 0.94 | 81.3 |
| Alliance Witan Ord (LSE:ALW) | AIC Global | 0.91 | 83.6 |
| Bankers Ord (LSE:BNKR) | AIC Global | 0.91 | 75.2 |
| Scottish American Ord (LSE:SAIN) | AIC Global Equity Income | 0.90 | 60.3 |
| Monks Ord (LSE:MNKS) | AIC Global | 0.89 | 81.9 |
| Brunner Ord (LSE:BUT) | AIC Global | 0.89 | 75.1 |
| JPMorgan Global Growth & Income Ord (LSE:JGGI) | AIC Global Equity Income | 0.88 | 81.3 |
| Invesco Global Equity Income Trust ord (LSE:IGET) | AIC Global Equity Income | 0.87 | 28.7 |
| AVI Global Trust Ord (LSE:AGT) | AIC Global | 0.80 | 38.7 |
| STS Global Income & Growth Trust Ord (LSE:STS) | AIC Global Equity Income | 0.72 | 25.3 |
| Murray International Ord (LSE:MYI) | AIC Global Equity Income | 0.71 | 31.2 |
| Scottish Mortgage Ord (LSE:SMT) | AIC Global | 0.70 | 55.8 |
| Lindsell Train Ord (LSE:LTI) | AIC Global | 0.61 | 66.6 |
Source: Morningstar.
Differences in approach can also lead to significant divergence in returns among quality-oriented strategies. For instance, while almost all the investment trusts in the AIC Global and AIC Global Equity Income sectors that we view as quality-oriented have underperformed both global and global quality indices over the past five years (to 27/01/2026), JPMorgan Global Growth & Income Ord (LSE:JGGI) has been the exception, outperforming both, as the chart below shows. The peer group in question includes JGGI alongside STS, MWY, Lindsell Train Ord (LSE:LTI), and Franklin Global Trust Ord (LSE:FRGT)(although we note that the board of FRGT has proposed merging with Invesco Global Equity Income Trust ord (LSE:IGET), with a circular published on 21/01/2026, and so it is likely to disappear from the peer group).
JGGI’s relative success is likely due to the importance of valuation in its investment process. The managers look for quality companies with the potential to deliver faster earnings growth while trading on attractive valuations. They employ JPMorgan’s Strategic Classification framework, which categorises stocks as ‘premium’, ‘quality’, ‘standard’, or ‘challenged’, with a preference for the first two categories. However, given their sensitivity to valuations, the managers are also willing to invest in ‘standard’ or ‘challenged’ companies where valuations underestimate growth potential and when ‘premium’ and ‘quality’ names appear too expensive.
Five-year performance
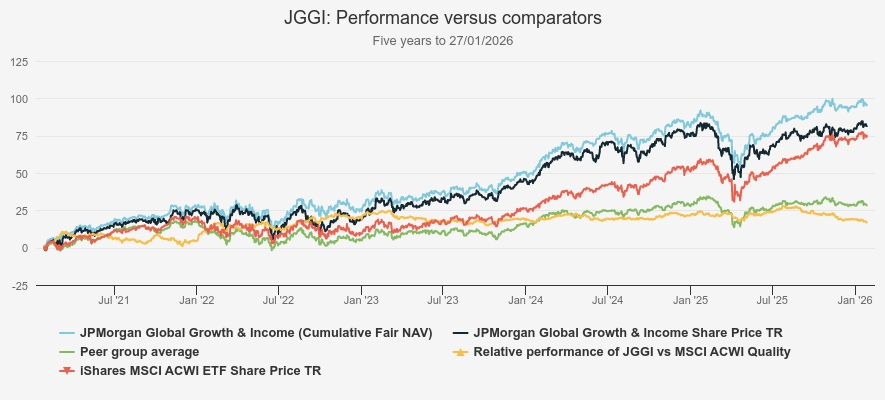
Source: Morningstar. Past performance is not a reliable indicator of future results
Conclusion
In our view, the quality factor is likely to face more headwinds in the years ahead than it did in the post-GFC era, as the global nature of its constituent companies leaves them more exposed to deglobalisation trends, supply-chain disruptions, and other geopolitical risks. We think the rotation towards European and UK banks, as well as defence-related companies (areas not typically associated with the quality factor) seen in 2025, likely reflects an increased preference for exposure to domestic rather than global economies. Moreover, the trend towards de-dollarisation could also weigh on quality companies, as many are listed in the US, while many non-US firms still generate a significant portion of their revenues there. In addition, quality names are trading on elevated multiples relative to history, while earnings growth forecasts lag those of the broader market.
In that light, a trust such as JGGI could be an appealing way to get exposure to quality but without such a pronounced style tilt. JGGI’s approach has consistently delivered strong results, with JGGI outperforming its benchmark, the MSCI ACWI, in every calendar year from 2019 to 2024, although the trust was negatively impacted by the momentum-driven market in 2025. In addition, JGGI has generally traded close to par or at small premiums over the past five years. The board aims to maintain an average discount of around 5% or less and actively buys back shares to achieve this. As such, we believe the risk of a wide discount to develop is low, making JGGI potentially suitable for investors who are uncomfortable with discount volatility.
Discount
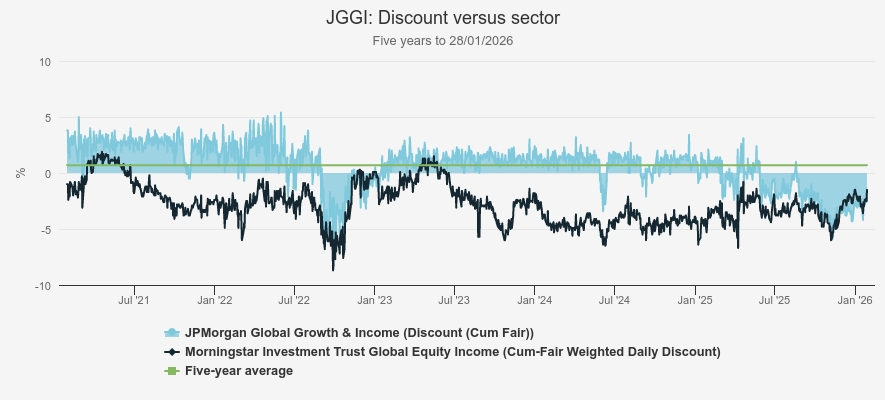
Source: Morningstar
However, we think there is also a case to be made for allocating to a full-throttle quality strategy at this juncture. We think earnings growth forecasts for the broader market may embed expectations that speculative, non-profitable AI-related names will continue to outperform.
In addition, investors may also come to find the strong balance sheets, pricing power, and relative predictability of quality companies attractive again if economic conditions weaken. Moreover, as discussed, managers can have different interpretations of quality, potentially resulting in portfolios that diverge meaningfully from the MSCI ACWI Quality and may adapt better to changes in paradigms.
We see MWY as the purest play on the quality factor within the AIC Global and AIC Global Equity Income sectors. The trust offers access to the Lazard Global Quality Growth strategy, which was historically reserved for institutional investors, and focuses on investing in high-quality companies capable of sustaining high levels of financial productivity.
The theory behind this approach is that the market persistently underestimates such companies due to the economic law of competition, which states that high returns on capital attract competitors, causing those returns to eventually converge toward the cost of capital. However, the managers believe this theory does not always hold in practice, resulting in mispricing where companies that defy this trend often go on to outperform the market over time.
While MWY’s NAV performance has been challenging since the team’s appointment in October 2023, the managers believe now could be an attractive entry point for quality-oriented strategies, given the quality factor is out of favour. They believe this could prove rewarding if the market refocuses on fundamentals and warn that it won’t be obvious when sentiment turns.
Kepler Partners is a third-party supplier and not part of interactive investor. Neither Kepler Partners or interactive investor will be responsible for any losses that may be incurred as a result of a trading idea.
These articles are provided for information purposes only. Occasionally, an opinion about whether to buy or sell a specific investment may be provided by third parties. The content is not intended to be a personal recommendation to buy or sell any financial instrument or product, or to adopt any investment strategy as it is not provided based on an assessment of your investing knowledge and experience, your financial situation or your investment objectives. The value of your investments, and the income derived from them, may go down as well as up. You may not get back all the money that you invest. The investments referred to in this article may not be suitable for all investors, and if in doubt, an investor should seek advice from a qualified investment adviser.
Full performance can be found on the company or index summary page on the interactive investor website. Simply click on the company's or index name highlighted in the article.
Important Information
Kepler Partners is not authorised to make recommendations to Retail Clients. This report is based on factual information only, and is solely for information purposes only and any views contained in it must not be construed as investment or tax advice or a recommendation to buy, sell or take any action in relation to any investment.
This report has been issued by Kepler Partners LLP solely for information purposes only and the views contained in it must not be construed as investment or tax advice or a recommendation to buy, sell or take any action in relation to any investment. If you are unclear about any of the information on this website or its suitability for you, please contact your financial or tax adviser, or an independent financial or tax adviser before making any investment or financial decisions.
The information provided on this website is not intended for distribution to, or use by, any person or entity in any jurisdiction or country where such distribution or use would be contrary to law or regulation or which would subject Kepler Partners LLP to any registration requirement within such jurisdiction or country. Persons who access this information are required to inform themselves and to comply with any such restrictions. In particular, this website is exclusively for non-US Persons. The information in this website is not for distribution to and does not constitute an offer to sell or the solicitation of any offer to buy any securities in the United States of America to or for the benefit of US Persons.
This is a marketing document, should be considered non-independent research and is subject to the rules in COBS 12.3 relating to such research. It has not been prepared in accordance with legal requirements designed to promote the independence of investment research.
No representation or warranty, express or implied, is given by any person as to the accuracy or completeness of the information and no responsibility or liability is accepted for the accuracy or sufficiency of any of the information, for any errors, omissions or misstatements, negligent or otherwise. Any views and opinions, whilst given in good faith, are subject to change without notice.
This is not an official confirmation of terms and is not to be taken as advice to take any action in relation to any investment mentioned herein. Any prices or quotations contained herein are indicative only.
Kepler Partners LLP (including its partners, employees and representatives) or a connected person may have positions in or options on the securities detailed in this report, and may buy, sell or offer to purchase or sell such securities from time to time, but will at all times be subject to restrictions imposed by the firm's internal rules. A copy of the firm's conflict of interest policy is available on request.
Past performance is not necessarily a guide to the future. The value of investments can fall as well as rise and you may get back less than you invested when you decide to sell your investments. It is strongly recommended that Independent financial advice should be taken before entering into any financial transaction.
PLEASE SEE ALSO OUR TERMS AND CONDITIONS
Kepler Partners LLP is a limited liability partnership registered in England and Wales at 9/10 Savile Row, London W1S 3PF with registered number OC334771.
Kepler Partners LLP is authorised and regulated by the Financial Conduct Authority.