Trusts in hot demand: Parallel worlds of listed private equity
Some private equity trusts trade on 18% premiums, others on discounts of 15%. Are we missing something?
15th November 2019 16:17
This content is provided by Kepler Trust Intelligence, an investment trust focused website for private and professional investors. Kepler Trust Intelligence is a third-party supplier and not part of interactive investor. It is provided for information only and does not constitute a personal recommendation.
Material produced by Kepler Trust Intelligence should be considered a marketing communication, and is not independent research.
Some private equity trusts are on an average premium of 18%, while others trade on discounts of 15%. Is the market missing something?

The parallel worlds of listed private equity
William Heathcoat Amory, Founder, Kepler Trust Intelligence.
De-equitisation refers to the shrinking of the amount of public market equities in issue through share buybacks and M&A. It's a trend which means many investors are looking to find ways to invest in the parallel world of private investments. Among other things, investors are attracted by two features of private investments: the very different types of companies that have not yet made it to public markets; and the potentially strong returns that have been captured by the early backers of some well publicised unicorns.
But accessing private markets is rather harder than investing in public equity funds. As a result, those investment trusts that do offer exposure to private market investments are in hot demand, and currently rank amongst the highest rated investment trusts in that universe. The selections below all have a significant proportion of their assets in growth equities and have an average premium to NAV of 17.6%.
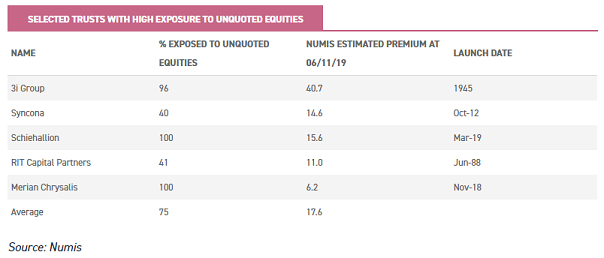
Nowadays, no article on investment trusts is complete without mentioning Woodford Patient Capital Trust (LSE:WPCT): majority unlisted, high growth potential, and back in mid-August 2015 trading at a 15% premium to net asset value (NAV). All the trusts listed above have their own specific positive attributes, such that, just like WPCT in 2015, a premium is perhaps justified. It is worth noting, however, that three out of the five are untested in a downturn. And the effect of any de-rating in a more risk-off environment could be exacerbated by the high growth / high risk characteristics of the underlying companies in some of these trusts.
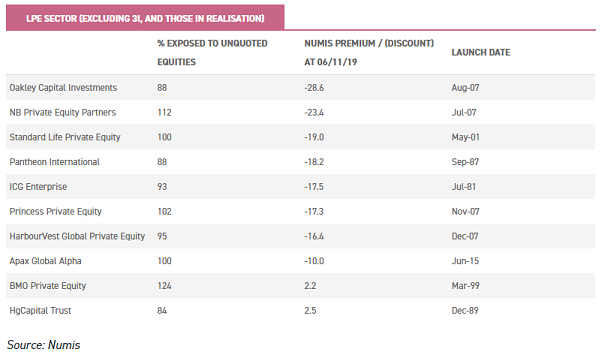
In another parallel world, another group of trusts exposed to the equities of private companies trade on some of the widest discounts in the entire investment trust sector. In contrast to the above, these trusts are typically invested in profitable growth businesses, but share the fact that they often occupy niches that are under-represented in public markets.
We are talking, of course, about the listed private equity sector. Excluding those trusts that are being wound up or in liquidation (and 3i (LSE:III)), this sub-sector trades on an average discount to NAV of around 15%. With a valuation gap between these two groups of trusts at a substantial 33%, the question has to be asked: what is the market missing?
History doesn't repeat, it just rhymes?
Some investors we have spoken to over the years have said they are wary of listed private equity (LPE) trusts; specifically over fears the sector will be hit hardest during a global slowdown or market sell-off. In our view this is likely the biggest reason discounts in LPE still persist. Clearly several investment trusts hit the buffers very hard during the 2008/09 'great financial crisis' (GFC). Share prices fell precipitously at the time, inflamed by investors' panic selling in an illiquid market. And it is worth remembering that, at the time, LPE trusts were generally trading on narrow discounts and in some cases even at a premium.
For example, when Candover Investments (LSE:CDI) announced its results for the year ending 31 December 2007, it was trading on a premium of 2.6% to the recently announced NAV. Evidently NAV declines can be exacerbated if discounts widen – especially when a premium switches to a (significant) discount.
With average discounts to NAV of around 16%, it could be argued that LPE investors already have a margin of safety. Assuming we do not experience another market-wide panic, the main focus should actually be NAVs, and their potential vulnerability in a sell-off. Resuming our example above, in 2008 the CDI portfolio declined in value by 36%, although gearing meant that the NAV fell by 50%.
Over the same period, the FTSE All Share fell by 32.8%. With gearing at 29% and significant commitments outstanding, on 2 March 2009 the discount stood at a hefty 88%; this was one year on from its 2007 results announcement.
In the market's eyes it was excessive gearing that crippled CDI, rather than a particularly poor performance from the underlying portfolio.
We will examine the NAV performance of other LPE trusts during the same period; although we note that those that were hit hardest during the GFC have since wound up. Consequently, there is a certain amount of survivorship bias in any numbers reviewing NAV performance over this time.
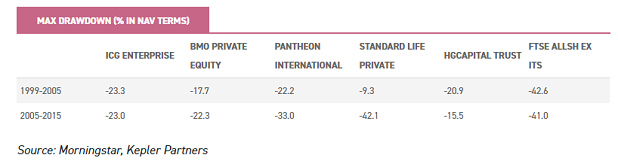
Of those that still exist, we illustrate in the table below how the past two crises (GFC and the previous 'dotcom' crash) affected them. The trusts selected here are the survivors of the class of 2000, and the experience of those that didn't survive was clearly much worse.
What the table below does indicate, however, is that on a NAV basis, these listed private equity trusts suffered significantly lower drawdowns than the FTSE All Share - although at the time, it was not clear that this would be so.
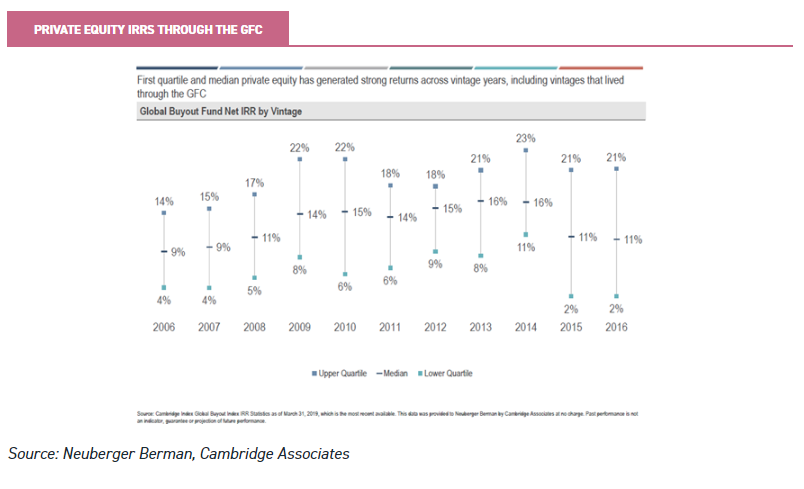
It would appear that the lower drawdowns experienced by this small section of LPE trusts is backed up by data for the wider private equity industry. The chart below represents data from an NB Private Equity Partners (LSE:NBPE) presentation, showing net IRRs across the global private equity universe, by vintage year.
Far from being a disaster, the data demonstrates that investments made in the years immediately leading up to the GFC performed, on average, very respectably. The numbers from the 2006/7 vintages were undoubtedly lower than subsequent years, as one might expect, but they were by no means catastrophic. Of course the past is not a guide to the future, but it was not necessarily NAV underperformance that investors needed to worry about.
Margin of safety?
With discounts widening across the sector at the time, market expectations of prospective returns from these 2006/2007 deals could not have been more wrong. Even for those that didn't completely wipe out, the severity of some discounts reached epic proportions during the GFC: according to Morningstar, in early 2009 Pantheon's share price stood at a discount to NAV of more than 80%. In short, share price drawdowns were significantly greater than NAV drawdowns. The paper losses are not to be sniffed at; but the tables above illustrate that the apparent peril, characterised by the ballooning of discounts, was far from justified in reality.
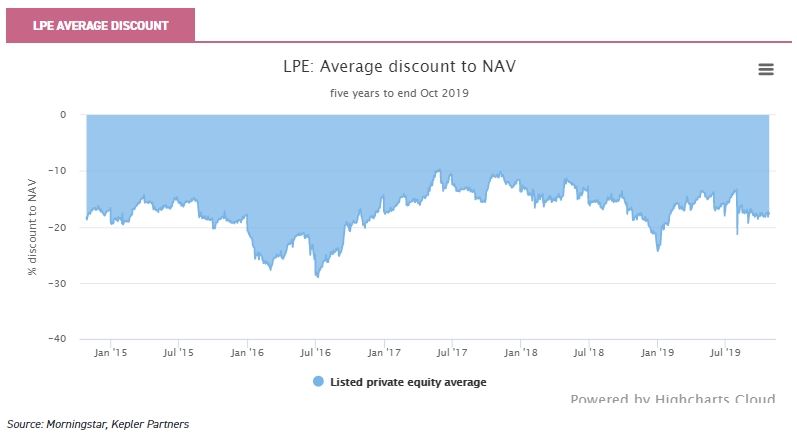
In some ways, the market has not yet fully recovered from the trauma of the GFC; discounts to NAV remain pervasive in the LPE sector. As the chart below shows, the average discount to NAV (for those trusts not in wind-up and excluding 3i) was around 16% at 30 October 2019. This number is roughly in line with where it was five years ago, despite the public equity market beating returns from the sector over that time.
The current discounts, therefore, provide an element of safety margin. And a further safety element is what we believe to be inherent conservatism in valuations, which is a consistent feature of private equity managers. The experience of Electra, placed into wind-up by Sherborne, illustrates the valuation gap between carrying value and realised value.
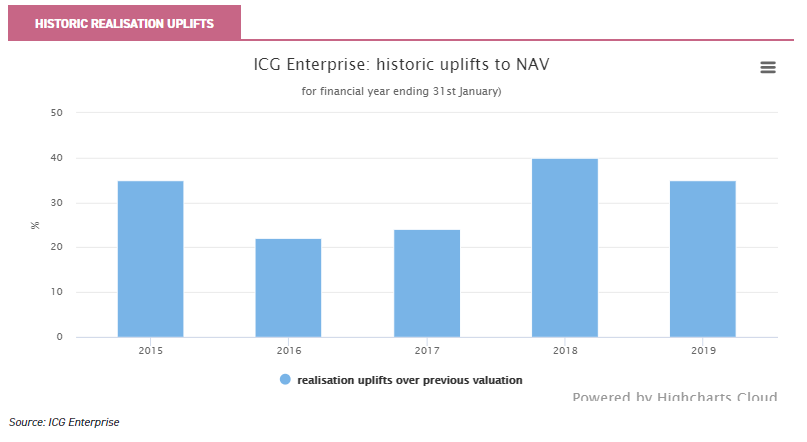
For almost all LPE constituents, London Stock Exchange RNS announcements reveal that whenever a holding is sold it is almost always at an uplift to the previous valuation. For example, in the six months to July 2019, ICG Enterprise Trust (LSE:ICGT) announced realisations of 25 underlying holdings, at an average uplift of 33% to the previous valuation.
The experience of the last five years is evident in the table below, which depicts ICG Enterprise's portfolio of both directly invested and third-party private equity managers. Only a proportion of any LPE portfolio is sold in any one year, but we believe that this data provides further evidence that conservative valuations lurk behind NAVs.
Learning the lessons of the past
Notwithstanding discounts and an element of conservatism in valuations, some LPE trusts suffered a very poor GFC and permanently eroded their capital. Consequently a certain amount of wariness might be appropriate in what is sometimes a slightly opaque sector, relative to public equity funds. It certainly makes sense to research as thoroughly as possible, and try to identify potential vulnerabilities that will exacerbate a downward leg of the cycle.
Aside from valuations changing, leverage was a key component of what went wrong in the GFC. Those survivors of the listed private equity sector who made it through the GFC unscathed typically did so because they were not overstretched financially; either through over-commitments, or through having underlying companies that were not too highly leveraged.
We believe many of the lessons of the past have not been forgotten by the managers, and as a result there are good reasons why, this time, it really will be different.
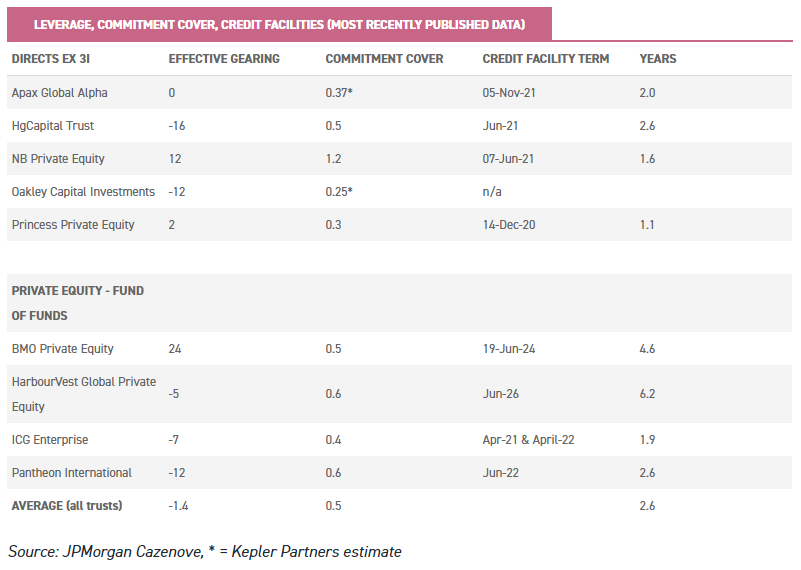
Leverage, or more accurately, having an overdraft facility ready in case they might need it, is part of most LPE sector firms' investment strategy. The table below shows that on average the LPE trust sector has net cash of 1.4% of NAV. Monitoring leverage over time is crucial for investors.
Commitment cover is one way to do this, revealing the extent to which current commitments can be financed from cash and credit facilities in the absence of portfolio cashflows. It is commonly assumed that around 15% of commitments will never be called, and so it is not a precise measure by any means.
However when we reproduce statistics from JPMorgan Cazenove, they demonstrate that average commitment cover is 0.5. Investors should also monitor how long any credit facilities extend, so that trusts don't suddenly run out of firepower should realisations stop coming through. The average trust has an outstanding facility term of 2.6 years.
In terms of underlying leverage, research from Jefferies published in September 2019 shows that within a sample of trusts (Apax (LSE:APAX), HgCapital Trust (LSE:HGT), HarbourVest (LSE:HVPE), ICG Enterprise, NB Private Equity and Pantheon (LSE:PANR)), underlying leverage in portfolio investments has not increased significantly over five years. The Jefferies research indicates that the average net debt to EBITDA multiple is currently 4.6X, representing a 0.2 point increase from five years ago. We believe that the statistics show that LPE trusts are not themselves overly levered; nor are their underlying portfolios.
Valuations
Valuations, and corrections to valuations, are an obvious potential hazard for LPE investors. The data is reassuring, however, in that valuations do not currently look far out of line with public markets, and have not seen much of an increase over the past five years. In Jefferies' September research, they observed that outside of Apax Global Alpha and HGT, portfolio valuation multiples have only seen a relatively small uptick over the past five years.
Few trusts provide a full look through of their entire portfolios, and so valuations are usually taken from a sample; the constituents of which change over time. However, Jefferies' research does indicate that EV / EBIDTA multiples for Harbourvest, ICG Enterprise and NB Private Equity have only seen limited expansion of this multiple over five years; currently they stand at 11.2x, 11.6x and 11.6x respectively.
Public markets in the US and Europe, in comparison, have seen the multiple expand over the past five years, by between 1.5 and 2.5 'turns' (or multiple points). This is illustrated in the chart below; of course since 2016 the FTSE All Share (ASX) story is rather different to the other markets.
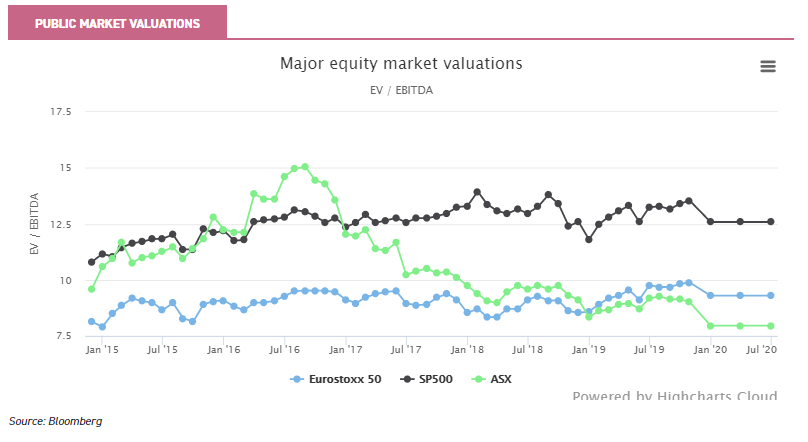
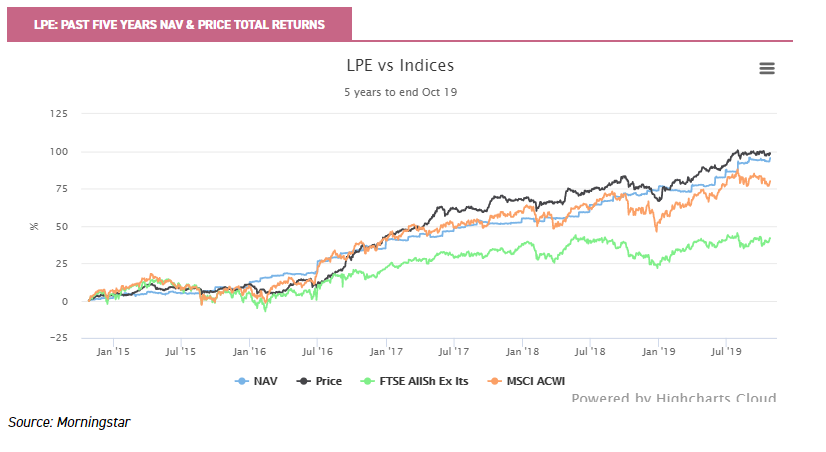
The fact that overall valuations have not markedly changed over five years is encouraging in the context of the graph below, which shows LPE outperforming public markets. This suggests that, in contrast to public markets, it is fundamentals (including earnings growth) that are driving returns, and are therefore potentially more sustainable at the current stage of the economic cycle.
Underlying exposure is different to public markets
There is another reason why we believe investors should be reassured that this time really will be different: the differences in business composition typically between LPE trusts and public markets.
Firstly, we believe there is anecdotal evidence that LPE managers are positioning themselves for a potential downturn in global growth, while also recognising that there is a cycle and remaining mindful of the time elapsed since the GFC. Several managers we have spoken to noted that they are tilting their investment process towards companies better equipped for a lower growth environment. ICG Enterprise, for example, report that they "favour more defensive businesses", aiming to invest in companies that are uncorrelated to economic cycles, are cash-generative, and have high barriers to entry.
Time will tell in the performance numbers, but as we examined in a recent piece on ICG Enterprise, LPE trusts tend to have very different underlying exposures than listed markets. Our analysis indicates that ICGT is less exposed to cyclical industries, such as oil, gas and financials, compared to the FTSE All Share Index. ICGT instead maintains higher weightings towards sectors with greater defensive characteristics, such as healthcare and education.
Secondly, there is potentially a market cap effect that differentiates LPE companies from those found in public markets. Companies typically owned by private equity tend to be significantly smaller than listed companies.
According to Neuberger Berman, 'mega-cap' deals (using private equity definitions) currently average $0.6 billion in market capitalisation; this compares to an average market cap of $0.7 billion in the Russell 2000, and $8 billion in the Russell mid-cap.
Oakley Capital Investments (LSE:OCI), for example, considers UK and continental European "mid-cap" companies to have an enterprise value (at the time of investment) of between €100 million and €400 milliom. Yet in the context of public equity markets, these sorts of companies are very much at the small end of "small-cap".
Oakley believe that companies at this scale are significantly more dynamic than larger firms, and capable of very significant growth trajectories; as witnessed by the 31% average EBITDA growth seen across the portfolio during the first six months of 2019.
Conclusion
De-equitisation means that investors in public markets are getting access to an increasingly narrow and shallow pool of investments. This is thanks to buybacks, a dearth in non-tech IPOs, and further reductions in the pool from M&A and 'take private' deals – particularly in small and mid-caps.
Why investors are happy to pay high premiums for trusts offering exposure to the high risk end of the private market, when on a relative basis the LPE sector arguably offers exposure to less high risk businesses, as well as a demonstrable track record of outperforming markets, is a mystery to us.
We believe the superior growth delivered by LPE trusts over the past five years has been proven not to do with financial engineering, and instead reflects a solid operating performance from niche businesses that who have the flexibility and the backing of long-term capital; this enables them to achieve strong earnings growth away from the distractions that public markets bring.
That is not to say that high growth is absent from these portfolios. As we highlight in our recently published note on Oakley Capital Investments (OCI) – which focuses almost exclusively on the TMT, education and consumer sectors – several companies in its portfolio are experiencing explosive earnings growth thanks to their niches and the specific growth drivers they are exploiting.
The managers highlight two companies with significant momentum: Career Partner Group (8.2% of NAV) and WebPros (6.5%). A highly concentrated portfolio presents plenty of risks, but if the main return drivers are able to continue on their current trajectory, they should continue to boost performance for investors in OCI in the short to medium term.
In contrast to our selection of trusts currently trading at premiums, LPE sector discounts offer compelling value if they can continue to deliver strong returns on an absolute and relative basis.
Discounts in the LPE sector are likely to take time to narrow, and progress will likely be impeded by the higher 'cost' of LPE. [The reality is very far from the optics of the Key Information Document Reduction In Yield figures, which in some cases reach 6+%, because it includes performance fees paid for the strong performance generated historically]. However we believe investors who are looking to exploit the strong growth that private companies can deliver would be well placed to examine the underappreciated LPE sector; rather than chasing those trusts that trade on heady premiums and which, in some cases, are untested through the cycle.
In time, it is quite possible that investors will question why they chose to inhabit the parallel world of premium growth, when they could just as easily have occupied the arguably lower risk, and ultimately more rewarding, world of listed private equity.
Kepler Partners is a third-party supplier and not part of interactive investor. Neither Kepler Partners or interactive investor will be responsible for any losses that may be incurred as a result of a trading idea.
Full performance can be found on the company or index summary page on the interactive investor website. Simply click on the company's or index name highlighted in the article.
Important Information
Kepler Partners is not authorised to make recommendations to Retail Clients. This report is based on factual information only, and is solely for information purposes only and any views contained in it must not be construed as investment or tax advice or a recommendation to buy, sell or take any action in relation to any investment.
This report has been issued by Kepler Partners LLP solely for information purposes only and the views contained in it must not be construed as investment or tax advice or a recommendation to buy, sell or take any action in relation to any investment. If you are unclear about any of the information on this website or its suitability for you, please contact your financial or tax adviser, or an independent financial or tax adviser before making any investment or financial decisions.
The information provided on this website is not intended for distribution to, or use by, any person or entity in any jurisdiction or country where such distribution or use would be contrary to law or regulation or which would subject Kepler Partners LLP to any registration requirement within such jurisdiction or country. Persons who access this information are required to inform themselves and to comply with any such restrictions. In particular, this website is exclusively for non-US Persons. The information in this website is not for distribution to and does not constitute an offer to sell or the solicitation of any offer to buy any securities in the United States of America to or for the benefit of US Persons.
This is a marketing document, should be considered non-independent research and is subject to the rules in COBS 12.3 relating to such research. It has not been prepared in accordance with legal requirements designed to promote the independence of investment research.
No representation or warranty, express or implied, is given by any person as to the accuracy or completeness of the information and no responsibility or liability is accepted for the accuracy or sufficiency of any of the information, for any errors, omissions or misstatements, negligent or otherwise. Any views and opinions, whilst given in good faith, are subject to change without notice.
This is not an official confirmation of terms and is not to be taken as advice to take any action in relation to any investment mentioned herein. Any prices or quotations contained herein are indicative only.
Kepler Partners LLP (including its partners, employees and representatives) or a connected person may have positions in or options on the securities detailed in this report, and may buy, sell or offer to purchase or sell such securities from time to time, but will at all times be subject to restrictions imposed by the firm's internal rules. A copy of the firm's conflict of interest policy is available on request.
Past performance is not necessarily a guide to the future. The value of investments can fall as well as rise and you may get back less than you invested when you decide to sell your investments. It is strongly recommended that Independent financial advice should be taken before entering into any financial transaction.
PLEASE SEE ALSO OUR TERMS AND CONDITIONS
Kepler Partners LLP is a limited liability partnership registered in England and Wales at 9/10 Savile Row, London W1S 3PF with registered number OC334771.
Kepler Partners LLP is authorised and regulated by the Financial Conduct Authority.
Kepler Partners is a third-party supplier and not part of interactive investor. Neither Kepler Partners or interactive investor will be responsible for any losses that may be incurred as a result of a trading idea.
These articles are provided for information purposes only. Occasionally, an opinion about whether to buy or sell a specific investment may be provided by third parties. The content is not intended to be a personal recommendation to buy or sell any financial instrument or product, or to adopt any investment strategy as it is not provided based on an assessment of your investing knowledge and experience, your financial situation or your investment objectives. The value of your investments, and the income derived from them, may go down as well as up. You may not get back all the money that you invest. The investments referred to in this article may not be suitable for all investors, and if in doubt, an investor should seek advice from a qualified investment adviser.
Full performance can be found on the company or index summary page on the interactive investor website. Simply click on the company's or index name highlighted in the article.
Important Information
Kepler Partners is not authorised to make recommendations to Retail Clients. This report is based on factual information only, and is solely for information purposes only and any views contained in it must not be construed as investment or tax advice or a recommendation to buy, sell or take any action in relation to any investment.
This report has been issued by Kepler Partners LLP solely for information purposes only and the views contained in it must not be construed as investment or tax advice or a recommendation to buy, sell or take any action in relation to any investment. If you are unclear about any of the information on this website or its suitability for you, please contact your financial or tax adviser, or an independent financial or tax adviser before making any investment or financial decisions.
The information provided on this website is not intended for distribution to, or use by, any person or entity in any jurisdiction or country where such distribution or use would be contrary to law or regulation or which would subject Kepler Partners LLP to any registration requirement within such jurisdiction or country. Persons who access this information are required to inform themselves and to comply with any such restrictions. In particular, this website is exclusively for non-US Persons. The information in this website is not for distribution to and does not constitute an offer to sell or the solicitation of any offer to buy any securities in the United States of America to or for the benefit of US Persons.
This is a marketing document, should be considered non-independent research and is subject to the rules in COBS 12.3 relating to such research. It has not been prepared in accordance with legal requirements designed to promote the independence of investment research.
No representation or warranty, express or implied, is given by any person as to the accuracy or completeness of the information and no responsibility or liability is accepted for the accuracy or sufficiency of any of the information, for any errors, omissions or misstatements, negligent or otherwise. Any views and opinions, whilst given in good faith, are subject to change without notice.
This is not an official confirmation of terms and is not to be taken as advice to take any action in relation to any investment mentioned herein. Any prices or quotations contained herein are indicative only.
Kepler Partners LLP (including its partners, employees and representatives) or a connected person may have positions in or options on the securities detailed in this report, and may buy, sell or offer to purchase or sell such securities from time to time, but will at all times be subject to restrictions imposed by the firm's internal rules. A copy of the firm's conflict of interest policy is available on request.
Past performance is not necessarily a guide to the future. The value of investments can fall as well as rise and you may get back less than you invested when you decide to sell your investments. It is strongly recommended that Independent financial advice should be taken before entering into any financial transaction.
PLEASE SEE ALSO OUR TERMS AND CONDITIONS
Kepler Partners LLP is a limited liability partnership registered in England and Wales at 9/10 Savile Row, London W1S 3PF with registered number OC334771.
Kepler Partners LLP is authorised and regulated by the Financial Conduct Authority.
These articles are provided for information purposes only. Occasionally, an opinion about whether to buy or sell a specific investment may be provided by third parties. The content is not intended to be a personal recommendation to buy or sell any financial instrument or product, or to adopt any investment strategy as it is not provided based on an assessment of your investing knowledge and experience, your financial situation or your investment objectives. The value of your investments, and the income derived from them, may go down as well as up. You may not get back all the money that you invest. The investments referred to in this article may not be suitable for all investors, and if in doubt, an investor should seek advice from a qualified investment adviser.
Full performance can be found on the company or index summary page on the interactive investor website. Simply click on the company's or index name highlighted in the article.