Why these two alternative income sectors look enticing
Kepler Trust Intelligence evaluates the lure of bonds and explains why investors might instead do better by turning to two trust sectors.
11th August 2023 14:02

This content is provided by Kepler Trust Intelligence, an investment trust focused website for private and professional investors. Kepler Trust Intelligence is a third-party supplier and not part of interactive investor. It is provided for information only and does not constitute a personal recommendation.
Material produced by Kepler Trust Intelligence should be considered a marketing communication, and is not independent research.
Last week, in the face of discounts for real asset alternative investment trusts widening to “never-before-seen” levels, my colleague Alan took a step back and re-examined what “alternative income” trusts really represent. In summary, they represent something between an equity and a bond. They offer a relatively predictable income stream, but in contrast to conventional bonds, offer the potential for real returns given their inflation-linked income.
- Invest with ii: Invest in Investment Trusts | Top UK Shares| Interactive investor Offers
Alternative income has been a huge growth area for the investment trust sector, spawning a vast array of different new asset classes for investors to access. While many of the alternative income sub-sectors and strategies within them offer the prospect of good risk-adjusted returns, a high running yield (amid the backdrop of zero or negative yields on government bonds) goes a long way towards explaining why investor appetites for these trusts have been so voracious.
As we show below, the total amounts invested in alternative income investment trusts have been staggering. We exclude for the purposes of this article the £7.9 billion of net assets currently in the AIC’s Debt sectors including Loans & Bonds, Direct Lending, Structured Finance, Property Debt, and Leasing, given the exposures within these sectors are largely fixed income. We believe it is not a controversial statement to say that a significant amount of the capital raised within all these sectors came from that either previously invested in bonds, or cash deposits (in the case of retail investors). Given the discounts that each sub-sector below trades at, there is theoretically ‘value’ on offer to shareholders of a total of circa £7.7 billion if in these sectors, the trusts’ share prices traded at NAV once again.
ALTERNATIVE INCOME SECTORS AS AT 31/07/2023
| AIC SECTOR | NET ASSETS (£BN) | WTD. AVERAGE DISCOUNT (%) |
| Royalties | 2.3 | 47.3 |
| Property - UK Direct | 3.2 | 34.4 |
| Infrastructure | 15.5 | 18.1 |
| Renewable Energy Infrastructure | 16.6 | 16.0 |
| Total/simple average | 37.6 | 29.0 |
Source: JPMorgan Cazenove
Now the genie of higher rates is out of the bottle, it is not surprising that there has been an unseemly scramble to leave the alternative income party, and join the (rather more staid) bond party next door as shown in the graph below. Maybe it’s less a party and more of a tea dance.
GLOBAL BOND FUND FLOWS
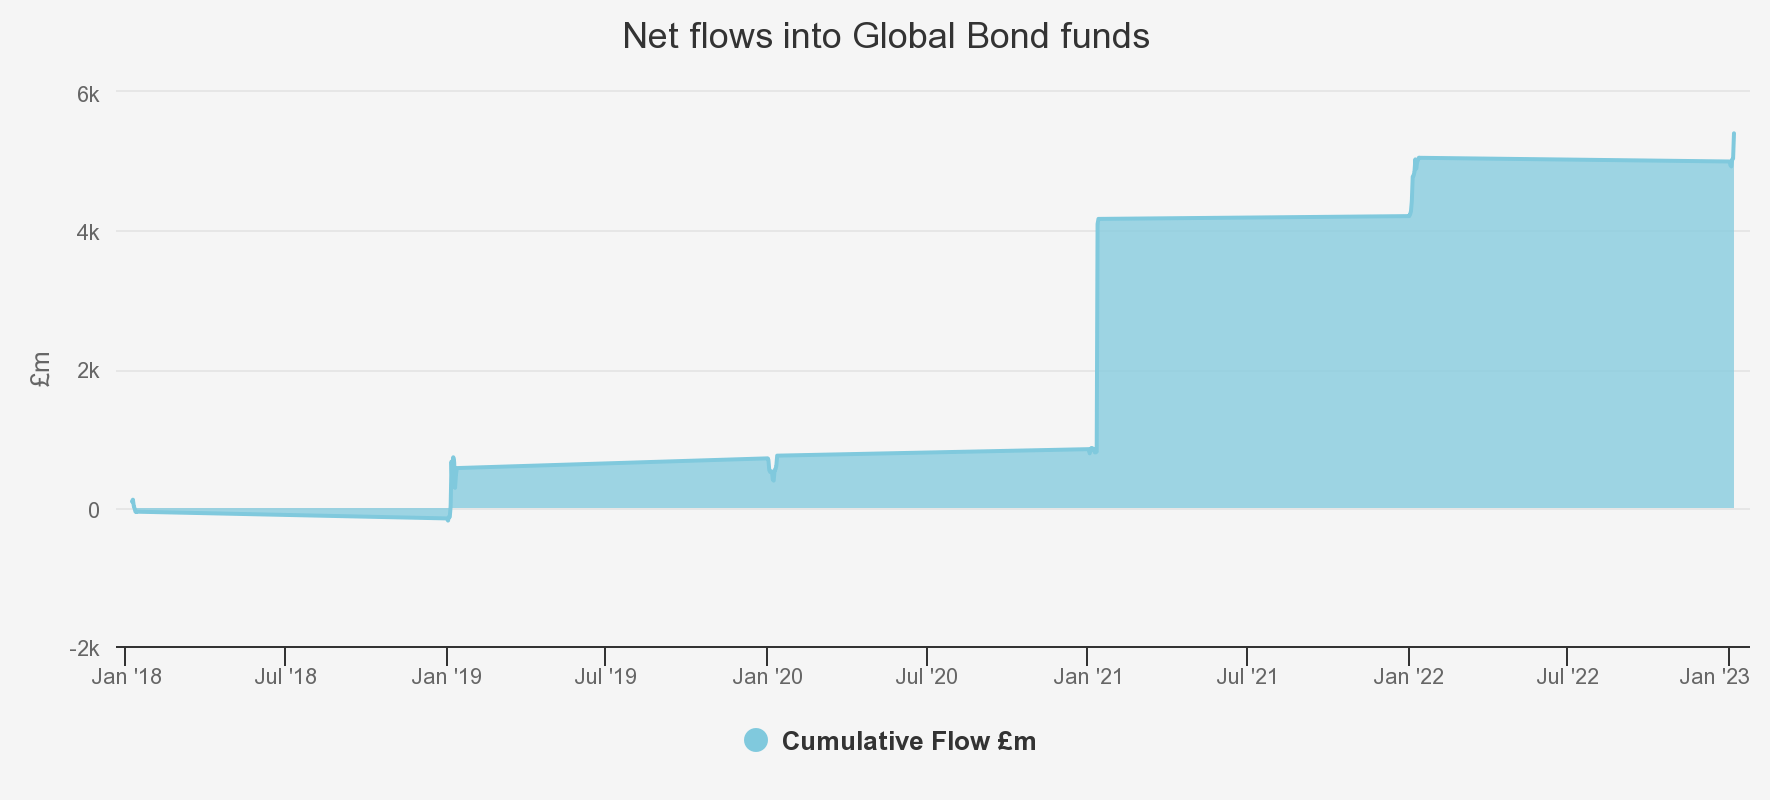
Source: Morningstar, as at 30/06/2023
Many investors might be left wondering what the prospects are for these alternative income trusts. Do current discounts accurately reflect prospects for this diverse set of trusts? Certainly, those trusts that are sensitive to the economic cycle and have high leverage may suffer from a hard economic landing.
Commercial property may be vulnerable in a significant recession, and with leverage forming a significant part of the capital structure – across the commercial property industry, not just investment trusts and REITs – there are clearly headwinds the sector faces from re-adjusting to the new higher interest rate environment. Over time, rent from property grows, and although UK leases don’t tend to have inflation indexation, there is a long-term correlation with inflation. We examined the case for wide discounts in this article, but to see discounts narrow, we believe we need to see rental growth coming through strongly, or gilt yields falling.
Music royalty trusts (of which there are two) have suffered from sector-specific issues, in our view related mainly to a lack of investor understanding of the asset class. Discounts for both trusts are very wide, and it is possible that the trusts in the sector need to shrink first before they can grow, proving their portfolio valuations and de-leveraging, as well as creating rarity value for their shares.
As regards the infrastructure and renewable energy infrastructure sectors – which constitute 85% of the £38 billion of net assets in the table above, one can credibly argue that these trusts have low economic sensitivity, yet now trade on significantly wide discounts. The more established trusts within these sectors tend to have highly diversified portfolios, which means that aside from asset class risk, there are few specific risks. The advantage of well-established portfolios with breadth of exposure is that it allows managers to continue to add accretive investments (either through selling other investments or through reinvestment of surplus cashflow) at attractive returns, without significantly skewing the overall risks of the portfolio. Examples include HICL Infrastructure (LSE:HICL), which has been repositioning the portfolio away from PPP assets (which are a well-understood investment class within infrastructure, and attract highly competitive prices when sold) into less well-understood investments which have a higher correlation to inflation and offer longer-term cashflows.
A recent example within HICL’s portfolio is Fortysouth, which represents the passive infrastructure of Vodafone New Zealand, including the physical towers, masts, and poles. The asset has an availability-based contract with Vodafone NZ for an initial 20-year term, with the option of two 10-year extensions and revenues are inflation-linked and unrelated to usage. It is through investments like these that HICL’s managers aim to build out HICL’s earnings base long into the future, such that the weighted average life of the portfolio has increased from 21 years to 32 years since 2015.
Relative returns remain attractive
This brings us to one of our main observations, which is that while the attractions of short-term bonds have significantly increased this year, the yields on offer at the longer end of the curve, which are much more comparable to infrastructure and renewable energy infrastructure trusts, have moved significantly less far.
In the graph below, we illustrate the fact that over six months to 30 June 2023, it is short-term interest rate expectations that have risen the most dramatically. On a 10-year maturity, gilt yields have risen by only 56bps over the first half of the calendar year, and since the end of June have actually stepped back a small amount to 4.24% (as of 28/07/2023).
UK GILTS YIELD CURVE
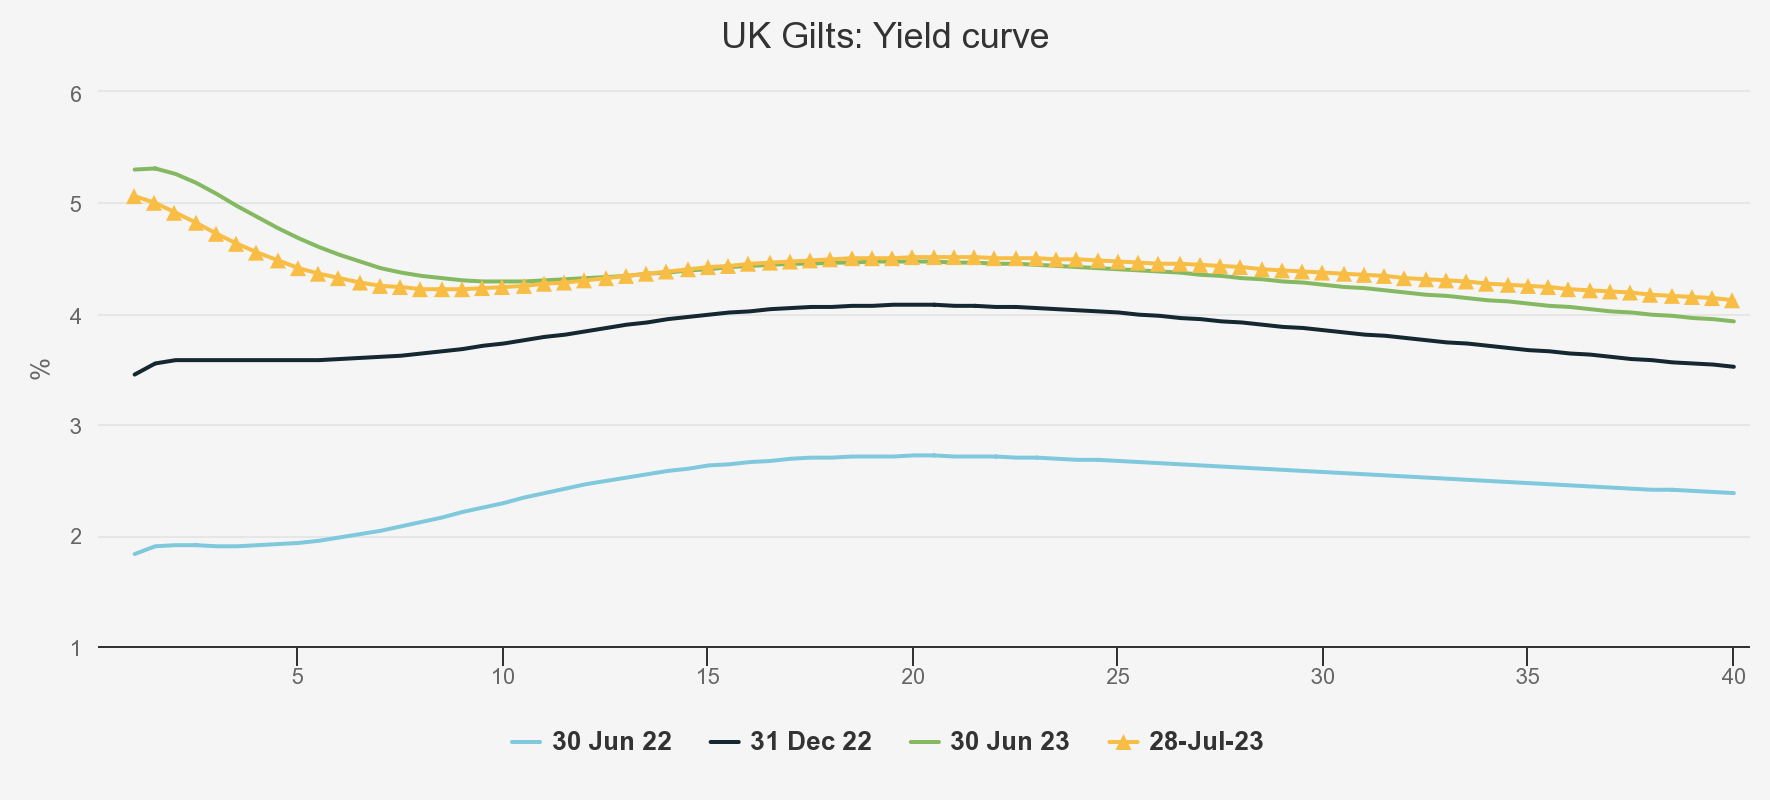
Source: Bank of England
Bond GRYs show the IRR if held to redemption. How do infrastructure and renewable energy trust IRRs compare? Helpfully, infrastructure and renewable energy infrastructure trusts publish their portfolio’s weighted average discount rates periodically. Discount rates (not to be confused with share price discounts to NAV) represent the expected long-term total returns, or IRR, from the portfolio of assets based on a number of long-term assumptions. Investors need to adjust this discount rate (which is gross), deduct the annual ongoing charges, and adjust for the effect of any trust level gearing and interest costs to arrive at estimated NAV total returns.
For example BBGI Global Infrastructure (LSE:BBGI), which sits at the lower risk end of the listed infrastructure peer group, has a last published portfolio discount rate of 6.9% (as of 31/12/2022) and an OCF of 0.87. The fact that BBGI has no expectation of trust level gearing over the long term makes the calculation simple. We deduct the OCF from the portfolio discount rate to get to the expected NAV IRR of 6.03%. We note that this return is very far from guaranteed.
First, achieving this IRR requires that operationally all of the assets perform as expected and that there are no changes to underlying assumptions. Second, comparing IRRs between trusts only makes sense if the underlying assumptions are all the same: unfortunately, trusts do not spell out in detail all their assumptions, so the best that anyone can do is estimate how these assumptions differ. Finally, we would note that trusts release NAVs and discount rate information at different times. For example, Renewables Infrastructure Group (LSE:TRIG) has very recently released an increased portfolio discount rate of 7.9% as of 30/06/2023 (up from 7.2% six months ago), while HICL’s latest discount rate is as of 31/03/2023. HICL has announced in a trading update that it expects the discount rate to increase when it reports a NAV as of 30/09/2023, but that the negative effect on the NAV will be materially offset by the impact of higher or actual inflation.
We show below the latest published discount rates for the main trusts in the sector. As we noted above, each trust is subject to different risks and underlying assumptions, and several trusts may yet increase their discount rates. Differing underlying assumptions mean that the IRRs in the table below are not exactly comparable but represent a ballpark illustration of prospective returns. Additionally, for those with trust level gearing, returns may be higher still. For example, Greencoat UK Wind (LSE:UKW) spelt out the difference between its unlevered discount rate (which we reproduce below) and the levered discount rate of 11% (and a NAV IRR of circa 10%), which assumes current levels of gearing are maintained into the future. UKW is currently geared 36% on a gross assets basis, or circa 50% on a NAV basis. Hence the higher prospective IRR than the 8.1% prospective IRR we show in the table below, which represents potential upside. We would point out that these extra returns do not of course come without extra risks, which include refinancing risk. Trusts which invest in levered assets through SPVs, usually have fixed interest rates within these structures over the life of the subsidy regime, and also repay this debt over the same period.
Currently, with share prices below NAVs, if logic has anything to do with it the market is clearly applying either higher discount rates, expecting lower power prices, or lower inflation than assumed by these trusts. We note that the IRRs below, without accounting for trust level gearing, look attractive in the context of long-term equity returns, and note that historically these returns have been achieved with significantly lower volatility than equity markets exhibit. One might hope for discounts to narrow over any holding period, further adding to prospective returns.
DISCOUNT RATES & PROSPECTIVE NAV IRRS AS OF 04/08/2023
| WTD. AVERAGE DISCOUNT RATE (%) | OCF (%) | NET PROSPECTIVE NAV IRR (%) | |
| Infrastructure | |||
| BBGI | 6.9 | 0.87 | 6.0 |
| HICL | 7.2 | 1.09 | 6.1 |
| Internal Public Participations (INPP) | 7.5 | 1.06 | 6.5 |
| 3i Infrastructure | 11.3 | 1.64 | 9.7 |
| Renewable energy infrastructure | |||
| Bluefield Solar | 7.25 | 1.04 | 6.2 |
| Foresight Solar | 7.16 | 1.14 | 6.0 |
| Greencoat UK Wind | 9.0 | 0.93 | 8.1 |
| NextEnergy Solar | 7.3 | 1.06 | 6.2 |
| TRIG | 7.9 | 0.93 | 7.0 |
Source: Kepler Partners from company announcements
As these figures show, while the dividend yields of the infrastructure and renewable energy infrastructure sectors (weighted average yield of 5.9% and 6.4% respectively) offer a small premium to yields on short-term government bonds, in our view, it is the prospective NAV total returns that investors should be focusing on.
Comparing prospective IRRs to long-term gilts, based on current long-term assumptions, represent at least 200bp above long-term gilts, and in many cases significantly more. In the property world, a spread of 200bp over long-term gilts is considered a good rule of thumb for the higher returns to compensate for the extra risk of property, which helps explain the almost instant stock market reaction seen in the prices of REITs when interest rates started rising. Commercial property isn’t, of course, the same as infrastructure, but arguably much infrastructure and renewables infrastructure is lower risk, so this spread makes for an interesting observation.
Apples vs oranges
This brings us to our second, and one might argue, most important point. For the most part, infrastructure and renewable energy infrastructure trusts have a good degree of inflation protection built into their cashflows. This means that compared to the nominal (and fixed) returns offered by government bonds, these trusts offer a real return. Inflation directly impacts the cashflows, and therefore (all things being equal) helps to contribute to dividend cover and potentially dividend growth. By comparison, fixed income offers the prospect of…well, fixed income.
To any extent that inflation exceeds inflation assumed, there will be surplus cashflows over and above budget, which will either contribute to growing the NAV or enable further dividend growth. UK inflation is worthy of note, given it has been considerably higher than the expectations of both listed funds and the Bank of England. Higher inflation reflected in cashflows today has a ratchet effect on cashflows in all future periods, which will have a lasting impact on dividend cover, and therefore the potential for reinvestment and capital growth.
To illustrate the point, UKW’s interim results included for the first time an analysis of dividend cover in different scenarios for long-term power prices, illustrating the trust’s potential to deliver total returns significantly ahead of the dividend yield. The significant contribution to cashflows from the inflation-linked fixed revenue base means that dividend cover is extremely robust, even in the face of significantly lower power prices. For example, the managers illustrated in the table below that a dividend that continues to increase with RPI is covered down to £10/MWh over the next five years. For context, for the week of 24/07/2023, UK wholesale electricity prices were £72/MWh. Since the start of 2016, the average monthly wholesale ‘day ahead’ electricity price in the UK has been circa £76/MWh. The month of July 2023 saw an average price of £70/MWh, the lowest average monthly price since the lockdown affected the month of April 2021.
In our view, this should provide reassurance to investors on both the ability of the trust to continue to pay an attractive dividend, but also that barring a significantly lower power price, UKW will continue to have surplus cash to reinvest, providing good total NAV returns as well as a high and growing dividend. In fact, this gives credence to the manager’s assertion that UKW’s model is self-funding, which is useful in the context of current discounts to NAV which likely prohibits further equity issuance.
UKW DIVIDEND COVER SCENARIO ANALYSIS
| 2024 | 2025 | 2026 | 2027 | 2028 | |
| RPI increase (%) | 7.0 | 3.5 | 3.5 | 3.5 | 3.5 |
| Dividend (pence/share) | 9.37 | 9.7 | 10.04 | 10.39 | 10.76 |
| Dividend cover (x): | |||||
| UKW power forecasts | 2.3 | 2.4 | 2.3 | 2.4 | 2.4 |
| £50/MWh | 1.8 | 1.9 | 2 | 2 | 2.1 |
| £30/MWh | 1.4 | 1.5 | 1.5 | 1.5 | 1.5 |
| £10/MWh | 1.0 | 1.1 | 1.0 | 1.0 | 0.9 |
Source: Schroders Greencoat, All numbers illustrative. Power prices real 2022, pre PPA discounts
How inflation compares to assumptions is a key driver of returns. UKW state that 1% higher inflation over all future time periods will result in a one percentage point higher IRR (all else being equal). In the table above we show the current assumptions underpinning UKW’s valuation, but note that in this table, UKW’s underlying inflation linkage is backwards looking. As such, 2024’s assumption of 7% RPI growth is not heroic, given it refers to the average RPI figure for 2023 – a period in which UK inflation has remained stubbornly high so far. These assumptions are in-line with TRIG’s RPI assumptions over this period. That said, other trusts may have different (or not updated) assumptions, which highlights the difficulty in directly comparing discount rates/prospective IRRs. The above inflation assumptions are relatively conservative compared to the market’s expectation (taking the difference in yield between conventional and inflation-linked gilts), which implies that UK inflation will be between 3 and 3.5% over the next 40 years.
In all of this, it is important to remember that these are prospective returns, and in no way reflect any guarantee. Within the renewable energy infrastructure universe, other than inflation, investors need to be prepared to take on risks that long-term interest rates will rise further (thereby increasing the discount rate, and reducing the NAV), inflation may fall, or energy prices will not remain firm. All of these factors, and others, will have impacts on prospective returns. In theory, at least, there is an element of circularity between interest rates and inflation (as we have seen, high inflation prompts central banks to raise interest rates and vice versa), which will mitigate NAV falls if interest rates rise as a result of inflation.
By comparison, the infrastructure sector has fewer moving parts, and this partly explains the lower prospective IRRs shown in the table above (i.e. less risk, so lower prospective returns). At the lowest end of the risk spectrum, BBGI invests purely in availability-based assets, which has enabled it to translate higher inflation directly into higher dividend forecasts. On the other hand, HICL’s manager has been rebalancing away from PPP assets to capture longer-term cash flows with greater growth and/or inflation linkage, which tend to initially provide lower yields. We understand that these investments have been made with a view towards building out HICL’s earnings base for the future. Over time, the manager’s investment activity has enhanced the portfolio’s cash flow and long-term earnings profile. As we discuss in a recent note, there is a case to be made that HICL shareholders are forgoing jam today in order to build the foundations of future dividend growth, long into the future.
As we note from HICL’s example, it is important to note that higher inflation doesn’t necessarily translate into higher future dividends. The future path of dividend increases for all trusts will reflect what boards see as the balance between paying a sustainable dividend for the long term and the reinvestment of surplus cashflows, against the desire to provide a progressive dividend that grows over time. What we illustrate here is that all things being equal, inflation directly enhances total returns, whether in the form of a higher dividend or through reinvestment and therefore capital growth.
Conclusion
In our view, higher interest rates have done nothing to negatively affect the fundamentals for infrastructure and renewable energy infrastructure trusts, yet they have suffered a significant de-rating. As we have shown, higher interest rates coming as a result of higher inflation can actually be seen as a positive, especially for new investors in these listed vehicles who are now able to put capital to work at higher prospective IRRs, and a discount to NAV.
We illustrate that prospective returns are not only significantly ahead of long-term government bonds, but also that they provide a real, not a nominal return. Investors may therefore decide to decline the Bank of England’s enticing invitation to lend money to UK Plc, and instead attract potentially higher real returns from the infrastructure and renewable energy infrastructure trusts, whose prospective returns look in our view enticing on a relative and absolute basis.
Kepler Partners is a third-party supplier and not part of interactive investor. Neither Kepler Partners or interactive investor will be responsible for any losses that may be incurred as a result of a trading idea.
These articles are provided for information purposes only. Occasionally, an opinion about whether to buy or sell a specific investment may be provided by third parties. The content is not intended to be a personal recommendation to buy or sell any financial instrument or product, or to adopt any investment strategy as it is not provided based on an assessment of your investing knowledge and experience, your financial situation or your investment objectives. The value of your investments, and the income derived from them, may go down as well as up. You may not get back all the money that you invest. The investments referred to in this article may not be suitable for all investors, and if in doubt, an investor should seek advice from a qualified investment adviser.
Full performance can be found on the company or index summary page on the interactive investor website. Simply click on the company's or index name highlighted in the article.
Important Information
Kepler Partners is not authorised to make recommendations to Retail Clients. This report is based on factual information only, and is solely for information purposes only and any views contained in it must not be construed as investment or tax advice or a recommendation to buy, sell or take any action in relation to any investment.
This report has been issued by Kepler Partners LLP solely for information purposes only and the views contained in it must not be construed as investment or tax advice or a recommendation to buy, sell or take any action in relation to any investment. If you are unclear about any of the information on this website or its suitability for you, please contact your financial or tax adviser, or an independent financial or tax adviser before making any investment or financial decisions.
The information provided on this website is not intended for distribution to, or use by, any person or entity in any jurisdiction or country where such distribution or use would be contrary to law or regulation or which would subject Kepler Partners LLP to any registration requirement within such jurisdiction or country. Persons who access this information are required to inform themselves and to comply with any such restrictions. In particular, this website is exclusively for non-US Persons. The information in this website is not for distribution to and does not constitute an offer to sell or the solicitation of any offer to buy any securities in the United States of America to or for the benefit of US Persons.
This is a marketing document, should be considered non-independent research and is subject to the rules in COBS 12.3 relating to such research. It has not been prepared in accordance with legal requirements designed to promote the independence of investment research.
No representation or warranty, express or implied, is given by any person as to the accuracy or completeness of the information and no responsibility or liability is accepted for the accuracy or sufficiency of any of the information, for any errors, omissions or misstatements, negligent or otherwise. Any views and opinions, whilst given in good faith, are subject to change without notice.
This is not an official confirmation of terms and is not to be taken as advice to take any action in relation to any investment mentioned herein. Any prices or quotations contained herein are indicative only.
Kepler Partners LLP (including its partners, employees and representatives) or a connected person may have positions in or options on the securities detailed in this report, and may buy, sell or offer to purchase or sell such securities from time to time, but will at all times be subject to restrictions imposed by the firm's internal rules. A copy of the firm's conflict of interest policy is available on request.
Past performance is not necessarily a guide to the future. The value of investments can fall as well as rise and you may get back less than you invested when you decide to sell your investments. It is strongly recommended that Independent financial advice should be taken before entering into any financial transaction.
PLEASE SEE ALSO OUR TERMS AND CONDITIONS
Kepler Partners LLP is a limited liability partnership registered in England and Wales at 9/10 Savile Row, London W1S 3PF with registered number OC334771.
Kepler Partners LLP is authorised and regulated by the Financial Conduct Authority.