Are you missing out on the complexity premium?
Can extra returns be earned by those ahead of the curve investing in new asset classes, asks Kepler.
21st May 2021 14:35
Can extra returns be earned by those who get ahead of the curve and invest in new asset classes, asks a Kepler analyst.

This content is provided by Kepler Trust Intelligence, an investment trust focused website for private and professional investors. Kepler Trust Intelligence is a third-party supplier and not part of interactive investor. It is provided for information only and does not constitute a personal recommendation.
Material produced by Kepler Trust Intelligence should be considered a marketing communication, and is not independent research.
Demand for alternative assets has soared in recent years, as investors have sought yield and low NAV volatility outside the bond market in a low interest rate world. The investment trust sector has been a major beneficiary, with many closed-ended funds offering these characteristics through their ability to invest in illiquid assets.
Historically, alternative assets have offered the potential for higher returns by (in technical terms) harvesting the illiquidity premium. In more natural language, this just means that investors pay lower prices for less liquid investments and therefore receive higher returns. Inevitably, the likelihood is that the wall of money coming into alternatives has eroded the returns available from investing in more established illiquid asset classes. In other words, the illiquidity premium has been reduced in some areas, with familiarity (and the ability to access an illiquid asset class through a more liquid closed-ended fund) meaning investors require less compensation for the higher risk of holding an illiquid asset.
Evidence of this can be seen in falling discount rates used to value assets, which reflects the compensation the market expects to earn on the assets in question. In the debt space, it can be seen in lower yields. Ultimately, perhaps closed-ended funds are the culprits, in that they have opened up markets that were formerly the preserve of institutional investors, allowing more capital to come in and compete away returns? Fundamentally, we view this as a good thing, in that a wider range of investors are now able to access return streams which were previously restricted to institutional elites – and of course capital is finding its way into vital and interesting new industries such as renewable energy or battery storage.
The market provides solutions when it is allowed to work, and we have seen a stream of investment companies launch providing access to newer (and sometimes more complicated) investments in order to offer higher returns than the more established alternatives.
Some analysts claim there is an extra complexity premium which can be earned in these new asset classes. We think this is a useful way to think about the returns available on new asset classes and how they are likely to change over time, and argue a complexity premium might be evident in the discounts of certain alternative investment classes.
In particular, we think this could be helpful in understanding the wide discounts on the listed private equity sector, which seem increasingly unjustified when compared to the premiums on trusts investing as a minority participant in early stage private companies.
The proof of the pudding
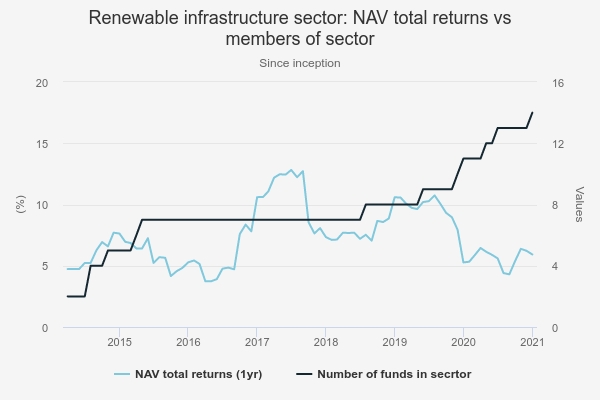
We think evidence of the illiquidity premium being eroded away over time as investors become more familiar with a new asset class can be seen in the renewables infrastructure sector.
The chart below shows rolling one-year NAV total returns from the sector since inception, in blue. We have overlaid the number of trusts in the sector in order to provide context. In the early months, there were very few constituents of the sector, making the data arguably less interesting, but the sector had grown to a mature size of seven members by March 2015. It takes time to invest capital in this space, which likely explains the relatively low returns in the early years, but by 2017 the weighted average NAV total return was above 12%. Since then it has declined steadily.
In the past two years, the number of funds has once again started to increase. These new launches have typically presented diversification in terms of offering, with managers branching out into solar or battery storage, and expanding into new markets overseas. Of course, new entrants do bring some uncertainty into the data – with newer trusts likely to generate lower returns as they get invested thanks to the effects of cash drag, bringing down the weighted average returns. We cannot therefore present this data as statistical proof of our thesis, but we think it is suggestive that as investors have become more familiar with the sector, they have been happy to accept lower returns.
We also think it fits with what we should expect to see theoretically – new money pushing down returns – and with the anecdotal evidence we hear from managers that diversifying abroad and by asset class in the renewables sector is one way to preserve higher return potential.
NAV total returns of renewable infrastructure trusts

Source: Morningstar
In the investment trust space, growing confidence in a sector can also be seen in the premium to NAV investors are willing to buy the trusts. The below chart shows the trend for higher premiums in the renewable energy infrastructure sector over the past five years as the new asset class was assimilated. The past year has seen this premium erode, perhaps due to concerns about falling power prices, and perhaps some recognition that the extremely high NAV total returns of the past few years may not repeat.
Premium of sector
Source: Morningstar
Illiquidity or complexity?
It seems plausible that illiquidity is becoming less lucrative overall thanks to the weight of demand for established asset classes, which would explain why there have been a number of new launches and strategies which say they are aimed at harvesting the ‘complexity premium’. This is the extra return available for investing in an asset class which is driven by the level of engagement needed in sourcing a deal or asset, and the skills and work needed to make it a success. The complexity premium can be found in more specialised and harder-to-access areas which require in-depth knowledge of specific areas, extensive networks of localised counterparties and ongoing engagement.
A good example is M&G Credit Income (LSE:MGCI), which launched in November 2018. MGCI’s key selling point is that it invests heavily in the private debt space, with investments in public bonds providing liquidity and also potentially offering higher risk-adjusted returns at different points in the cycle. Private debt is a great example of where a complexity premium can be found. Many of MGCI’s deals are one-to-one arrangements with a borrower which has specific needs and wishes to avoid the costs in time and money of borrowing in the public markets. To be able to facilitate this requires extensive specialist resources allowing analysis of the borrowers’ books and return and loss probabilities. It is only large institutions that can do this, and until recently there were few ways for retail investors to access the space – the investment trust sector represents an interesting bridge.
In a similar vein, NB Global Monthly Income (LSE:NBMI)also invests in the private debt space. NBMI is a bit more of a typical strategic bond fund with a broader opportunity set, including private debt. Its allocation to the space should be expected to be much lower, with a typical higher credit rating than MGCI – and therefore probably a higher yield over the cycle. It might be more appropriate as a straight replacement for a strategic bond fund or a holding for an investor wanting to moderate potential exposure to private investments. NBMI pays a monthly income and yields 5.4%, MGCI pays quarterly and yields 4.4%. MGCI pays three identical dividend payments a year with a higher final dividend. NBMI’s dividend target is set at the start of each year by the board and manager, reflecting how they see the state of the market; MGCI aims to pay LIBOR plus 4%. This compares to a current effective yield on the US High Yield market of 4.35%. Both trusts generate their yield with significantly lower credit risk. In the case of MGCI, it aims to generate the yield of a high yield product from a portfolio with an average investment grade credit rating, while NBMI’s credit rating is much higher than the high yield index (see our recent note). They therefore offer high yields without taking excessive credit risk and default risk by lending to secure borrowers via much more complex instruments.
One important feature of complex investments is that the acquisition costs of information are high. This means the pool of buyers is naturally limited to those with the scale to justify those costs. With fewer potential investors competing for investments, returns (all being equal) will be higher.
Rather than scale, specialisation is another tool managers can employ to invest in complex areas. Here the size of the opportunities may be lower. Private debt club loans or one-to-one deals are typically for the largest borrower, but the deals in the direct lending sub-sector are typically much smaller. The team at Pollen Street Capital, which manages Honeycomb Investment Trust (LSE:HONY)have a high level of expertise in this specific area. The core members have worked together since 2013, and have developed their own in-house software which allows them to track and monitor the performance of hundreds of underlying companies (lenders) they lend to. HONY aims to generate a dividend of 8% of NAV per annum, which has been maintained throughout the pandemic.
This may seem strange, as the portfolio includes exposure to personal loans as well as loans to small and medium sized SMEs, and so it might be assumed that credit risk is high. In fact, it would be natural to assume credit risk is what investors are compensated for. However, there are counter-intuitively defensive characteristics of the consumer and small business loans in the portfolio. Assuming the manager has selected good lenders to fund, many of the underlying books are made up of very short-term loans of a few months, and so the lenders can stop lending and start to run the lending book down at the first sign of trouble. Furthermore, premium lenders – high street banks and similar operators – will shut up shop at the first hint of trouble. This means they effectively push their clients, who typically have a higher credit rating than those who usually use alternative lenders, into finding alternative sources of credit. This means the lenders HONY invests in often end up with a higher quality of underlying borrower, and so the credit profile of consumer lending portfolios can improve during tough economic periods. HONY’s durability during the pandemic is not only down to these type of dynamics. Its portfolio is very diverse, and specialised knowledge of a number of different lending markets is key to its success so far.
However, rather than purely being due to taking massive credit risk, we think the high yield on offer in the direct lending space is due to higher returns from complexity. Few lenders have the knowledge and experience to be able to operate in this space, which gives them great bargaining power. As Baz, Stracke and Sapra put it, high search costs generally favour the prospective buyer, particularly if the buyer base is limited.
Another specialist asset class to emerge in recent years is music royalties. Hipgnosis Songs (LSE:SONG) was the first trust in the sector, and it has been followed by Round Hill Music Royalty Fund. This new asset class (within the investment trust space) clearly requires a specialist manager, and we think as it is so new, investors in the space are likely to require higher expected returns for the (less well known) risks. We note the discount rate used by SONG to value its assets was a very high 9% until the start of the year when it was lowered slightly to 8.5% (this compares to around 6-7% for the solar power trusts, for example). The discount rate can be thought of as the required rate of return for an investment. The higher the discount rate, the lower the price paid for a given asset. Hipgnosis’s high discount rate includes, we believe, a risk premium which we could consider a complexity premium. Over time, assuming the investment thesis is proven correct, we would expect the discount rate to lower steadily as the asset class became established and cash flows become more visible. One interesting comparator is the discount rate used by economist Aswath Damodaran for single companies in the US entertainment sector, which was just 5.1% entering 2021. Were SONG’s discount rate to trend closer to this number, there would naturally be significant gains to NAV. It would also reflect less advantageous prices being paid for new investments, implying lower future returns and the erosion of the risk premium currently being earned.
Double trouble
In our view the discounts of investment trusts can also reflect the complexity of the underlying assets (and on occasion the structure of the trust) which can provide interesting opportunities if the market later becomes more comfortable with the model or asset class. HONY is potentially such an example. It has persistently traded on a discount through the pandemic as, we think, investors have not correctly understood the underlying risks, and assigned greater probability of losses to defaults than has so far been evident. Given the complexity of the underlying assets, it is natural that investors may have steered clear. We note the manager has made efforts to provide greater information, with now very detailed factsheets which may help investors become more comfortable with the portfolio. However, HONY still trades on a 4.7% discount, meaning the yield on an historic basis is 8.2%.
We also think that the persistent discounts on listed private equity (LPE) trusts over the last decade or so may be explained by a complexity premium. Over the years, we and many other commentators have wondered why discounts remained wide in the LPE sector. After all, during the period before the 2008 financial crisis, discounts across the sector were very narrow and in many cases trusts also traded at premiums. Perhaps we’ve answered the question there, given many were over-extended and as a result some permanently destroyed value during the financial crisis. However, the differences in the balance sheet positions then and now make a repeat unlikely. Lessons were learned, but discounts remain very wide in absolute terms – in many cases approaching 20% and wider.
In fact, whilst discounts in the LPE sector look optically wide, there is good reason to believe that discounts are actually even wider. Part of the reason for discounts in the sector could be the market’s mistrust of the time taken for valuations to feed through into published NAVs. Single manager funds tend to report significantly more quickly than funds of funds. But we would argue that the very diversified funds are less exposed to specific risk, meaning that the performance of individual companies within the portfolio will have less of an impact (positive or negative), and thereby negating the reason for a discount in the first place. We think the persistence of these discounts at quite extreme levels despite continued good NAV performance indicates that not enough investors want to do the work to become comfortable with a complicated area they don’t yet understand.
In a decade in which you have been able to generate >10% a year in Scottish Mortgage (LSE:SMT) or Allianz Technology Trust (LSE:ATT), maybe that makes sense. However, if returns on equity markets are lower over the coming years – and the leading sectors (technology in this case) less exuberant – perhaps more and more investors will be happy to overcome the complexity of private equity as an asset class and invest in a space which has historically provided very attractive NAV total returns. The weighted average five-year NAV total returns from the UK Direct private equity trusts, was 144.2%, according to JPMorgan Cazenove, more than double the 65.6% returned by the UK All Companies trusts. This isn’t a perfect comparison, as some of the trusts have overseas exposure. However, the weighted average NAV total return for the Europe sector is 90% over the period. This is also higher than the simple average of global equity trusts over the period of 109%, when excluding SMT, an outlier in size as well as performance.
In this context, it is worth highlighting AVI Global Trust (LSE:AGT)andMiton Global Opportunities (LSE:MIGO). Both look for opportunities in complex investments where the value is not properly recognised by the market. MIGO focusses on the closed-ended fund sector. At times manager Nick Greenwood and Charlotte Cuthbertson buy trusts in conventional asset classes which are trading on wide discounts, but they also specifically look to invest in esoteric sectors which are likely to be poorly understood by most investors. Examples include cargo ship leasing, German residential property and indeed private equity. AVG’s managers clearly see value in the listed private equity space, with Oakley Capital Investments its largest individual holding at 6.8% as at 30/04/2021. They also invest in complex holding company structures where they believe the true value of the assets is not being recognised. This can reflect the complex nature of the corporate structures which many investors will not want or be able to dig into. We think both of these trusts could arguably be seen to be exploiting a ‘complexity premium’.
Conclusions
The complexity premium is a relatively woolly concept, and not as clearly defined or accepted in the literature as the illiquidity premium. Indeed, Baz, Saka and Sapra argue that complexity is inextricably linked to illiquidity. “Illiquidity and complexity are not independent but, rather, related by the fact that complex investments often trade at lower frequencies. This means that the price discovery process cannot reliably look to past prices as an indication of fair value. Hence, a feedback mechanism exists in which complexity leads to illiquidity, which, in turn, creates complexity,” they write.
Leaving the technical question of whether there are two separate premiums or two elements of the one premium for the academics, we think the concept of the complexity premium is useful for explaining the valuations of alternative asset classes, how they de-risk in the eyes of the market over time, and how investment trusts which invest in them may trade on wide discounts at times. In fact, we think it could be an interesting potential explanation for the private equity conundrum. While stakes in private businesses are indeed illiquid, the shares of the investment trusts themselves are not, and the illiquidity premium should be reflected in the prices paid by the managers at a NAV level. If this is true, then it just raises once more the question of the alarming disparity between the valuations in the private equity sector and of trusts investing in early-stage private investments as a minority investor (such as Augmentum Fintech, Merian Chrysalis, and Scottish Mortgage in parts of its portfolio). There is arguably as much complexity and illiquidity in these portfolios, yet sentiment has led them to trade on very high premiums at times. In our view there is good value in the private equity trusts such asNB Private Equity Partners (LSE:NBPE) on a 25.9% discount, BMO Private Equity (LSE:BPET) and ICG Enterprise (LSE:ICGT)on both on circa a 17% discounts or Oakley Capital Investments (LSE:OCI)on a 22% discount.
We also think there are identifiable areas of the market where there is a premium to be earned for investing in a relatively new or newly opened-up asset class. This is true of private debt, in which space we expect to see more manager and investor interest over time, and in direct lending, as well as in the new music royalty sector. In these areas absolute returns may well be very high in the coming years or, as in the case of the debt funds, stand out on a risk-adjusted basis, with high but not excessive yields being achieved at the expense of modest credit and default risk. While there can be no guarantees on direction or timing, As the infrastructure and renewable energy infrastructure sectors have shown, investors who get ahead of the curve can sometimes earn attractive risk-adjusted returns as they ride the wave of investor enthusiasm building behind them.
Kepler Partners is a third-party supplier and not part of interactive investor. Neither Kepler Partners or interactive investor will be responsible for any losses that may be incurred as a result of a trading idea.
These articles are provided for information purposes only. Occasionally, an opinion about whether to buy or sell a specific investment may be provided by third parties. The content is not intended to be a personal recommendation to buy or sell any financial instrument or product, or to adopt any investment strategy as it is not provided based on an assessment of your investing knowledge and experience, your financial situation or your investment objectives. The value of your investments, and the income derived from them, may go down as well as up. You may not get back all the money that you invest. The investments referred to in this article may not be suitable for all investors, and if in doubt, an investor should seek advice from a qualified investment adviser.
Full performance can be found on the company or index summary page on the interactive investor website. Simply click on the company's or index name highlighted in the article.
Important Information
Kepler Partners is not authorised to make recommendations to Retail Clients. This report is based on factual information only, and is solely for information purposes only and any views contained in it must not be construed as investment or tax advice or a recommendation to buy, sell or take any action in relation to any investment.
This report has been issued by Kepler Partners LLP solely for information purposes only and the views contained in it must not be construed as investment or tax advice or a recommendation to buy, sell or take any action in relation to any investment. If you are unclear about any of the information on this website or its suitability for you, please contact your financial or tax adviser, or an independent financial or tax adviser before making any investment or financial decisions.
The information provided on this website is not intended for distribution to, or use by, any person or entity in any jurisdiction or country where such distribution or use would be contrary to law or regulation or which would subject Kepler Partners LLP to any registration requirement within such jurisdiction or country. Persons who access this information are required to inform themselves and to comply with any such restrictions. In particular, this website is exclusively for non-US Persons. The information in this website is not for distribution to and does not constitute an offer to sell or the solicitation of any offer to buy any securities in the United States of America to or for the benefit of US Persons.
This is a marketing document, should be considered non-independent research and is subject to the rules in COBS 12.3 relating to such research. It has not been prepared in accordance with legal requirements designed to promote the independence of investment research.
No representation or warranty, express or implied, is given by any person as to the accuracy or completeness of the information and no responsibility or liability is accepted for the accuracy or sufficiency of any of the information, for any errors, omissions or misstatements, negligent or otherwise. Any views and opinions, whilst given in good faith, are subject to change without notice.
This is not an official confirmation of terms and is not to be taken as advice to take any action in relation to any investment mentioned herein. Any prices or quotations contained herein are indicative only.
Kepler Partners LLP (including its partners, employees and representatives) or a connected person may have positions in or options on the securities detailed in this report, and may buy, sell or offer to purchase or sell such securities from time to time, but will at all times be subject to restrictions imposed by the firm's internal rules. A copy of the firm's conflict of interest policy is available on request.
Past performance is not necessarily a guide to the future. The value of investments can fall as well as rise and you may get back less than you invested when you decide to sell your investments. It is strongly recommended that Independent financial advice should be taken before entering into any financial transaction.
PLEASE SEE ALSO OUR TERMS AND CONDITIONS
Kepler Partners LLP is a limited liability partnership registered in England and Wales at 9/10 Savile Row, London W1S 3PF with registered number OC334771.
Kepler Partners LLP is authorised and regulated by the Financial Conduct Authority.