A diversified approach to UK equity income
As a few big names dominate UK Equity Income, investors need to think smaller to diversify their risk.
2nd August 2019 16:10
As a few big names dominate UK Equity Income, investors need to think smaller to diversify their risk.

This content is provided by Kepler Trust Intelligence, an investment trust focused website for private and professional investors. Kepler Trust Intelligence is a third-party supplier and not part of interactive investor. It is provided for information only and does not constitute a personal recommendation.
Material produced by Kepler Trust Intelligence should be considered a marketing communication, and is not independent research.
Rethinking UK Equity Income
William Sobczak, analyst at Kepler Trust Intelligence.
There is a problem with the UK's core crop of income funds. UK equity income trusts are highly concentrated in a few big names, which we think is a potential cause for concern for income-seeking investors. It is also a good reason to diversify one's sources of income.
This concentration is particularly worrying when you consider that many of the largest yielders in the index have an uncertain future, and there are question marks over the sustainability of their dividends. Just eight companies make up over the 50% of the yield of the FTSE 100, according to Bloomberg figures, and the likes of Shell (LSE:RDSB), BP (LSE:BP.) and GlaxoSmithKline (LSE:GSK) feature 17, 14 and ten times in the top five holdings across the 24 trusts in the UK Equity Income sector.
As we discussed in our recent article, the AIC has overhauled its sectors, aiming to make it easier for investors to identify and compare appropriate investments.
However, we believe they have overlooked a potentially interesting group of trusts that could more properly be considered a sector and which might help mitigate this problem: small cap equity income.
As we highlighted in the article, trusts that don't easily fit within sector definitions frequently trade on wider discounts than might otherwise be the case.
We think this may be the situation with the trusts in our new sector, which offer an interesting way of diversifying an investor's sources of income and resolving the problem of concentration in the AIC UK Equity Income sector.
Although yielding less than the large cap income vehicles on average, there are some trusts with innovative structures and policies offering significant yields, and there are good dividend growth prospects from some of them too.
There are other benefits to small cap equity income trusts, including the potential for capital appreciation. Here, we discuss the overlooked opportunity in small cap equity income and the benefits for income-hungry investors.
The problem with UK Equity Income
As can be seen in the table below, relative to other equity income sectors, the AIC UK Equity Income sector offers comfortably the greatest number of constituents to choose from at 24, an extremely attractive yield, and the widest average discount relative to sector peers.
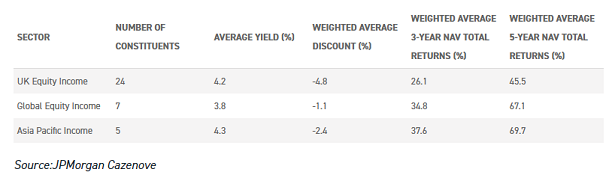
Even so, a small number of underlying companies make up a large proportion of many of these income trusts, meaning that splitting a portfolio among more than one such trust might not provide the expected diversification.
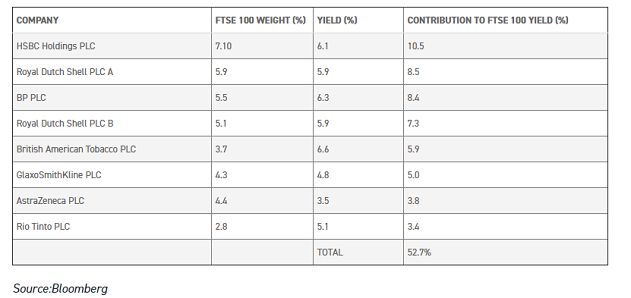
This is principally due to a small number of companies dominating the yield on the FTSE. As can be seen below, just seven stocks (including both Royal Dutch Shell share classes as one) contribute more than 50% of the yield to the FTSE 100.
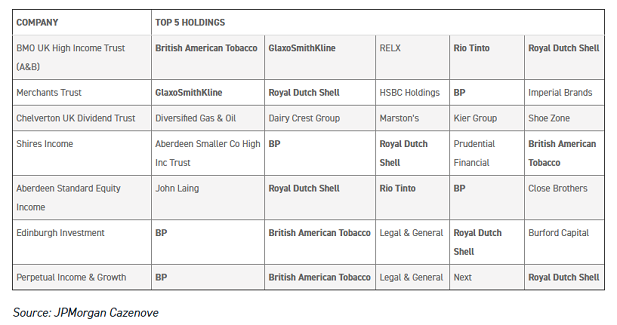
This concentration is reflected in the AIC UK Equity Income sector, where Shell, BP and GlaxoSmithKline featured 17, 14 and ten times in the top five holdings of 24 trusts in the sector. The table below shows all of the trusts that yield more than 4.5% and their top five holdings. This highlights that, for the most part, the same underlying holdings keep coming up again and again.
Income at risk
On top of the diversification issue, there are also concerns about the specific sources of this income. Some of the biggest names that feature so heavily in many of these portfolios have less than certain futures.
Royal Dutch Shell and BP, for example, face environmental and economic changes to the global energy market as we shift toward a lower-carbon future.
Sarasin & Partners sold nearly 20% of their stake in Shell earlier in July due to the company's recently announced spending plans, which they believe to be out of synch with international targets to battle climate change.
British American Tobacco (LSE:BATS) also faces uncertainty as the company's core cigarette business is under immediate threat on a number of fronts.
US cigarette sales have seen 18 straight months of decline (to the end of June 2019), and there continue to be talks surrounding the potential US ban on menthol products.
Alongside this, the vaping industry remains a challenge. Although in its infancy, it is still uncertain what type of regulatory framework policy makers will eventually install.
Alongside these threats, there are company-specific problems and many of the highest yields in the index are under threat of being cut.
We have already seen Vodafone (LSE:VOD) and Marks & Spencer (LSE:MKS) cut their dividends by 40%. Centrica (LSE:CNA) and easyJet (LSE:EZJ) are both regarded as candidates for dividend cuts in the near future.
Alongside company-specific issues, many of the biggest yielders have benefited from a depressed pound sterling. In the table above, the oil and gas companies, miners, tobacco and pharmaceutical sectors all derive significant revenues in dollars.
For the second quarter in a row, we have seen record-high UK dividends. According to Link Asset Services, the headline figure for UK companies in Q2 of 2019 was up 15%, when specials are excluded, and dividends increased by more than 5% over the quarter.
However, fully half of this increase was due to currency weakness. Large-cap stocks grew their dividends considerably faster than mid and small caps, and the FTSE 100 constituents increased their pay-outs by nearly a fifth, despite the underlying increase being less than 6% and all the rest due to the fall in sterling.
However, sterling now looks cheap in our view, and has likely priced in the likelihood of a hard Brexit, so it is difficult to see it not strengthening from here over the medium term.
It is also worth noting that the dollar is strong globally for reasons unrelated to Brexit, which is another trend where we would expect mean reversion over the course of a cycle. This threatens further dividend cuts in the high-yielding large caps, or at least the prospect of lower dividend growth.
The case for small cap income
We believe smaller companies trusts with an income focus offer one way to diversify these risks. Although not recognised by the AIC as a sector in its own right, we believe what we call 'UK smaller companies income' trusts offer a wide range of benefits for investors, but most especially a diversified source of income relative to the UK Equity Income sector.
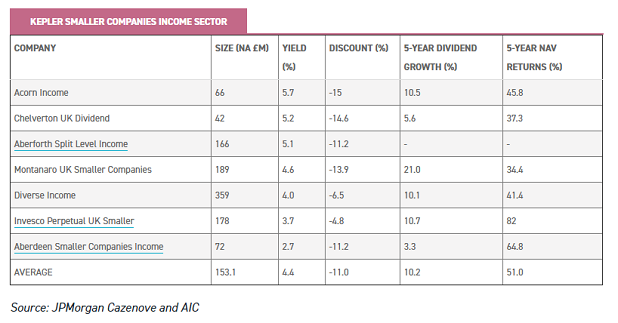
We picked out nine smaller companies trusts that yield more than 2.5%, originating from the AIC's UK Equity Income, UK Smaller Companies and UK Equity and Bond sectors, and they are listed in the table below.
Looking at the top five holdings of the trusts in our notional sector, we found there was only one company held in multiple portfolios.
This illustrates the fact these trusts aren't dependent on a handful of companies for their income. (This company was 4imprint (LSE:FOUR), which yields a little over 2%).
Alongside this, unlike the UK Equity Income sector, which is heavily reliant on the oil and gas and tobacco sectors, the smaller companies income trusts are invested in a wide range of sectors.
This includes domestically-facing housebuilders and consumer discretionary companies like Bellway (LSE:BWY) and Cineworld Group (LSE:CINE), as well as financial services companies like Intermediate Capital Group and IFG Group.
They therefore offer ways to diversify sources of income away from materials, energy and pharmaceuticals, and away from dollar earning streams.
Across the 11 trusts the average yield is 4.4%, in comparison to 4.2% from the UK Equity Income sector. Alongside this, the average dividend growth over five years is 10.2%, in comparison to just 4.8% from the AIC UK Equity Income sector, illustrating the benefits of smaller companies that can grow their earnings quickly over a short period of time.
In particular, Montanaro UK Smaller Companies (LSE:MTU) and Invesco Perpetual UK Smaller Companies (LSE:IPU) stand out for their double-digit dividend growth.
However, there are some trusts that offer considerably more income, specifically those that have geared up with the use of ZDPs or other structural debt: Chelverton UK Dividend Trust (LSE:SDV), Aberforth Split (LSE:ASIT) and Acorn Income (LSE:AIF) (we believe it worth considering Acorn Income too despite its ability to buy fixed income as small-cap equities make up a minimum of 70% of its portfolio).
It must be said that gearing adds risk to a portfolio. In the case of a ZDP structure, the trust needs to make gains enough to pay back the agreed return to ZDP-holders at the agreed date, and if it does not then dividends, and capital values, might be under threat.
However, these structures have been successfully managed by the likes of Chelverton and Aberforth in the past, and we think are worth considering for investors who understand the risks.
The high return track record of smaller companies limits the possibility of trusts not being able to redeem their gearing without losses to ordinary shareholders, we think, although there remains the risk that poor luck with the timing of the cycle could threaten this in future.
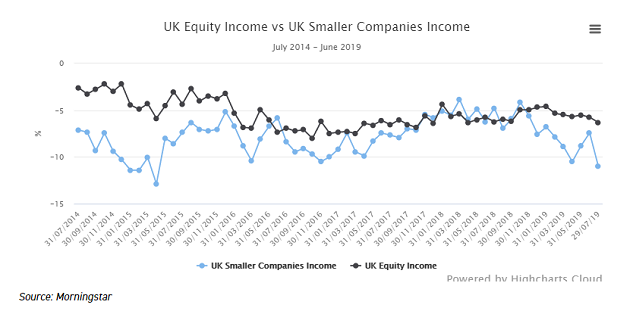
Below we can see the sector average discount for our UK smaller companies income sector compared to the AIC UK Equity Income sector over the past five years.
This shows that UK smaller companies continue to be out of favour relative to their larger counterparts. The current average discount on this sector is 11% and on the UK Equity Income sector is 6.3%.
Additionally, our UK smaller companies income trusts have significantly outperformed the AIC UK Equity Income constituents over the long term, benefiting from their greater growth potential and more dynamic capabilities.
On average, the trusts within our UK smaller companies income sector have generated 17.34% annualised NAV total returns, in comparison to 12.55% from the AIC UK Equity Income sector over 10 years.
Over the same period, our sector has generated an average alpha of 5.43%, in comparison to an average of 2.44% from the equity income sector. Investing in these trusts therefore offers an attractive mix of yield and capital growth.
Below we list some stand-out candidates, in our view, from our proposed sector, ordered by their yield.
Chelverton UK Dividend - 5.2%
Chelverton UK Dividend Trust aims to deliver a high and growing income through investments in mid to small-cap UK companies.
The managers, David Horner and David Taylor, aim to find companies that generate cash on a sustainable basis, which is then used to grow the business and to reward shareholders.
The managers also place a great deal of emphasis on finding management teams that strike an appropriate balance between current and future income.
The company's shares are geared by the zero dividend preference (ZDP) shares that were recently re-issued in January 2018 when shareholders received their final entitlement in full.
The new class of ZDPs will mature on 30 April 2025, helping to enhance total returns for shareholders. They make up close to 20% of NAV, meaning the trust is not without risks.
Earlier in the year, the board announced that once the trust's revenue reserves are equal to double the historic dividend, the company will distribute to shareholders all additional current-period revenue as a special dividend.
As at the most recent dividend payment in April 2019, the trust had retained revenue reserves of 19.19p per share, which represents some 199% of the expected 2020 annual dividend of 9.60p per share, giving shareholders a certain amount of reassurance that the dividend will be paid going forward.
Currently the trust is trading at a discount of 14.6%, the third-widest discount in the UK Equity Income sector.
Aberforth Split Level Income Trust - 5.2%
Aberforth Split Level Income, along with sister trust Aberforth Smaller Companies, is one of the only UK smaller companies trusts with an unambiguous value approach. This leads to a bias towards companies paying a dividend.
Aberforth Split Level Income takes a bottom-up, value-driven approach to building a portfolio. It uses ZDPs to gear up and provide a high level of yield to ordinary shareholders, at 4.9%. The ZDPs mean the ordinary shares are 28% geared.
The trust is in its third year, having launched on 3 July 2017, but met its first-year dividend target of 4p, supplementing that with 0.6p of specials in a bumper year for those.
The first interim dividend of 2018/19 saw a slight increase over the previous year, while income received from specials on the portfolio has been considerable, though lower than in 2017/18. The trust has built up a revenue reserve already, holding back 0.8p last year, or 20% of the full-year dividend.
Since launch, the trust's discount has been volatile. The current discount of 11.2%, according to the most recent factsheet, is wider than the sector average of 10.3%.
Invesco Perpetual UK Smaller Companies - 3.7%
Invesco Perpetual UK Smaller Companies looks to generate long-term total returns through a broad portfolio of small to medium sized UK companies.
The managers, Jonathan Brown and Robin West, are fundamental stock pickers searching for high-quality businesses at attractive valuations.
Currently the shares yield 3.7%, one of the highest yields in the AIC UK smaller companies sector. In 2015, the board led an initiative to materially increase the dividend, supported by capital reserves.
Paying a dividend from capital is seen in some quarters as possibly controversial, but the board argues that this represents only a small proportion of a year's returns.
The board believes that this approach allows them to make a higher proportion of total returns available to shareholders payable through an enhanced dividend.
Importantly, this is achieved without compromising the integrity of the portfolio or changing the manager’s investment process.
The dividend for the year is calculated to give a yield of 4% based on the year-end share price. The income is paid via three equal dividend instalments, followed by a balancing final dividend for the year.
Interim dividends for the financial year ending January 2019 were paid at a rate of 3.65p per quarter, representing an increase of 2.8% over the previous year.
The final dividend of 7.65p took the full year dividend to 18.6p, down 10.6% from the prior year.
Aberdeen Smaller Companies Income - 2.7%
Aberdeen Smaller Companies Incomeaims to generate income and capital growth through investing predominantly in UK smaller company equities.
The trust also invests in bonds and preference shares to help boost the income, but these make up only around 7% of the trust.
The trust saw a change in manager in September of 2018. At the helm is Abby Glennie, who has been transitioning the portfolio to run it in a similar fashion to the Standard Life UK Smaller Companies Trust (LSE:SLS) run by Harry Nimmo.
Currently, the trust is yielding 2.7% and trading at a significant discount of more than 11%. We believe this offers income seekers an attractive opportunity to get a diversifying source of dividends from a smaller companies portfolio with good growth potential, and have included the trust in our portfolio of discount opportunities.
We note that dividends have continually grown in recent years (3.3% per annum over the past five years) and have been fully covered by income.
The 2018 dividend was 4.2% higher than the 2017 pay-out, but growth might be more modest in 2019. This is because the trust received substantial special dividends from Victrex (LSE:VCT) and AVEVA( LSE:AVV) during the year, which will not be repeated, and we understand that the board is determined to ensure the dividend remains covered.
By our calculations, there is roughly 1.4 times last year’s dividend in reserve, so investors can have high confidence that the dividends will be at least maintained in the future even in a rough market.
Kepler Partners is a third-party supplier and not part of interactive investor. Neither Kepler Partners or interactive investor will be responsible for any losses that may be incurred as a result of a trading idea.
Full performance can be found on the company or index summary page on the interactive investor website. Simply click on the company's or index name highlighted in the article.
Important Information
Kepler Partners is not authorised to make recommendations to Retail Clients. This report is based on factual information only, and is solely for information purposes only and any views contained in it must not be construed as investment or tax advice or a recommendation to buy, sell or take any action in relation to any investment.
This report has been issued by Kepler Partners LLP solely for information purposes only and the views contained in it must not be construed as investment or tax advice or a recommendation to buy, sell or take any action in relation to any investment. If you are unclear about any of the information on this website or its suitability for you, please contact your financial or tax adviser, or an independent financial or tax adviser before making any investment or financial decisions.
The information provided on this website is not intended for distribution to, or use by, any person or entity in any jurisdiction or country where such distribution or use would be contrary to law or regulation or which would subject Kepler Partners LLP to any registration requirement within such jurisdiction or country. Persons who access this information are required to inform themselves and to comply with any such restrictions. In particular, this website is exclusively for non-US Persons. The information in this website is not for distribution to and does not constitute an offer to sell or the solicitation of any offer to buy any securities in the United States of America to or for the benefit of US Persons.
This is a marketing document, should be considered non-independent research and is subject to the rules in COBS 12.3 relating to such research. It has not been prepared in accordance with legal requirements designed to promote the independence of investment research.
No representation or warranty, express or implied, is given by any person as to the accuracy or completeness of the information and no responsibility or liability is accepted for the accuracy or sufficiency of any of the information, for any errors, omissions or misstatements, negligent or otherwise. Any views and opinions, whilst given in good faith, are subject to change without notice.
This is not an official confirmation of terms and is not to be taken as advice to take any action in relation to any investment mentioned herein. Any prices or quotations contained herein are indicative only.
Kepler Partners LLP (including its partners, employees and representatives) or a connected person may have positions in or options on the securities detailed in this report, and may buy, sell or offer to purchase or sell such securities from time to time, but will at all times be subject to restrictions imposed by the firm's internal rules. A copy of the firm's conflict of interest policy is available on request.
Past performance is not necessarily a guide to the future. The value of investments can fall as well as rise and you may get back less than you invested when you decide to sell your investments. It is strongly recommended that Independent financial advice should be taken before entering into any financial transaction.
PLEASE SEE ALSO OUR TERMS AND CONDITIONS
Kepler Partners LLP is a limited liability partnership registered in England and Wales at 9/10 Savile Row, London W1S 3PF with registered number OC334771.
Kepler Partners LLP is authorised and regulated by the Financial Conduct Authority.
These articles are provided for information purposes only. Occasionally, an opinion about whether to buy or sell a specific investment may be provided by third parties. The content is not intended to be a personal recommendation to buy or sell any financial instrument or product, or to adopt any investment strategy as it is not provided based on an assessment of your investing knowledge and experience, your financial situation or your investment objectives. The value of your investments, and the income derived from them, may go down as well as up. You may not get back all the money that you invest. The investments referred to in this article may not be suitable for all investors, and if in doubt, an investor should seek advice from a qualified investment adviser.
Full performance can be found on the company or index summary page on the interactive investor website. Simply click on the company's or index name highlighted in the article.