A global equity outperformer showing rare consistency
Saltydog Investor comes across a fund ticking all the right boxes.
18th November 2025 09:11
by Douglas Chadwick from ii contributor

This content is provided by Saltydog Investor. It is a third-party supplier and not part of interactive investor. It is provided for information only and does not constitute a personal recommendation.
Despite a correction in the last couple of weeks, the past six months have been remarkably rewarding for many investors.
Stock markets around the world have moved significantly higher since the turbulence in early April. The Liberation Day tariffs caused sharp falls at the time, but by May confidence had begun to return.
- Invest with ii: Buy Investment Trusts | Top UK Shares | Open a Trading Account
Since then, most major indices have recovered well. By the end of October, the FTSE 100 and FTSE 250 had both risen by more than 10%, the S&P 500 had climbed more than 20%, and the Nasdaq was showing a six-month gain of over 30%.
Japan’s Nikkei 225 had done even better, up 45%. Our latest Saltydog 6×6 report shows that the past six six-month periods have produced positive numbers for most funds.
This report looks at six consecutive six-month periods and highlights funds that have risen by at least 5% in each period. It is a simple measure of consistency at a time when many investors only focus on the most recent returns.
High single-period gains are welcome, but very few funds achieve long-term success through different market conditions.
| Saltydog Investor 6x6 Report - November 2025 | Nov 22 | May 23 | Nov 23 | May 24 | Nov 24 | May 25 | 1 year | 2 year | 3 year |
| to | to | to | to | to | to | return | return | return | |
| Apr 23 | Oct 23 | Apr 24 | Oct 24 | Apr 25 | Oct 25 | ||||
| Funds that have risen by 5% or more in 6 out of 6 periods | |||||||||
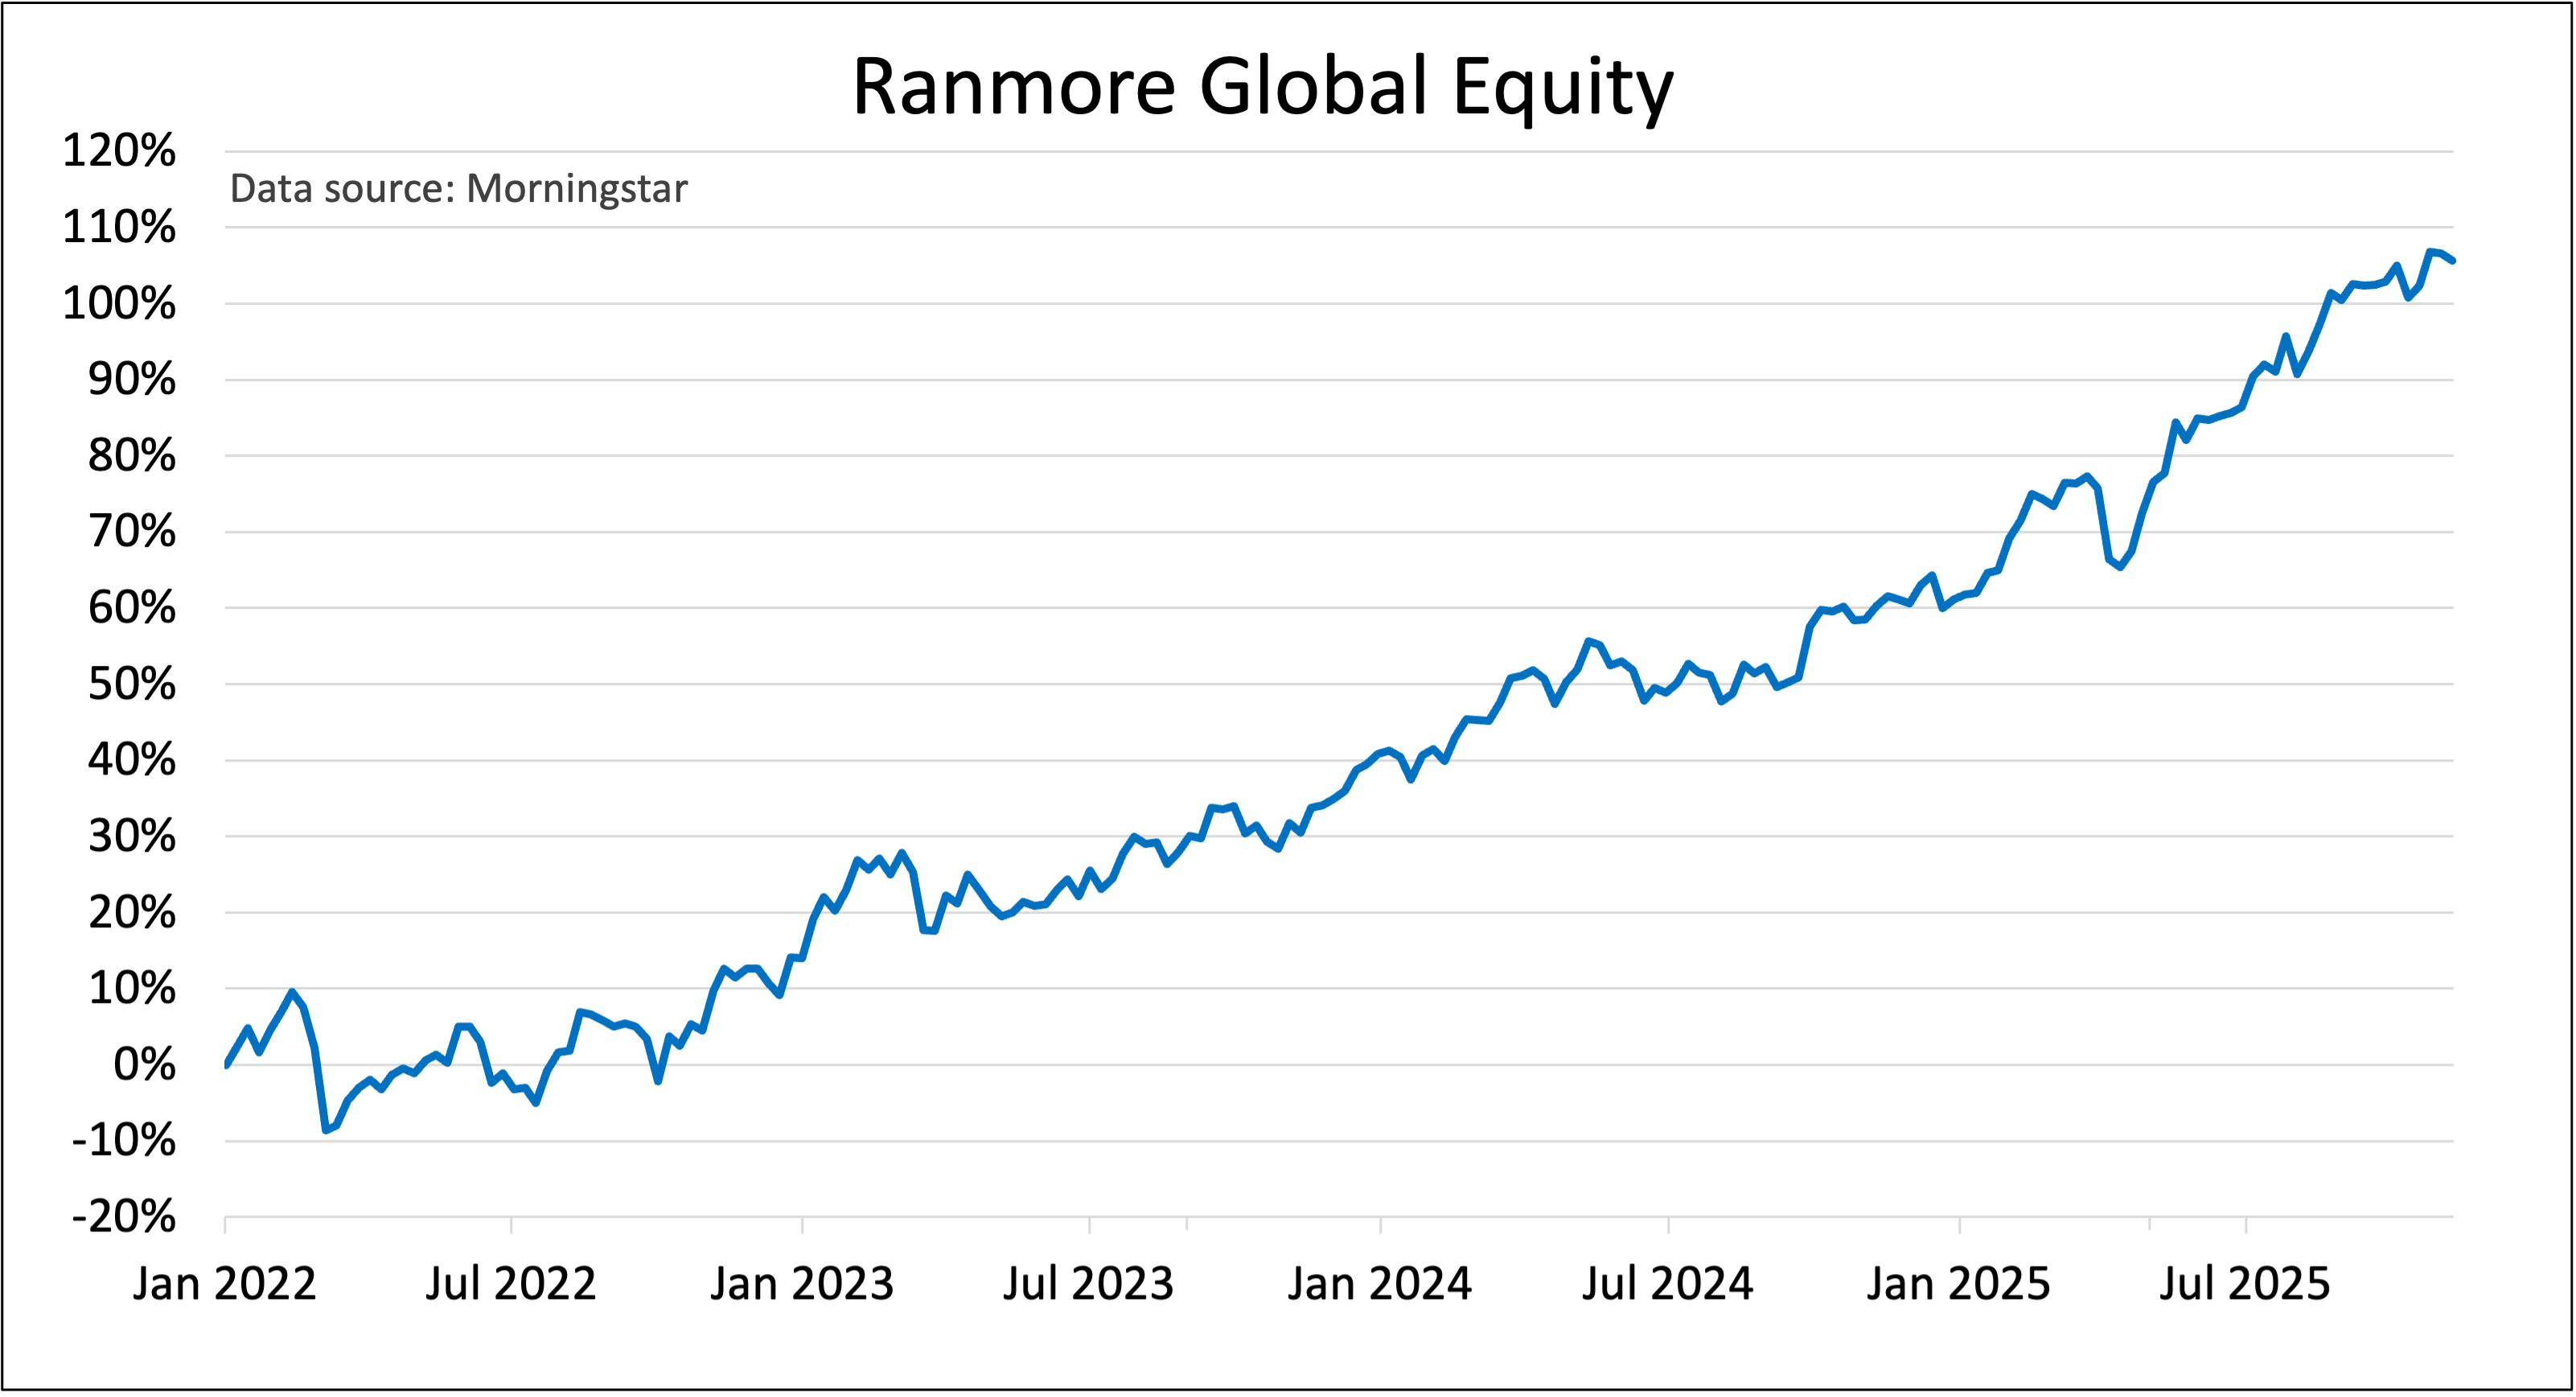
| Ranmore Global Equity Institutional GBP | 15.6% | 6.4% | 16.6% | 5.7% | 9.4% | 19.2% | 30% | 61% | 98% |
| Funds that have risen by 5% or more in 5 out of 6 periods | |||||||||
| Liontrust Global Technology C GBP Acc | 8.6% | 7.8% | 39.1% | 7.5% | -11.1% | 60.1% | 42% | 113% | 149% |
| Ninety One Global Gold I Acc £ | 31.1% | -12.7% | 15.7% | 17.9% | 16.0% | 58.5% | 84% | 151% | 187% |
| SVS Sanlam Global Gold & Resources | 22.9% | -14.6% | 15.0% | 12.0% | 15.7% | 57.9% | 83% | 135% | 147% |
| L&G Global Technology Index Trust | 13.1% | 13.2% | 27.2% | 12.8% | -10.9% | 54.8% | 38% | 98% | 153% |
| BlackRock Gold and General D Acc | 28.5% | -11.8% | 15.2% | 21.6% | 15.1% | 50.1% | 73% | 142% | 175% |
| Janus Henderson Glb Tech Leaders I Acc | 9.4% | 9.7% | 33.1% | 10.3% | -8.4% | 43.6% | 32% | 93% | 132% |
| New Capital US Growth GBP Acc | 11.3% | 8.0% | 29.0% | 15.1% | -1.0% | 37.6% | 36% | 102% | 143% |
| Fidelity Global Technology W-Acc-GBP | 7.5% | 5.9% | 22.7% | 8.8% | -5.5% | 33.7% | 26% | 69% | 92% |
| Pictet-Digital I dy GBP | 7.7% | 13.4% | 30.5% | 5.4% | -3.3% | 32.7% | 28% | 77% | 116% |
| 8.2% | 8.5% | 24.8% | 8.4% | -7.0% | 31.5% | 22% | 65% | 94% | |
Data source: Morningstar. Past performance is not a guide to future performance.
It’s not unusual for no funds to achieve the elusive six-out-of-six threshold. Occasionally one or two manage it.
This month there’s a standout winner. Ranmore Global Equity is the only fund to rise by at least 5% in each of the six rolling periods.
The next 10 funds in our latest report have achieved the target in five out of six periods.
They are primarily a mix of global technology funds and gold funds. The Liontrust Global Technology C GBP Acc fund has risen by more than 60% over the six-month period to the end of October.
Several other technology funds have gained between 30% and 50%. The gold funds have also done well over the same period as bullion prices reached new highs earlier in the year. Three of them feature in the top group, and they have risen between 50% and 60% over six months.
However, when you look back across the earlier periods, the picture becomes more uneven.
The gold funds experienced double-digit falls in late 2023. Some of the tech funds have also fallen sharply when sentiment swung between optimism and caution.
The Liontrust fund dropped by more than 11% in one period. The L&G Global Technology Index Trust fund fell by almost 11%. Several others have suffered similar setbacks. These funds have delivered strong long-term returns, but the path has been volatile.
This is where Ranmore looks different. All six of its rolling periods are positive. Its weakest is 5.7%, and its strongest is 19.2%. None of the numbers stand out on their own, but the pattern is steady. It has produced a one-year return of 30%, a two-year return of 61%, and a three-year return of 98%. These results show a level of consistency that is rare in global equity investing, especially during a time dominated by tech-driven rallies.
The Ranmore Global Equity fund is managed by Sean Peche. It follows a value-oriented, bottom-up approach and does not track any index.
That freedom leads to a different portfolio from many global competitors. The MSCI World index is dominated by the US and heavily biased towards technology companies such as Apple Inc (NASDAQ:AAPL), Microsoft Corp (NASDAQ:MSFT), and NVIDIA Corp (NASDAQ:NVDA). Ranmore has a different focus. It is underweight in those familiar names and has higher exposure to financials, consumer cyclicals, Japan, South Korea, and several emerging markets.
This positioning is one reason why the fund has performed well during varied market conditions. It is not reliant on technology to drive returns.
At the same time, it hasn’t been held back during periods when growth stocks have led the way. Its exposure to Asia and its bias towards reasonably priced companies have given it a broader range of potential drivers.
Some investors may find the lower allocation to the US surprising, given the dominance of US markets in recent years. However, the numbers show that the approach has worked. The fund has delivered both gains and stability.
- Fund Focus: five principles to boost your portfolio
- Sign up to our free newsletter for investment ideas, latest news and award-winning analysis
The broader 6×6 report also gives a useful sense of where momentum has been in recent months.
Technology continues to attract attention as artificial intelligence (AI) spending rises.
Semiconductor demand has been strong, and several of the leading global funds have benefited from these themes. Gold has also been a strong performer, although it experienced a pullback towards the end of October.
It remains significantly higher than it was at the start of the year, and the leading gold funds still feature prominently in our tables.
Although the past six months have been positive, the pattern of returns highlights the importance of understanding risk. The funds that have risen the most over a short period are usually the ones that fall furthest when markets turn.
Technology funds and gold funds have produced exceptional gains, but they have also experienced sharp setbacks. Their long-term performance has been impressive, but it hasn’t been a smooth journey.
Past performance is not a guide to future performance.
For more information about Saltydog, or to take the two-month free trial, go to www.saltydoginvestor.com
These articles are provided for information purposes only. Occasionally, an opinion about whether to buy or sell a specific investment may be provided by third parties. The content is not intended to be a personal recommendation to buy or sell any financial instrument or product, or to adopt any investment strategy as it is not provided based on an assessment of your investing knowledge and experience, your financial situation or your investment objectives. The value of your investments, and the income derived from them, may go down as well as up. You may not get back all the money that you invest. The investments referred to in this article may not be suitable for all investors, and if in doubt, an investor should seek advice from a qualified investment adviser.
Full performance can be found on the company or index summary page on the interactive investor website. Simply click on the company's or index name highlighted in the article.