Kepler Trust report: Finsbury Growth & Income
Finsbury Growth & Income is a highly-concentrated investment trust with a portfolio of mainly UK stocks.
12th September 2019 17:09
This content is provided by Kepler Trust Intelligence, an investment trust focused website for private and professional investors. Kepler Trust Intelligence is a third-party supplier and not part of interactive investor. It is provided for information only and does not constitute a personal recommendation.
Material produced by Kepler Trust Intelligence should be considered a marketing communication, and is not independent research.
Finsbury Growth & Income is a highly-concentrated investment trust with a portfolio of mainly UK stocks.

William Sobczak is analyst at Kepler Trust Intelligence.
Summary
Finsbury Growth & Income (LSE:FGT) is a highly-concentrated investment trust with a portfolio of mainly UK stocks, aiming to achieve capital and income growth in excess of that produced by the FTSE All-Share.
Fund manager Nick Train ignores the benchmark entirely - investing in companies which he believes will perform well regardless of their weighting in the index. The trust tends to invest in companies that have been resilient over various cycles and exhibit steady earnings growth over the long term.
He runs a highly-concentrated portfolio which stood at just 22 stocks when last reported in February, and Nick is renowned for his very long-term, low-turnover approach. For example, the most recent addition to the portfolio was Manchester United (NYSE:MANU) last summer, and he has only added one other new stock to the portfolio over the past four years. This, along with his focus on high-quality, cash-generative companies with strong franchises means his portfolio is highly differentiated to his peers in the AIC UK Equity Income sector.
Over the past five years (to the end of March) the trust has delivered an NAV return of 78.9%, beating the AIC UK Equity Income sector by 44.5% and more than doubling the returns of the FTSE All Share. The trust's returns over the longer term have been equally as strong, with it having beaten the index in nine of the past ten calendar years.
The trust is known for trading at a slight premium to par, however, in recent times we have seen this gap narrow. At the time of writing the premium is just 0.2%, relative to the three year historical average of 0.6%.
Portfolio
Finsbury Growth & Income Trust has a highly-concentrated portfolio of mainly UK companies, managed with an ultra-high conviction and low turnover stock picking approach by Lindsell Train co-founder Nick Train. The portfolio is made up of just 22 stocks, with the top 10 holdings accounting for c.80% of total NAV. This is even more concentrated than in previous years, principally due to the takeover of two former holdings – Dr. Pepper Snapple and Fidessa (LSE:FDSA).
Nick has a highly selective approach to stock selection and his 'wish list' is made up of a small number of market-leading companies, which he will not buy unless he can do so at the right valuation. This does not happen often, so portfolio turnover is very low. In fact, until last summer, Manchester United was the only new name that had been added to the portfolio in four years. Over 2018, no new additions were made, only further increases to existing holdings.
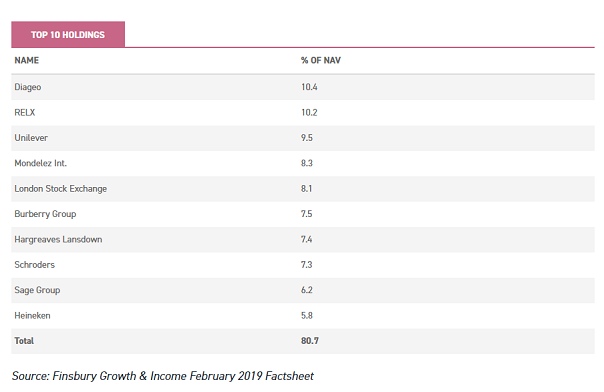
Designed to offer capital and income growth and total returns in excess of the FTSE All Share, the portfolio is dominated by three themes. The first theme, consumer goods and services companies, is central to the portfolio – making up a combined 67.9% of its assets (as at February 2019).
Its constituents are often very well-established names with multi-decade or even centuries of success – including Burberry (LSE:BRBY), RELX (LSE:REL) and Unilever (LSE:ULVR). Financials (e.g. London Stock Exchange (LSE:LSE)), are the second theme. Nick believes that these companies offer higher beta exposure to the long-term tendency for stock markets to rise.
Companies which via technology are radically improving productivity and opening up entirely new products and services to their customer base are the third, including Sage Group (LSE:SGE) for example.
As such, and as the chart below shows, the portfolio is made up of just four 'traditional' sectors.
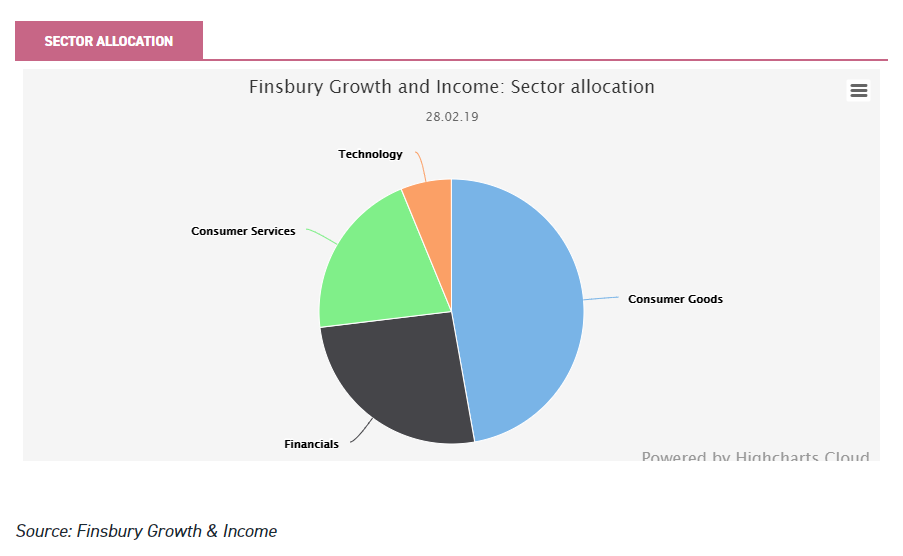
Technology remains the smallest sector allocation. However, Nick is not disinterested in the bull market being driven by digital technology. He believes that technology is going to cause a great deal of disruption to companies and sectors over the coming decade, as winners and losers begin to emerge.
This is Nick's greatest worry as a manager, and he hopes to stay on the right side of it in in two ways. First, he has increased his allocation to companies where the internet is going to help and reduced positions in those that may be killed.
For example, he has been adding to the trust's holdings in Burberry, Hargreaves Lansdown and RELX – which are all companies that have effectively utilised technology to enhance their customer reach.
Secondly, he has continued to focus on the distinctive tastes of certain beverage and food brands, which he believes will remain both beloved and hard for new technology to substitute.
Nick uses Mondelez, one of the largest positions in the portfolio, as an example. Oreo and Cadbury, both owned by Mondelez, are the most popular biscuit and chocolate brands in the US and UK respectively.
Both are the leading bricks and mortar brands too. He believes that this illustrates that the brands that continue to command emotional loyalty will continue to perform well. In some confirmation of this continuing resonance of beloved brands, we note that during 2018 there have been new all-time share price highs recorded for FGT portfolio holdings such as AG Barr (LSE:BAG), Diageo (LSE:DGE), Heineken (EURONEXT:HEIA), Remy Cointreau and Youngs.
Nick has a clear focus on the long term, and thinks the fundamental strength of a business should be all that drives an investment decision. Macro factors are impossible to predict, and their outcomes even more so, he says, and cannot be used to drive a meaningful investment process. As such, he pays very little attention to the macro environment. Whilst the portfolio is predominantly invested in UK equities, the manager has latitude to invest up to 20% of the trust on a global basis.
Gearing
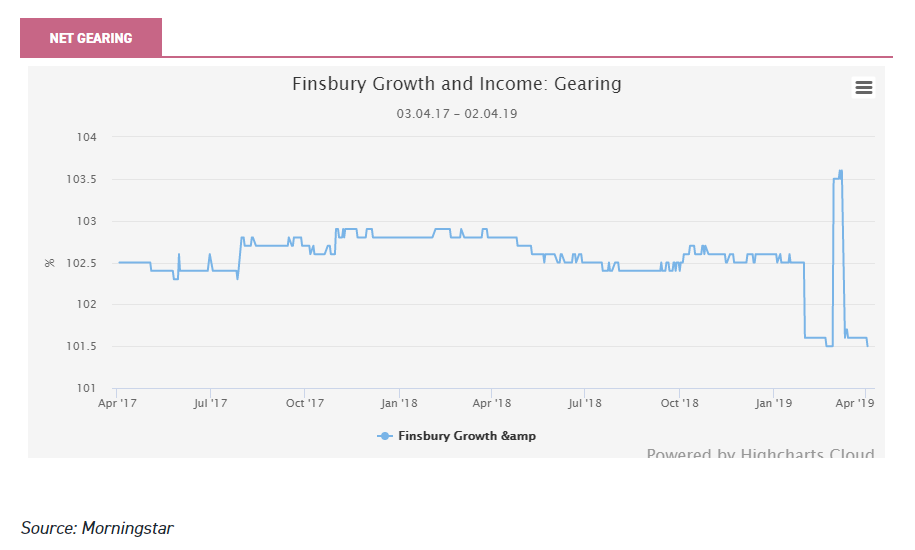
Gearing is employed on a structural basis to enhance returns, and the trust is currently in the final year of a three-year revolving facility for a maximum of £75 million with an additional £25 milion available if required. They have decided to roll over this facility in October 2019. The net gearing figure is currently 2%, having fallen over the past five years as the size of the trust has grown.
When we asked Nick why he chooses not to increase the gearing, particularly if he does not a take a macro view, he simply responded 'it helps him sleep better at night'. Expanding upon this, he recognised the concentrated nature of the portfolio, and stated that the trust doesn't need to add leverage through gearing like some "closet trackers" might.
Performance
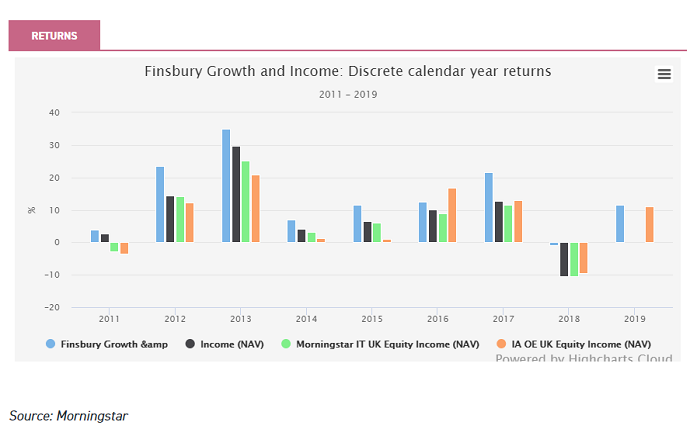
The trust has one of the best track records of consistent outperformance in the AIC UK Equity Income sector.
This boils down to Nick's approach. Firstly, his exposure to large-cap defensive companies with reliable earnings like Unilever and Diageo means the trust has offered protection in falling markets in the past. This positioning has also suited the market rally over the past decade or so, as investors have preferred less economically-sensitive dividend paying stocks in a world where economic growth has remained subdued, inflation has stayed stubbornly low and central banks have driven bond yields to record low levels via ultra-loose monetary policies.
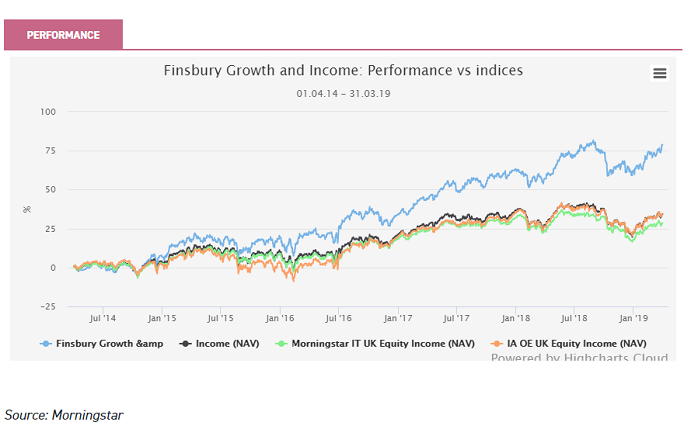
Secondly, though, his exposure to high growth mid and small-caps also means the trust has been able to keep pace with strongly rising markets. Over five years to the end of March 2019, the trust has delivered an NAV total return of 78.9%, compared to returns of 34.5% from the FTSE All Share.
Relative to the peer groups, the trust has outperformed the AIC UK Equity Income sector by 44.5% and the IA open-ended UK Equity Income sector by 50.6%.
Finsbury Growth & Income has beaten the index in nine out of the past ten years, outperforming in every calendar year since the global financial crisis except 2016 (a difficult year for all active managers thanks to the natural resources "dead-cat" bounce) when it lagged the FTSE All Share by 4%.
Though 2016 did prove to be a relatively muted year for the trust, it has returned to outperformance, beating the benchmark by 8.7% over the 2018 calendar year. The strong performance relative to AIC and IA peers was even more pronounced, the trust beating both by 9.7%.
It is important to note that, although the manager and board have chosen the FTSE All-Share as an index, the trust is only exposed to around 8% of the FTSE All-Share index. In other words, FGT's portfolio is likely to perform very differently to the FTSE All-Share Index over time, because only 8% of the portfolio overlaps with the index.
The revenue streams of the portfolio are also more international than the index, meaning this is not a UK portfolio in the traditional sense.
Management
Fund manager Nick Train co-founded Lindsell Train, the management company behind the trust, in 2000, after a 20-year investment career, most of which was spent at GT before it was acquired by Invesco.
Lindsell Train won the mandate for this trust in 2001. The team runs over £2 billion worth of dedicated UK funds, alongside a Japanese strategy (led by Michael Lindsell) and a global strategy that both founders work on. Lindsell Train is 72.7% owned by the two founders and 3% owned by other staff; the balance is owned by Lindsell Train Investment Trust.
Discount
The trust has a rigorous discount control mechanism, which means that the shares should trade between a 5% discount and a modest premium of 2%, and has been regularly issuing shares in recent years to keep the premium in check. The board has committed to buy back shares at around 5% and hold them in treasury, although this has not been necessary in recent years. As the graph below illustrates, this has had the effect of minimising discount volatility – certainly relative to the average seen across the AIC UK Equity Income sector. The trust has tended to trade in a narrow band between a 1.5% premium and a 1.5% discount.
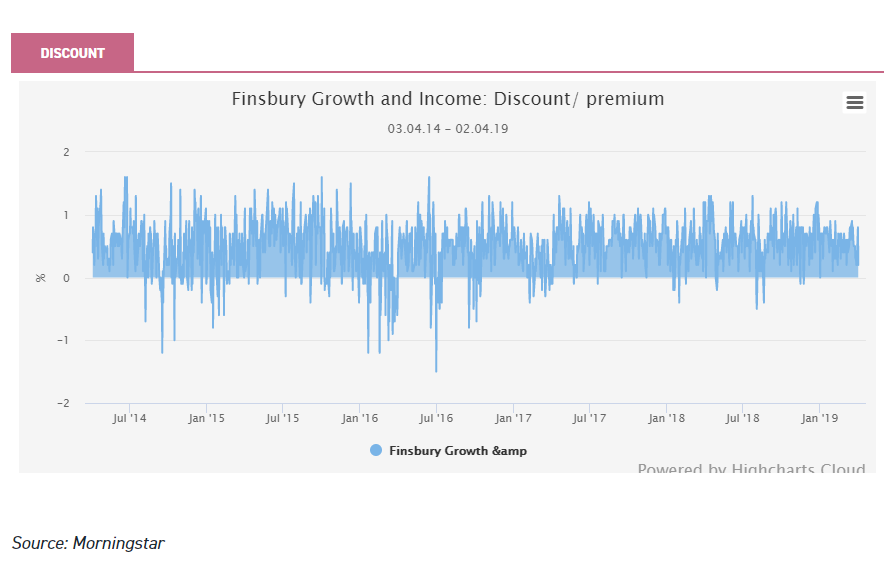
Over more recent times, the trust has been growing gently through the issuance of shares at a slight premium to NAV. Unusually, the trust has permission to issue shares at a discount to NAV - and has done so in the past - if the discount at which it is issuing the shares is narrower than the discount at which they are trading at the time.
However, this only applies to shares held in treasury, not 'new' shares, and given the trust has been trading on a premium for many years, it has not been used.
Although the premium has fallen over the past year or so (to 0.1% at the time of writing), the trust remains highly-rated relative to its peers thanks to its long-term track record and exposure to global growth stocks.
Charges
Finsbury Growth & Income has an ongoing charge figure (OCF) figure of 0.7%, putting it above the 0.63% weighted average for UK equity income trusts. The management fee is 0.6% on the first £1 billion of market cap and 0.54% thereafter. Frostrow Capital receives one third of this and Lindsell Train two thirds. The KID RIY is 1%, relative to the sector weighted average of 1.16%.
Kepler Partners is a third-party supplier and not part of interactive investor. Neither Kepler Partners or interactive investor will be responsible for any losses that may be incurred as a result of a trading idea.
Full performance can be found on the company or index summary page on the interactive investor website. Simply click on the company's or index name highlighted in the article.
Important Information
Kepler Partners is not authorised to make recommendations to Retail Clients. This report is based on factual information only, and is solely for information purposes only and any views contained in it must not be construed as investment or tax advice or a recommendation to buy, sell or take any action in relation to any investment.
This report has been issued by Kepler Partners LLP solely for information purposes only and the views contained in it must not be construed as investment or tax advice or a recommendation to buy, sell or take any action in relation to any investment. If you are unclear about any of the information on this website or its suitability for you, please contact your financial or tax adviser, or an independent financial or tax adviser before making any investment or financial decisions.
The information provided on this website is not intended for distribution to, or use by, any person or entity in any jurisdiction or country where such distribution or use would be contrary to law or regulation or which would subject Kepler Partners LLP to any registration requirement within such jurisdiction or country. Persons who access this information are required to inform themselves and to comply with any such restrictions. In particular, this website is exclusively for non-US Persons. The information in this website is not for distribution to and does not constitute an offer to sell or the solicitation of any offer to buy any securities in the United States of America to or for the benefit of US Persons.
This is a marketing document, should be considered non-independent research and is subject to the rules in COBS 12.3 relating to such research. It has not been prepared in accordance with legal requirements designed to promote the independence of investment research.
No representation or warranty, express or implied, is given by any person as to the accuracy or completeness of the information and no responsibility or liability is accepted for the accuracy or sufficiency of any of the information, for any errors, omissions or misstatements, negligent or otherwise. Any views and opinions, whilst given in good faith, are subject to change without notice.
This is not an official confirmation of terms and is not to be taken as advice to take any action in relation to any investment mentioned herein. Any prices or quotations contained herein are indicative only.
Kepler Partners LLP (including its partners, employees and representatives) or a connected person may have positions in or options on the securities detailed in this report, and may buy, sell or offer to purchase or sell such securities from time to time, but will at all times be subject to restrictions imposed by the firm's internal rules. A copy of the firm's conflict of interest policy is available on request.
Past performance is not necessarily a guide to the future. The value of investments can fall as well as rise and you may get back less than you invested when you decide to sell your investments. It is strongly recommended that Independent financial advice should be taken before entering into any financial transaction.
PLEASE SEE ALSO OUR TERMS AND CONDITIONS
Kepler Partners LLP is a limited liability partnership registered in England and Wales at 9/10 Savile Row, London W1S 3PF with registered number OC334771.
Kepler Partners LLP is authorised and regulated by the Financial Conduct Authority.
Kepler Partners is a third-party supplier and not part of interactive investor. Neither Kepler Partners or interactive investor will be responsible for any losses that may be incurred as a result of a trading idea.
These articles are provided for information purposes only. Occasionally, an opinion about whether to buy or sell a specific investment may be provided by third parties. The content is not intended to be a personal recommendation to buy or sell any financial instrument or product, or to adopt any investment strategy as it is not provided based on an assessment of your investing knowledge and experience, your financial situation or your investment objectives. The value of your investments, and the income derived from them, may go down as well as up. You may not get back all the money that you invest. The investments referred to in this article may not be suitable for all investors, and if in doubt, an investor should seek advice from a qualified investment adviser.
Full performance can be found on the company or index summary page on the interactive investor website. Simply click on the company's or index name highlighted in the article.
Important Information
Kepler Partners is not authorised to make recommendations to Retail Clients. This report is based on factual information only, and is solely for information purposes only and any views contained in it must not be construed as investment or tax advice or a recommendation to buy, sell or take any action in relation to any investment.
This report has been issued by Kepler Partners LLP solely for information purposes only and the views contained in it must not be construed as investment or tax advice or a recommendation to buy, sell or take any action in relation to any investment. If you are unclear about any of the information on this website or its suitability for you, please contact your financial or tax adviser, or an independent financial or tax adviser before making any investment or financial decisions.
The information provided on this website is not intended for distribution to, or use by, any person or entity in any jurisdiction or country where such distribution or use would be contrary to law or regulation or which would subject Kepler Partners LLP to any registration requirement within such jurisdiction or country. Persons who access this information are required to inform themselves and to comply with any such restrictions. In particular, this website is exclusively for non-US Persons. The information in this website is not for distribution to and does not constitute an offer to sell or the solicitation of any offer to buy any securities in the United States of America to or for the benefit of US Persons.
This is a marketing document, should be considered non-independent research and is subject to the rules in COBS 12.3 relating to such research. It has not been prepared in accordance with legal requirements designed to promote the independence of investment research.
No representation or warranty, express or implied, is given by any person as to the accuracy or completeness of the information and no responsibility or liability is accepted for the accuracy or sufficiency of any of the information, for any errors, omissions or misstatements, negligent or otherwise. Any views and opinions, whilst given in good faith, are subject to change without notice.
This is not an official confirmation of terms and is not to be taken as advice to take any action in relation to any investment mentioned herein. Any prices or quotations contained herein are indicative only.
Kepler Partners LLP (including its partners, employees and representatives) or a connected person may have positions in or options on the securities detailed in this report, and may buy, sell or offer to purchase or sell such securities from time to time, but will at all times be subject to restrictions imposed by the firm's internal rules. A copy of the firm's conflict of interest policy is available on request.
Past performance is not necessarily a guide to the future. The value of investments can fall as well as rise and you may get back less than you invested when you decide to sell your investments. It is strongly recommended that Independent financial advice should be taken before entering into any financial transaction.
PLEASE SEE ALSO OUR TERMS AND CONDITIONS
Kepler Partners LLP is a limited liability partnership registered in England and Wales at 9/10 Savile Row, London W1S 3PF with registered number OC334771.
Kepler Partners LLP is authorised and regulated by the Financial Conduct Authority.
These articles are provided for information purposes only. Occasionally, an opinion about whether to buy or sell a specific investment may be provided by third parties. The content is not intended to be a personal recommendation to buy or sell any financial instrument or product, or to adopt any investment strategy as it is not provided based on an assessment of your investing knowledge and experience, your financial situation or your investment objectives. The value of your investments, and the income derived from them, may go down as well as up. You may not get back all the money that you invest. The investments referred to in this article may not be suitable for all investors, and if in doubt, an investor should seek advice from a qualified investment adviser.
Full performance can be found on the company or index summary page on the interactive investor website. Simply click on the company's or index name highlighted in the article.