Off to the races: How our fund shortlist performed in 2019
We check in on our growth, income and annuity income shortlist performances for the year to date.
22nd November 2019 16:20
This content is provided by Kepler Trust Intelligence, an investment trust focused website for private and professional investors. Kepler Trust Intelligence is a third-party supplier and not part of interactive investor. It is provided for information only and does not constitute a personal recommendation.
Material produced by Kepler Trust Intelligence should be considered a marketing communication, and is not independent research.
We check in on our growth, income and annuity income shortlists launched earlier this year, which have performed strongly in 2019 to date.

Thomas McMahon, senior analyst at Kepler Trust Intelligence.
Off to the races: Kepler's fund shortlists post strong performance
In January this year we introduced new and expanded shortlists of growth, income and annuity income picks, an evolution of our model portfolios.
In February, we also introduced a portfolio of discounted opportunities – trusts that we believed were ripe for the discount to narrow, in either absolute or relative terms.
In each of the three shortlists we used a series of quantitative screens to try to identify those trusts with attractive characteristics across a broad spread of geographies, styles and strategies.
We view these as the potential building blocks of a portfolio with investment objectives of, respectively, growth, income and growth combined, and pure income.
We selected a variety of remits and styles for two reasons: first, to offer choice to the imaginary investor constructing a portfolio; and second, because we believe when building a portfolio it is important to avoid being too exposed to one strategy or style. Our trusts have been selected as long-term buy-and-hold investments which might form the core of a portfolio, and which we believe also harness the advantages of the closed-ended structure.
We regard the discounted opportunities shortlist as a set of satellite trusts which investors might want to use around their core strategic picks. We also expect to be more opportunistic – and are prepared to adopt a potentially shorter investment time frame – depending on relative net asset value (NAV) performance or the narrowing of the discount.
As we have discussed in previous articles, picking trusts on the basis of their discount can have an accelerant effect on NAV returns, should sentiment improve towards a particular trust or sub-sector (and the discount subsequently narrow).
Sometimes patience is the key, and sometimes indeed the discount never actually narrows. We selected these trusts on the basis that they are high quality investments which have potential to outperform in NAV terms, but which are trading on an unjustifiably wide discount; and where we thus anticipate the discount to narrow.
Today we review the performance of our three core shortlists against our objectives, but also against their respective benchmarks after a period of very strong performance. We also review the performance of our discount opportunities portfolio, on the basis of both NAV (against benchmarks) and their discounts relative to peer groups.
Growth
Overall, it has been an outstanding year for our growth picks, which outperformed their benchmarks by an average of 3.72% in NAV total return terms to the end of October (excluding RIT Capital Partners (LSE:RCP), which has no formal benchmark). In share price total return terms, the excess return is 2.36% on average. Six of the nine trusts outperformed their benchmarks.
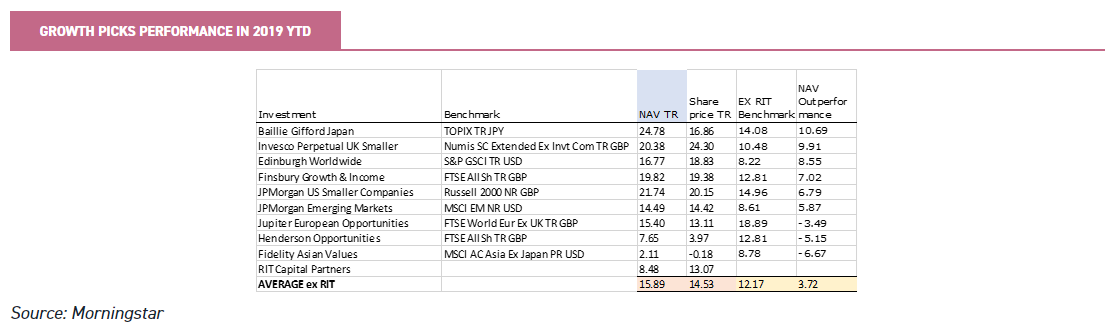
The most notable outperformance came from Baillie Gifford Japan (LSE:BGFD), which returned 24.78% in NAV terms versus its benchmark of 14.08%.
We are primarily concerned with NAV returns in these core picks, reflecting our long-term investment time horizon. However, it is worth noting that BGFD outperformed by only 2.8% in share price terms, as the trust sank to a discount of 4.3% having started the year on a premium.
We use a traffic light system to indicate our short-term views on the trusts in our shortlists, where discounts come into play. In January, we had a ‘red’ or negative view on BGFD in the short term as a result of its high premium; that view has been somewhat justified by the collapse in the rating, although share price returns have been decent despite the rating change, thanks to the trust’s strong NAV performance.
Invesco Perpetual UK Smaller Companies (LSE:IPU) did almost as well as BGFD, outperforming its benchmark by 9.91% in NAV total return terms. As shareholders here we have enjoyed a narrowing discount, such that our notional investment is 13.83% ahead of the index, an outstanding result and the best in the shortlist. The trust currently stands on a premium of 1.5%.
In terms of underperformers, it is no surprise to see that two of the three are those with the strongest value tilts to their portfolio: Fidelity Asian Values (LSE:FAS) and Henderson Opportunities Trust (LSE:HOT). As a reminder of how we have built these portfolios, we have attempted to balance out stylistic exposures across the shortlist.
This is to provide meaningful choice to the imaginary investor using the shortlist, but also because we believe that calling turns in the market is exceptionally hard, and that to some extent investors are always better off hedging their bets. Although these trusts have underperformed relatively, their benchmarks are style agnostic, so we are not surprised or disappointed; although we will review all shortlist constituents in January when we update our quant screens.
The third underperformer is Jupiter European Opportunities (LSE:JEO), where the main problem has been the large position in Wirecard, which has been caught up in controversy around its accounting practices. JEO has always been a volatile stock, and we note that it outperformed in the rally in the first half of the year but has underperformed as markets have come off.
A word on RIT Capital Partners (LSE:RCP). It has three performance comparators: one is share price total return in absolute terms. The second is an absolute NAV performance comparator of RPI plus 3%.
The third is the MSCI All Country World Index hedged 50% back to sterling. Normally we would expect the trust to outperform the equities comparator in rough markets and underperform in strong rallies (and vice versa), given its absolute return approach and the multi-asset nature of the portfolio.
RIT did indeed underperform the equity index by 10%, but also outperformed the RPI plus 3% comparator by 2.8%, which we consider a successful period for a trust that we have picked primarily for its defensive qualities. The premium of 11% is alarming, however, and we would prefer not to allocate more to the trust at those levels, which may affect our thinking when we rework our shortlists in January.
Income
Our income picks have also done extremely well considering the value bias inherent in an income strategy. On average they have marginally outperformed their benchmarks in NAV total return terms, by 0.09%. However, as only two of the benchmarks are explicitly value or dividend-oriented, the trusts have been fighting against the tide.
As a reminder, our income trusts are screened for a combination of total return and income. This is because, compared to the past, we believe more investors need to remain invested in risky assets, and thus to see growth in their portfolios, for a longer period; reflecting the fact that people are living longer and that pension freedoms are allowing them to draw down their savings earlier.
On a total return basis, then, we think our picks have done well over such a short time period, even if the comparison to a total return benchmark is perhaps not the best way of judging the performance of an income portfolio.
If you had invested in each trust equally (not necessarily a sensible asset allocation in reality) we would consider an NAV total return of 12.7% – or 10.8% in share price terms – to be a decent return for a portfolio that is still sitting on an average 4.2% dividend yield. We will examine dividend growth again when we rerun our screens in the New Year, once all the data for 2019 is available and we have a more complete picture of this year’s income performance.
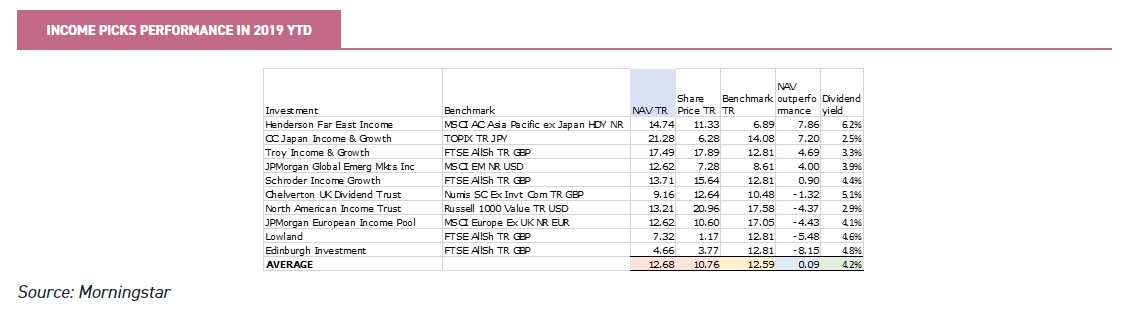
Our shortlist has done better in NAV total return terms than in share price terms, thanks mainly to CC Japan Income & Growth (LSE:CCJI). The trust has swung from a 5% premium to a 5% discount during the year, despite the trust handsomely outperforming the Topix benchmark. In fact, CC Japan Income & Growth is the second best performer versus its benchmark in NAV total return terms, with only Henderson Far East Income pipping it to the post.
The biggest laggard has been Edinburgh IT (LSE:EDIN). The trust has suffered from having some cross-holdings with Neil Woodford’s funds, which have been forced sellers. This is clearly disappointing, but not outside expectations given the travails of Woodford Investment Management.
More recently, we are encouraged by signs that the manager’s central thesis is proving correct; namely that UK domestic earnings are undervalued given the ongoing uncertainty around Brexit. Over the past three months the NAV is up 4.6% compared to 3% for the FTSE All Share.
Over the same time frame the share price is up 10.3%, thanks to the apparent prospect of the Brexit process being resolved. There could be more developments along the way, but there are good indications that the value in the UK is now starting to come through. The trust’s discount is now 11%, having narrowed from a wide point of over 15%. The dividend yield is also an interesting 4.8%, the third highest of the ten trusts.
Annuity
The trusts in our annuity income shortlist are aimed at investors who are less concerned with capital growth and more interested in income. Preservation of capital is a secondary (albeit important) consideration; the strong preference is to maintain capital value in real terms, though some real erosion is acceptable.
Given the difficulty in finding an appropriate benchmark for what are very specialised investments, we have compared their returns to the sector averages.
In both NAV and share price total return terms, our picks have outperformed their sectors on average. In fact, in NAV total return terms, our picks have generated over twice the sector average, at 7.4% compared to 3.2%. However our major focus with these picks is income.
By our calculations, and using Morningstar data, the trusts paid out dividends worth 4.5% of their share price at the start of January, with more dividends yet to come in the fourth quarter. Capital appreciation therefore seems to be running at a little over inflation (CPI was 1.5% annualised last month, with RPI at 2.6%).
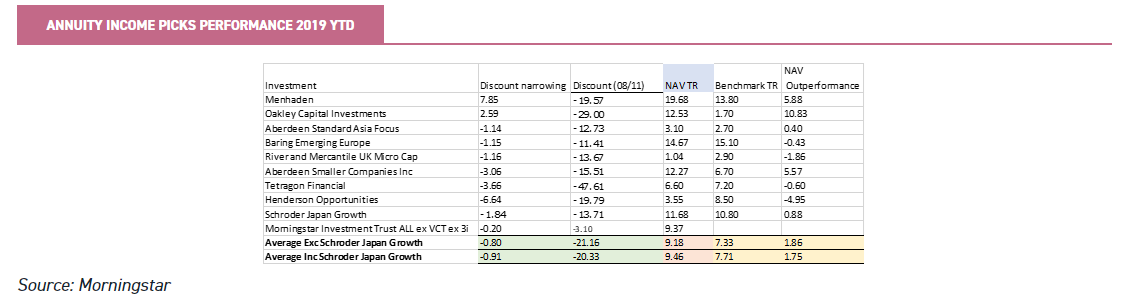
The two best performers in NAV total return terms have been the more conventional fixed income trusts Henderson Diversified Income (LSE:HDIV) and City Merchants High Yield (LSE:CMHY). Both have been aided by the fact that the US Federal Reserve has cut rates and ended its asset tapering programme, as well as by the ECB recommencing asset purchases.
Not only have risk free rates fallen, but spreads have generally narrowed too, boosting capital values. The two trusts’ yields of 5.1% and 5.2% respectively are in line with the average of 5.3% for our shortlist, despite this strong performance.
Despite a decent performance in NAV terms, Aberdeen Diversified Income & Growth (LSE:ADIG) has been the worst performer year to date in share price terms, thanks largely to a widening discount. This trust has suffered from the disastrous results of its major holding in CATCo Reinsurance (LSE:CAT). CAT has been forced into wind-up after an unusual series of extreme weather events that it was economically exposed to.
Discounted Opportunities
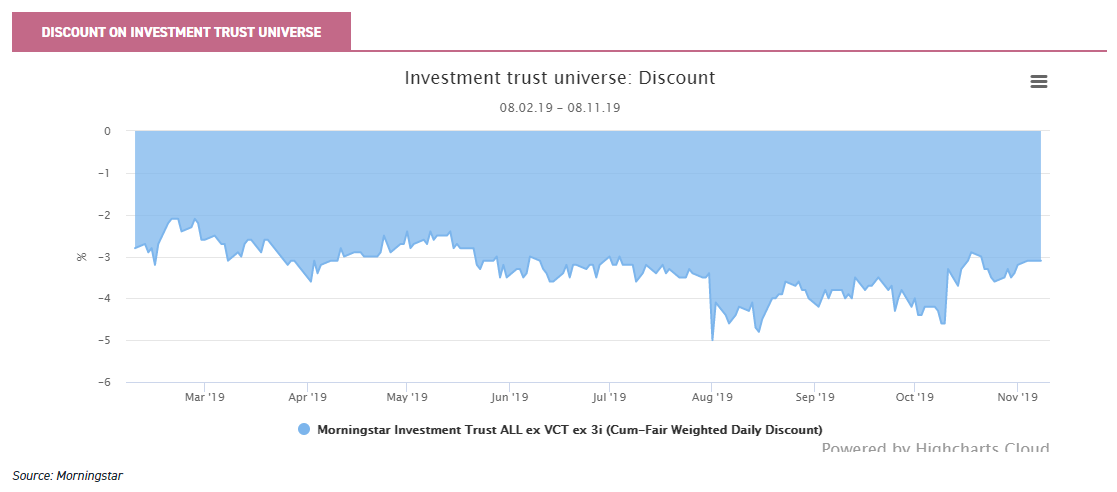
This has been a relatively poor period for playing discounts in the IT sector. When we first unveiled our list in February we flagged up the fact that the end of the cycle was approaching, which meant that discounts were tight in historic terms after their ten-year expansion following the financial crisis.
Even if the sell off over the summer doesn’t prove to be the top of the market, it did result in a widening of the average discount on the broad investment trust universe from 2.8% to 5% by July.
This offers a salutary lesson to investors: that discounts offer an opportunity to accelerate returns in strong markets when they narrow, but can also compound losses when markets reverse.
Since July the average discount has come back in to 3% (just 0.2% wider than its starting point). For our shortlist of discounted opportunities the movement in the average discount has been roughly equivalent to a widening of 0.8%.
Pleasingly, however, the average outperformance of each trust’s respective benchmark in NAV total return terms has been 1.86%. This provides some evidence that our picks are attractive investments, notwithstanding any discount opportunities. Five of the nine trusts outperformed in NAV total return and share price total return terms.
The most impressive mover so far has been Menhaden (LSE:MHN), which has seen its discount narrow by almost eight percentage points and the trust outperform its benchmark by almost 6%.
The market seems to have started to recognise the point we have been making, that the trust’s strategy has been completely overhauled since its disappointing early returns. It has outperformed the MSCI ACWI significantly in NAV total return terms over one year and since we listed our picks in February.
Despite the discount having narrowed, Menhaden’s current discount of 19% is still attractive, in our view. As we note in our most recent profile, assuming the current private market deals are completed, the underlying liquidity of the portfolio will have been transformed, which could help to further narrow the discount.
Oakley Capital Investments (LSE:OCI) is another trust that has seen its discount narrow, although it remains on a much wider discount than the listed private equity sector average (17.9%). The OCI discount came in close to the private equity sector average over the summer, but then widened while Woodford Investment Management’s stake was being sold down; nor has the share price kept up with the strong NAV performance.
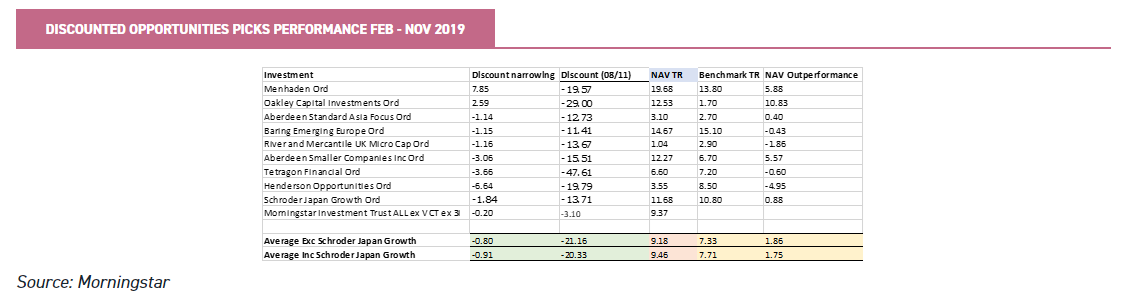
The biggest widening has been on Henderson Opportunities (LSE:HOT). We think this is a great long-term opportunity; but it is value-tilted, UK-focused and highly geared, so it needs a bullish market environment to see the discount narrow.
Given international investor sentiment towards the UK, it was no surprise to see the discount widen yet further over the summer. We introduced Schroder Japan Growth (LSE:SJG) to the shortlist in May, believing that the discount that had opened up after a change of manager was unwarranted. The trust has been somewhat out of favour so far in 2019, as high growth trusts have done best in the Japan sector this year.
We think there could be better news for our discount picks in the next few months, for three main reasons.
The first is we think the summer downdraught in markets has been exhausted. Overall the US and UK economies look in good shape, with recent interest rate easing in the US likely to be enough to support the market in the medium term. This more positive global picture should provide better support for a re-rating in risky assets such as cheap investment trusts.
The second reason is the violent shift from growth to value in the third quarter of 2019, which we believe has left investors more open to trusts with a value style; and perhaps more on the lookout for undervalued opportunities as replacements for their momentum plays. The evidence can be seen in Aberforth Smaller Companies (LSE:ASL).
This trust has seen a rapid narrowing of the discount on the back of strong NAV performance and better sentiment towards value managers. A number of our other shortlist trusts could also benefit from this trend: either because they have a tilt towards a value strategy (such as Henderson Opportunities) or because they are exposed to esoteric markets which are cheap in themselves (such as Baring Emerging Europe (LSE:BEE) or River and Mercantile UK Micro Cap (LSE:RMMC)).
The third reason is the more positive outlook for a Brexit deal, which should help our UK picks. We think that, if a deal is finalised, there is enough investor cash on the sidelines to induce a significant relief rally. This should be the outcome even if years of horse-trading over the final EU trade deal then ensue.
In support of this view we would point to 2017; after the initial shock of the referendum vote, markets rallied strongly on the grounds that the UK’s withdrawal date seemed far enough away to ignore. The FTSE 250 Index, used by many investors as a proxy for the UK domestic economy, was up 17.7% in 2017.
In the New Year we will be re-examining our picks across the four shortlists.
Kepler Partners is a third-party supplier and not part of interactive investor. Neither Kepler Partners or interactive investor will be responsible for any losses that may be incurred as a result of a trading idea.
Full performance can be found on the company or index summary page on the interactive investor website. Simply click on the company's or index name highlighted in the article.
Important Information
Kepler Partners is not authorised to make recommendations to Retail Clients. This report is based on factual information only, and is solely for information purposes only and any views contained in it must not be construed as investment or tax advice or a recommendation to buy, sell or take any action in relation to any investment.
This report has been issued by Kepler Partners LLP solely for information purposes only and the views contained in it must not be construed as investment or tax advice or a recommendation to buy, sell or take any action in relation to any investment. If you are unclear about any of the information on this website or its suitability for you, please contact your financial or tax adviser, or an independent financial or tax adviser before making any investment or financial decisions.
The information provided on this website is not intended for distribution to, or use by, any person or entity in any jurisdiction or country where such distribution or use would be contrary to law or regulation or which would subject Kepler Partners LLP to any registration requirement within such jurisdiction or country. Persons who access this information are required to inform themselves and to comply with any such restrictions. In particular, this website is exclusively for non-US Persons. The information in this website is not for distribution to and does not constitute an offer to sell or the solicitation of any offer to buy any securities in the United States of America to or for the benefit of US Persons.
This is a marketing document, should be considered non-independent research and is subject to the rules in COBS 12.3 relating to such research. It has not been prepared in accordance with legal requirements designed to promote the independence of investment research.
No representation or warranty, express or implied, is given by any person as to the accuracy or completeness of the information and no responsibility or liability is accepted for the accuracy or sufficiency of any of the information, for any errors, omissions or misstatements, negligent or otherwise. Any views and opinions, whilst given in good faith, are subject to change without notice.
This is not an official confirmation of terms and is not to be taken as advice to take any action in relation to any investment mentioned herein. Any prices or quotations contained herein are indicative only.
Kepler Partners LLP (including its partners, employees and representatives) or a connected person may have positions in or options on the securities detailed in this report, and may buy, sell or offer to purchase or sell such securities from time to time, but will at all times be subject to restrictions imposed by the firm's internal rules. A copy of the firm's conflict of interest policy is available on request.
Past performance is not necessarily a guide to the future. The value of investments can fall as well as rise and you may get back less than you invested when you decide to sell your investments. It is strongly recommended that Independent financial advice should be taken before entering into any financial transaction.
PLEASE SEE ALSO OUR TERMS AND CONDITIONS
Kepler Partners LLP is a limited liability partnership registered in England and Wales at 9/10 Savile Row, London W1S 3PF with registered number OC334771.
Kepler Partners LLP is authorised and regulated by the Financial Conduct Authority.
Kepler Partners is a third-party supplier and not part of interactive investor. Neither Kepler Partners or interactive investor will be responsible for any losses that may be incurred as a result of a trading idea.
These articles are provided for information purposes only. Occasionally, an opinion about whether to buy or sell a specific investment may be provided by third parties. The content is not intended to be a personal recommendation to buy or sell any financial instrument or product, or to adopt any investment strategy as it is not provided based on an assessment of your investing knowledge and experience, your financial situation or your investment objectives. The value of your investments, and the income derived from them, may go down as well as up. You may not get back all the money that you invest. The investments referred to in this article may not be suitable for all investors, and if in doubt, an investor should seek advice from a qualified investment adviser.
Full performance can be found on the company or index summary page on the interactive investor website. Simply click on the company's or index name highlighted in the article.
Important Information
Kepler Partners is not authorised to make recommendations to Retail Clients. This report is based on factual information only, and is solely for information purposes only and any views contained in it must not be construed as investment or tax advice or a recommendation to buy, sell or take any action in relation to any investment.
This report has been issued by Kepler Partners LLP solely for information purposes only and the views contained in it must not be construed as investment or tax advice or a recommendation to buy, sell or take any action in relation to any investment. If you are unclear about any of the information on this website or its suitability for you, please contact your financial or tax adviser, or an independent financial or tax adviser before making any investment or financial decisions.
The information provided on this website is not intended for distribution to, or use by, any person or entity in any jurisdiction or country where such distribution or use would be contrary to law or regulation or which would subject Kepler Partners LLP to any registration requirement within such jurisdiction or country. Persons who access this information are required to inform themselves and to comply with any such restrictions. In particular, this website is exclusively for non-US Persons. The information in this website is not for distribution to and does not constitute an offer to sell or the solicitation of any offer to buy any securities in the United States of America to or for the benefit of US Persons.
This is a marketing document, should be considered non-independent research and is subject to the rules in COBS 12.3 relating to such research. It has not been prepared in accordance with legal requirements designed to promote the independence of investment research.
No representation or warranty, express or implied, is given by any person as to the accuracy or completeness of the information and no responsibility or liability is accepted for the accuracy or sufficiency of any of the information, for any errors, omissions or misstatements, negligent or otherwise. Any views and opinions, whilst given in good faith, are subject to change without notice.
This is not an official confirmation of terms and is not to be taken as advice to take any action in relation to any investment mentioned herein. Any prices or quotations contained herein are indicative only.
Kepler Partners LLP (including its partners, employees and representatives) or a connected person may have positions in or options on the securities detailed in this report, and may buy, sell or offer to purchase or sell such securities from time to time, but will at all times be subject to restrictions imposed by the firm's internal rules. A copy of the firm's conflict of interest policy is available on request.
Past performance is not necessarily a guide to the future. The value of investments can fall as well as rise and you may get back less than you invested when you decide to sell your investments. It is strongly recommended that Independent financial advice should be taken before entering into any financial transaction.
PLEASE SEE ALSO OUR TERMS AND CONDITIONS
Kepler Partners LLP is a limited liability partnership registered in England and Wales at 9/10 Savile Row, London W1S 3PF with registered number OC334771.
Kepler Partners LLP is authorised and regulated by the Financial Conduct Authority.
These articles are provided for information purposes only. Occasionally, an opinion about whether to buy or sell a specific investment may be provided by third parties. The content is not intended to be a personal recommendation to buy or sell any financial instrument or product, or to adopt any investment strategy as it is not provided based on an assessment of your investing knowledge and experience, your financial situation or your investment objectives. The value of your investments, and the income derived from them, may go down as well as up. You may not get back all the money that you invest. The investments referred to in this article may not be suitable for all investors, and if in doubt, an investor should seek advice from a qualified investment adviser.
Full performance can be found on the company or index summary page on the interactive investor website. Simply click on the company's or index name highlighted in the article.