The top 20 most active investment trust managers
Here are the most active managers across the major closed-ended equity sectors. Six might surprise you.
19th July 2019 16:14
This content is provided by Kepler Trust Intelligence, an investment trust focused website for private and professional investors. Kepler Trust Intelligence is a third-party supplier and not part of interactive investor. It is provided for information only and does not constitute a personal recommendation.
Material produced by Kepler Trust Intelligence should be considered a marketing communication, and is not independent research.
In the second part of our active management series, we assess the most active managers across the major closed-ended equity sectors. Six of them might surprise you.

Ready for action
William Sobczak, analyst at Kepler Trust Intelligence.
In our recent research, Measure for Measure, we discussed the importance of a manager's activeness and the difficulties involved in gauging it. As we have highlighted before, the chance of generating alpha generally rises with how active a manager is, and the UK closed-ended universe has become significantly more active in response to the challenge of cheap passive products. In that article we took a look at a range of measures for assessing the ‘activeness’ of a manager and their strengths and weaknesses.
In this article we take a deep dive into the numbers, using tracking error, concentration, gearing and sector movements to look at how active the managers are across the major closed-ended equity sectors; the UK All Companies, UK Equity Income, Global, Global Equity Income, Japan, Europe and North American sectors. We rank the trusts based on each individual metric, but also relative to the rest of the sectors. Finally, we discuss which trusts stand out across the different metrics, and establish an overall ranking for each trust.
Tracking error
Also known as active risk, tracking error indicates the volatility of the difference in returns between a fund and its benchmark. The advantage of the measure is that it is derived from actual returns, so it highlights whether the behaviour of a fund has been unlike the index.
In order to be considered eligible for the analysis, we used R2 to select an appropriate benchmark, first looking for the provider benchmark as held by Morningstar, then substituting or adding as appropriate.
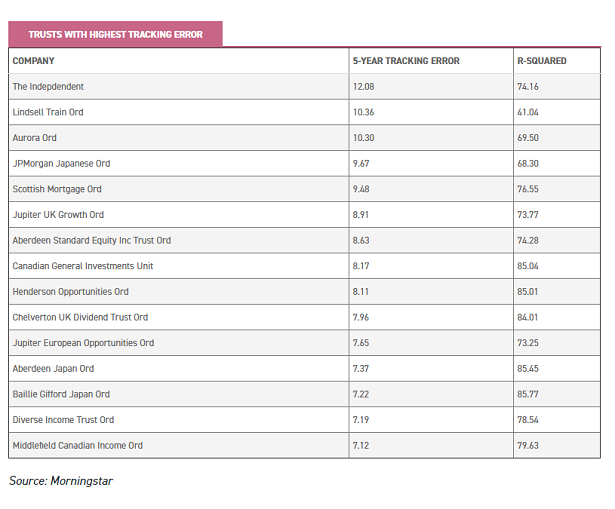
The end result was 76 trusts across the seven sectors, of which 35 had a tracking error of more than 5 over a five-year period. As can be seen below, the top 15 included a wide spread of strategies and geographies, with The Independent Investment Tust (IIT) taking the top spot with a tracking error of 12.08.
The company is run by long-term manager Max Ward, who follows no formal style or process in his investment approach, believing that this can cause managers to be restrained in their approach. As one might guess, Max pays absolutely no attention to an index when building the portfolio and the end result is a company with an active share of almost 100%.
Alongside IIT, Lindsell Train (LSE:LTI) is another trust that stands out for tracking error. We should note that the trust's R2 against the most appropriate benchmark we could find was below our eligibility limit, however this is due to the 46.7% holding in Lindsell Train Limited, an unlisted company, and the totally benchmark-agnostic approach. While the use of any particular benchmark could be queried for this trust, the activeness cannot.
Another company near the top of the list that might surprise investors is Scottish Mortgage (LSE:SMT). With close to 90 holdings, a tracking error of 9.48 seems high, however, the trust has a high percentage of its assets in the top ten as we discuss below, and an active share of 94%.
Concentration
Portfolio concentration is another measure that can give information about how active a manager is. There are two ways this can be measured; through the number of holdings and the percentage of assets the top holdings make up. In our view, concentration can be seen as a good measure of the confidence a manager has in his convictions.
According to our analysis, 21 trusts have 50 holdings or fewer, and interestingly the names are similar to those in the tracking error table.
Additionally, there is significant crossover between our two measures: many of the same names appear in the list of trusts with the fewest holdings and with the most in the largest ten positions.
As we noted in our prior article, we are seeing a significant increase in the percentage of net assets in the top ten holdings as closed-ended fund managers respond to the challenge of passives by getting more concentrated. The average trust now has over 40% of their net assets in their top ten holdings, increasing by nearly 6% from 34% in the prior year.
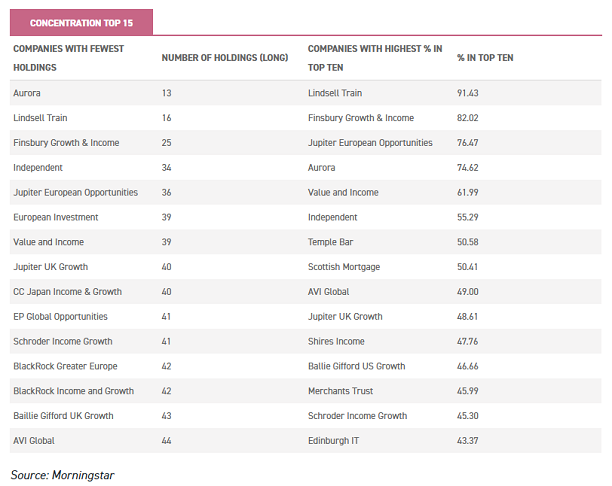
Both of Nick Train's trusts, Lindsell Train and Finsbury Growth & Income (LSE:FGT), stand out for having a high allocation to the top ten holdings.
Additionally, Jupiter European Opportunities (LSE:JEO) has a large proportion of its assets in the top 10. Recently, JEO demonstrated the risk of being so concentrated. The trust was hit when Wirecard, its largest holding at 17% of NAV, was caught up in allegations of fraud.
The allegations have yet to be proved, and the police investigation in Singapore is ongoing, so the end effect of this situation is unclear, but with such a high percentage of the trust in the stock, any serious fall would be a big blow.
However, the manager has expressed his view that the company is being unfairly attacked, and its travails have not stopped JEO from posting good returns this year. Furthermore, the potential in a high conviction approach can be seen in the trust's exceptional long-term performance numbers, with the trust outperforming all AIC Europe peers over three- and five-year periods.
AVI Global is a trust which has seen performance improve following a decision by the manager to invest in a more high conviction manner. The statistics above represent a full look through on the portfolio, although if one considers the companies investment in it's Japan Special Situations basket (representing holdings in 18 different companies with a high degree of overlap to AVI Japan Trust) as one "position", the portfolio can be considered even more concentrated.
Tactical positioning
Another way of looking at how active a manager is to look at their 'tactical positioning'. Some managers move their portfolio quickly in accordance with their market views. When they do this in a direction which is counter to the direction of the market, this amounts to an active approach.
To evaluate this, we looked at the changes in gearing and cyclical/defensive positioning over Q4 of 2018 and Q1 of 2019, a sharp correction and a sharp rally. We looked at the managers who moved against the market, first by looking at how much they have changed the gearing, and secondly by shifting their portfolio into cyclicals when the market was falling or into defensives as the market was rallying.
We recognise that this is the opposite to how some ‘active managers’ like Nick Train or Terry Smith, who have very long holding periods and don’t move their positioning based on temporary factors, go about their business. However, we think this is another aspect of active management that is worth considering.
Below one can see the top 15 managers who have been most active in shifting the gearing over the two periods. It is clear that there were smaller movements in the Q4 of 2018 and larger changes in Q1 of 2019, perhaps because Q3 was also a difficult period and so managers had already shifted their positioning somewhat. In fact, in Q4 of 2018 there was on average a movement of just 2.08%, in comparison to changes of 4.1% in Q1 of 2019.
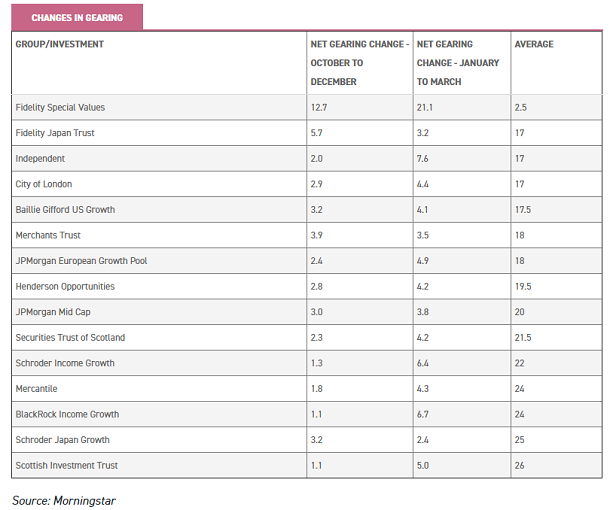
Fidelity Special Values (LSE:FSV) is the only trust that saw double digit movements over both periods. The trust is run by Alex Wright, who aims to identify under-valued companies from across the UK market cap spectrum and hold onto them until the price properly reflects their value.
Alex has employed the gearing in a contrarian fashion in recent years, reducing it during the rising market of 2016 and 2017, but increasing it through 2018 as markets have fallen.
Somewhat unusually, FSV uses contracts-for-difference (CFDs) to provide gearing (and to go short). The level of gearing is left to the manager's discretion within a net range of 0-20% in ordinary conditions, although 40% is technically permitted. The Independent Investment Trust , City of London (LSE:CTY) and Baillie Gifford US Growth (LSE:USA) also saw large movements in their gearing levels.
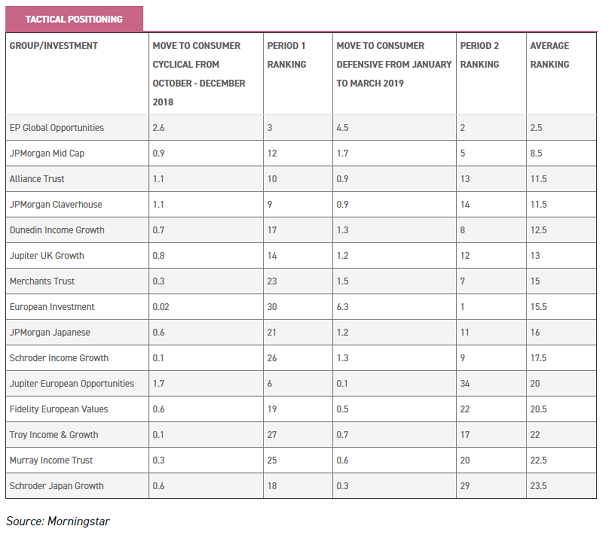
When comparing the consumer cyclical movements and the consumer defensive movements over the two periods, once more the second period saw considerably greater moves.
EP Global Opportunities (LSE:EPG) saw the greatest movement in Q4 of 2018, and in fact the greatest movements overall. The company has a valuation-led approach, presumably explaining the moves against the grain into cyclicals and then defensives during Q4 2018 and Q1 2019 respectively.
The trust's investment policy includes being highly differentiated from its peers, as the board believes the universe has become narrow in their investment objectives and this has caused constrained decision making. It is therefore unsurprising to see the trust looking highly active in its behaviour.
Over the second period we saw far more subtle movements into defensives during the rally and only European Investment (LSE:EUT) moved by over 5%. The company is highly concentrated, and holds just 39 companies. As one might imagine, the manager, Craig Armour, adopts a long-term approach to investing which is focused on company valuations. During periods of market volatility, he aims to keep his discipline and look to take advantage of any valuation anomalies which emerge.
The most active trusts…
Before looking at the end result, it is worth reiterating that we recognise that there are two ways of being active. Managers can take long-term positions relative to the index, holding these positions over the long term regardless of temporary conditions.
Examples include the likes of Lindsell Train, Finsbury Growth and Income, Independent and Jupiter European Opportunities, all of which have low exceptionally high concentration portfolios, coupled with low turnover ratios and high tracking errors.
Alternatively, a manager can be considered active if they move their portfolio around more frequently as long as that is not just following the market. Examples highlighted above include Fidelity Special Values, EP Global Opportunities and JPMorgan Mid Cap (LSE:JMF), all of which have shifted their portfolios significantly according to the conditions in recent quarters, whether it be through gearing or through cyclical and defensive exposure.
Nevertheless, after collating the data for all of the trusts, across the seven sectors and the five measures, we can take an average to find which trusts combine all the different elements of active management discussed. Below, we can see the rankings of the top 20 trusts in the different metrics and the final average of their rankings.
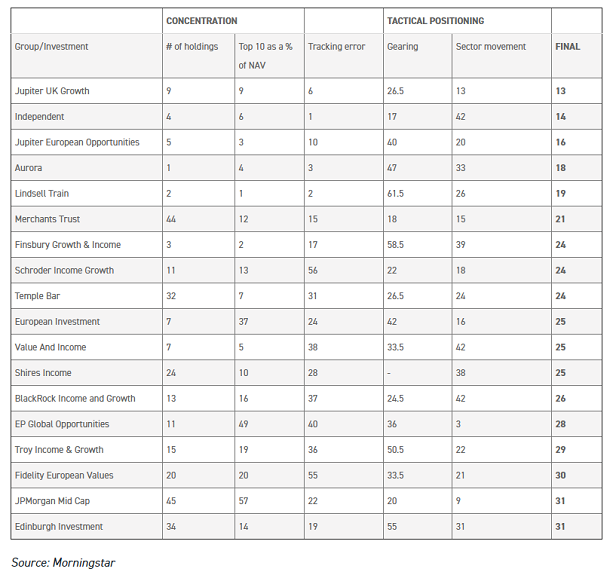
Source: Morningstar
Some of the 'most active managers' are those investors may have expected, such as Independent, Jupiter European Opportunities, and the two Lindsell Train trusts. However, there are some trusts that might not immediately spring to mind, which we highlight below.
Jupiter UK Growth (JUKG)
Jupiter UK Growth (LSE:JUKG), the most active on average, according to our ranking, aims to offer investors capital appreciation from a highly concentrated portfolio made up of the manager's best ideas.
As we saw in the analysis, the company holds just 40 holdings and the manager, Steve Davies, isn't afraid to hold positions that significantly deviate from the fund's benchmark. Steve, who took over in 2016, focusses on two specific types of opportunity; growth stocks and recovery stocks.
Growth stocks are identified through looking at cash flows and include those that the manager believes can generate above‐average rates of growth over an extended time period.
In comparison, recovery stocks are those that have been written off or deemed uninvestible by the market. The manager won't hold a company that doesn't meet either his growth or recovery criteria, regardless of its size in the index, which leads to large fluctuations in returns in comparison to peers and the benchmark. This is reflected in the tracking error of almost 9%, the sixth highest of all the trusts we looked at.
Schroder Income Growth (SCF)
Schroder Income Growth (LSE:SCF) aims to provide real growth of income, in excess of inflation, while growing capital for investors. The long-serving lead manager, Sue Noffke, invests primarily in above-average yielding UK equities, but also has the capability to invest up to 20% of the portfolio outside the UK.
Fundamental research sits at the heart of the process and the experienced team look to take advantage of market inefficiencies, identifying out of favour companies that will outperform over the long term.
With this said, Sue always has risk in mind, and ensures that the portfolio is not over exposed to particular sectors or styles. The trust has just 41 holdings, of which the top 10 make up close to 45% of the net assets.
As we saw in the tactical positioning results, Sue isn't afraid to shift the portfolio around and uses gearing to enhance returns. She has increased the gearing in 2019 in anticipation of a rebound in UK equities once the next steps in the Brexit process are clearer. The company sits in the top half of the 24 strong sector for NAV total returns over one, three and five years. We published a full note on the trust in May.
Dunedin Income Growth
Dunedin Income Growth (LSE:DIG) sits in the UK Equity Income sector, aiming to grow capital and income in excess of the FTSE All Share. The trust stands out in the AIC sector due to its large exposure to European stocks, helping the managers to diversify their distributions and take advantage of their extensive knowledge of the Pan-European space. This is reflected in the 5.29% tracking error over the past five years.
The trust is run by Ben Ritchie and Louise Kernohan at Aberdeen Standard, who have been implementing a change in strategy since 2016. The aim was to shift the portfolio towards stocks with more attractive growth characteristics, whilst maintaining the dividend at a high level throughout – the current yield is 4.5%, compared to a sector weighted average of 3.8%.
The pair look to identify high quality companies at reasonable valuations and this involves analysing the strength of balance sheets, management teams and business models, with a high importance placed on face-to-face company meetings. The portfolio is comprised of 51 holdings, towards the top end of their anticipated range of 40-60. Of this the top ten holdings make up 37.8%. We updated our note on the trust in May.
BlackRock Income Growth
BlackRock Income and Growth (LSE:BRIG) has twin aims of providing a rising dividend, but also growth in capital over the long term.
The trust is managed by Adam Avigdori and David Goldman who employ a high-conviction approach to stock picking, with the portfolio expected to have between 30 to 60 holdings at any one time - currently numbering 42.
The team buy companies purely on an opportunity led basis, but try to provide some diversification across the portfolio through allocating across three "buckets"; yield and free-cashflow, growth opportunities and turnaround situations.
As befits a team of stockpickers, the trust has generated strong returns over long term, generating NAV total returns of 42.8% over five years, relative to 38.3% from the FTSE All Share. We published a full note on the trust in June.
JPMorgan Mid Cap
JPMorgan Mid Cap (LSE:JMF) aims to generate long-term capital growth from UK mid-cap stocks by using quantitative research and fundamental stock analysis to take advantage of investor psychology and inefficiencies in the market.
The managers, Georgina Brittain and Katen Patel, believe this approach is perfectly suited to the mid-cap market as it is less well covered by analysts than the large-cap market and is therefore less efficient, meaning that there are many opportunities to gain an edge with superior analysis.
The managers use a quantitative screening system JPMorgan Asset Management has developed incorporating various value, quality and momentum attributes of companies, which JPMAM believes have been shown to be persistent across time and to generate alpha.
The benefits of this were seen when the managers shifted the portfolio away from that of the index and peers in Q4 of 2018 and Q1 of 2019, as shown in the tactical positioning section, and helping the trust to outperform the benchmark dramatically in 2019. This decision to go against the grain is not uncommon for the managers, and this is reflected in the tracking error of 5.99%. We updated our research on the trust last week.
AVI Global
AVI Global Trust (LSE:BTEM) has plenty of peers in the Global sector, but none that look anything quite like it. The portfolio is assembled on its value merits, but on an underlying basis, many of the holdings are high quality growth stories.
In an age when many investment portfolios are assembled using a "painting by numbers" approach, it is perhaps no wonder that the discount remains stubbornly wide.
We believe the good performance numbers from 2016 onwards are a direct result of the changes that Joe Bauernfreund implemented in late 2015. We think this trust offers excellent diversification benefits, holding investments which are unlikely to be held by the average investor or really represented in any way in an index – a true mark of being genuinely active. Our most recent profile of the trust can be seen here.
Kepler Partners is a third-party supplier and not part of interactive investor. Neither Kepler Partners or interactive investor will be responsible for any losses that may be incurred as a result of a trading idea.
Full performance can be found on the company or index summary page on the interactive investor website. Simply click on the company's or index name highlighted in the article.
Important Information
Kepler Partners is not authorised to make recommendations to Retail Clients. This report is based on factual information only, and is solely for information purposes only and any views contained in it must not be construed as investment or tax advice or a recommendation to buy, sell or take any action in relation to any investment.
This report has been issued by Kepler Partners LLP solely for information purposes only and the views contained in it must not be construed as investment or tax advice or a recommendation to buy, sell or take any action in relation to any investment. If you are unclear about any of the information on this website or its suitability for you, please contact your financial or tax adviser, or an independent financial or tax adviser before making any investment or financial decisions.
The information provided on this website is not intended for distribution to, or use by, any person or entity in any jurisdiction or country where such distribution or use would be contrary to law or regulation or which would subject Kepler Partners LLP to any registration requirement within such jurisdiction or country. Persons who access this information are required to inform themselves and to comply with any such restrictions. In particular, this website is exclusively for non-US Persons. The information in this website is not for distribution to and does not constitute an offer to sell or the solicitation of any offer to buy any securities in the United States of America to or for the benefit of US Persons.
This is a marketing document, should be considered non-independent research and is subject to the rules in COBS 12.3 relating to such research. It has not been prepared in accordance with legal requirements designed to promote the independence of investment research.
No representation or warranty, express or implied, is given by any person as to the accuracy or completeness of the information and no responsibility or liability is accepted for the accuracy or sufficiency of any of the information, for any errors, omissions or misstatements, negligent or otherwise. Any views and opinions, whilst given in good faith, are subject to change without notice.
This is not an official confirmation of terms and is not to be taken as advice to take any action in relation to any investment mentioned herein. Any prices or quotations contained herein are indicative only.
Kepler Partners LLP (including its partners, employees and representatives) or a connected person may have positions in or options on the securities detailed in this report, and may buy, sell or offer to purchase or sell such securities from time to time, but will at all times be subject to restrictions imposed by the firm's internal rules. A copy of the firm's conflict of interest policy is available on request.
Past performance is not necessarily a guide to the future. The value of investments can fall as well as rise and you may get back less than you invested when you decide to sell your investments. It is strongly recommended that Independent financial advice should be taken before entering into any financial transaction.
PLEASE SEE ALSO OUR TERMS AND CONDITIONS
Kepler Partners LLP is a limited liability partnership registered in England and Wales at 9/10 Savile Row, London W1S 3PF with registered number OC334771.
Kepler Partners LLP is authorised and regulated by the Financial Conduct Authority.
Kepler Partners is a third-party supplier and not part of interactive investor. Neither Kepler Partners or interactive investor will be responsible for any losses that may be incurred as a result of a trading idea.
These articles are provided for information purposes only. Occasionally, an opinion about whether to buy or sell a specific investment may be provided by third parties. The content is not intended to be a personal recommendation to buy or sell any financial instrument or product, or to adopt any investment strategy as it is not provided based on an assessment of your investing knowledge and experience, your financial situation or your investment objectives. The value of your investments, and the income derived from them, may go down as well as up. You may not get back all the money that you invest. The investments referred to in this article may not be suitable for all investors, and if in doubt, an investor should seek advice from a qualified investment adviser.
Full performance can be found on the company or index summary page on the interactive investor website. Simply click on the company's or index name highlighted in the article.
Important Information
Kepler Partners is not authorised to make recommendations to Retail Clients. This report is based on factual information only, and is solely for information purposes only and any views contained in it must not be construed as investment or tax advice or a recommendation to buy, sell or take any action in relation to any investment.
This report has been issued by Kepler Partners LLP solely for information purposes only and the views contained in it must not be construed as investment or tax advice or a recommendation to buy, sell or take any action in relation to any investment. If you are unclear about any of the information on this website or its suitability for you, please contact your financial or tax adviser, or an independent financial or tax adviser before making any investment or financial decisions.
The information provided on this website is not intended for distribution to, or use by, any person or entity in any jurisdiction or country where such distribution or use would be contrary to law or regulation or which would subject Kepler Partners LLP to any registration requirement within such jurisdiction or country. Persons who access this information are required to inform themselves and to comply with any such restrictions. In particular, this website is exclusively for non-US Persons. The information in this website is not for distribution to and does not constitute an offer to sell or the solicitation of any offer to buy any securities in the United States of America to or for the benefit of US Persons.
This is a marketing document, should be considered non-independent research and is subject to the rules in COBS 12.3 relating to such research. It has not been prepared in accordance with legal requirements designed to promote the independence of investment research.
No representation or warranty, express or implied, is given by any person as to the accuracy or completeness of the information and no responsibility or liability is accepted for the accuracy or sufficiency of any of the information, for any errors, omissions or misstatements, negligent or otherwise. Any views and opinions, whilst given in good faith, are subject to change without notice.
This is not an official confirmation of terms and is not to be taken as advice to take any action in relation to any investment mentioned herein. Any prices or quotations contained herein are indicative only.
Kepler Partners LLP (including its partners, employees and representatives) or a connected person may have positions in or options on the securities detailed in this report, and may buy, sell or offer to purchase or sell such securities from time to time, but will at all times be subject to restrictions imposed by the firm's internal rules. A copy of the firm's conflict of interest policy is available on request.
Past performance is not necessarily a guide to the future. The value of investments can fall as well as rise and you may get back less than you invested when you decide to sell your investments. It is strongly recommended that Independent financial advice should be taken before entering into any financial transaction.
PLEASE SEE ALSO OUR TERMS AND CONDITIONS
Kepler Partners LLP is a limited liability partnership registered in England and Wales at 9/10 Savile Row, London W1S 3PF with registered number OC334771.
Kepler Partners LLP is authorised and regulated by the Financial Conduct Authority.
These articles are provided for information purposes only. Occasionally, an opinion about whether to buy or sell a specific investment may be provided by third parties. The content is not intended to be a personal recommendation to buy or sell any financial instrument or product, or to adopt any investment strategy as it is not provided based on an assessment of your investing knowledge and experience, your financial situation or your investment objectives. The value of your investments, and the income derived from them, may go down as well as up. You may not get back all the money that you invest. The investments referred to in this article may not be suitable for all investors, and if in doubt, an investor should seek advice from a qualified investment adviser.
Full performance can be found on the company or index summary page on the interactive investor website. Simply click on the company's or index name highlighted in the article.