A trust strategy to achieve more effective diversification
We examine evolving correlations between different emerging markets and strategies to diversify returns.
17th January 2020 15:16
This content is provided by Kepler Trust Intelligence, an investment trust focused website for private and professional investors. Kepler Trust Intelligence is a third-party supplier and not part of interactive investor. It is provided for information only and does not constitute a personal recommendation.
Material produced by Kepler Trust Intelligence should be considered a marketing communication, and is not independent research.
We examine how correlations between different emerging markets have evolved, and whether single country strategies could diversify returns.

Drifting apart: how emerging markets have become less correlated
Callum Stokeld, investment trust research analyst at Kepler Trust Intelligence.
It is something of a truism to say that emerging markets are not a homogenous blob, but a range of highly differentiated economies and stock markets. Yet as investors, we often categorise them as one and the same, especially from an asset allocation and risk management perspective.
Recently, the Kepler Trust Intelligence team picked individual investment trusts for 2020. Our normally diligent workplace accelerated into a swirling Stakhanovitian swarm of research and intellectual war-gaming, as we all took to heart Pyrrhus’ lesson that to win at all costs was the main thing (apart from Pascal, who picked his in the pub and is thus almost certain to win).
Unsurprisingly, from a group looking for the greatest upside, a plethora of single-country emerging market strategies came under scrutiny, with one even being selected (JP Morgan Russia). But we all looked at a range of different single-country and regional country strategies, and our rationale for why each might outperform was often quite different.
Increasingly, divergences can be seen in how these markets correlate to one another as they mature. One of the key drivers behind this is that domestic savers are becoming ever more important in many markets. At the same time, while we have seen some amelioration of recent trade tensions, longer-term geopolitical vying for supremacy in the Pacific region seems likely to inform US and Chinese relations for some time to come.
Many investors operate back-tested asset allocation models as a starting reference points for risk management, seeking to match experienced volatility to a broader portfolio volatility framework with reference to inter-asset class correlations. However, whilst Asia-Pacific and Global Emerging Markets are typically merged into broad asset classes, single-market exposure to some of the underlying markets may give better and more effective diversification.
How correlations have evolved over the past ten years
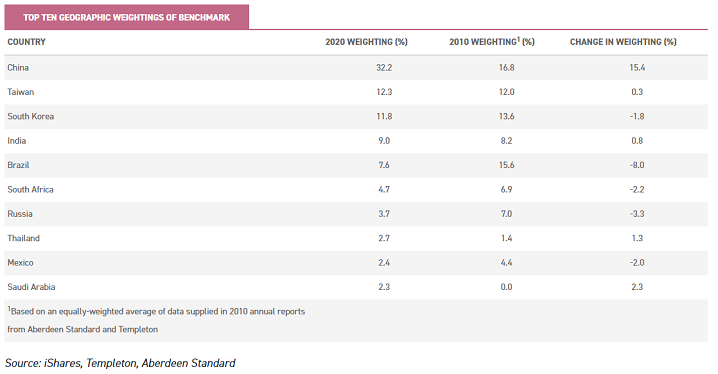
As noted above, this observation on variations within these markets is nothing new; but has their relationship to one another changed? Certainly, within the EM indices, country exposure has evolved quite considerably as the table below illustrates.
Throughout this document, we have referred to r-squared (r2); in this context, this is a measure of the percentage of a index's movements that can be explained by movements in the other index.
The benchmark’s change in weighting to Chinese stocks over the past ten years will likely have a material impact on correlations, and we would therefore expect Chinese stocks to display a higher r-squared (R2). The only other market to have a major divergence is the Brazilian market, which has seen its proportional share drop significantly.
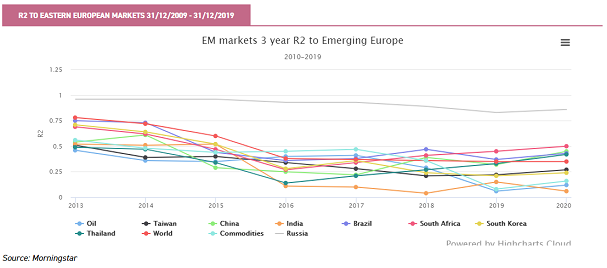
In evaluating how individual markets have been correlated to the benchmark returns, a snapshot data point offers little by the way of illustration; correlations are cyclical and variable. Instead, in order to examine any patterns, we have first looked at trends in changes in r-squared over the past 10 years relative to emerging markets as a whole (represented here by a passive product). We can see below how the R2 to the wider EM index has evolved for the major markets in the index (with the exception of the Saudi Arabian market, where there are few products offering exposure).
The graph below shows the R2 of each market index relative to the broad EM universe over a rolling 3-year period (i.e. the 2013 data point shows the R2 over the period 2010-2013, and 2014 shows the period 2011-2014 etc). It shows that, of all the major EM markets, only the Chinese market has seen its R2 to the broader emerging market universe increase over this period; furthermore it is the only one above its median reading for this period. The others have exhibited a general trend of declining correlations.
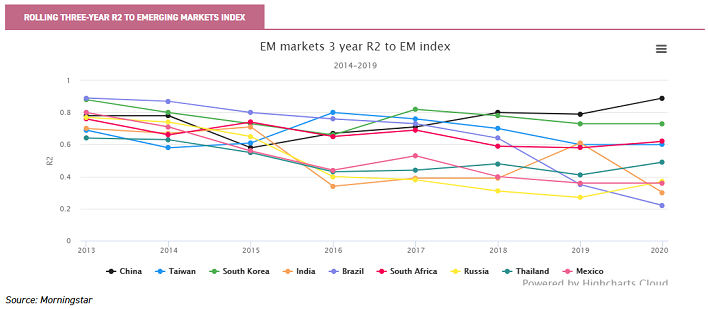
Apart from China, all the major emerging markets (including Hong Kong) show a clear decline in their R2 to the wider benchmark. However, this still tells us little of the dynamics which drive these different markets, or how they correlate to wider global equity markets.
Clearly, each country has very different listed equity markets, composed of very different industries. Sector exposure can therefore be regarded as a driver of relative performance in different macro environments. The table below illustrates that there are substantial differences in sector allocations at a country level relative to the MSCI EM Index.
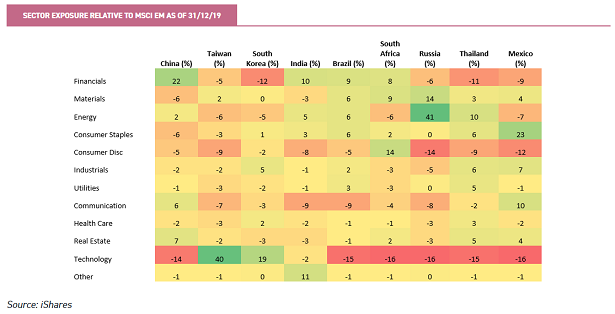
Although industry factors may help drive differences in shorter term performance, internal drivers are likely to be increasingly important as economies develop, real wages rise, and populations age. Different countries and regions will be inevitably and increasingly subject to internal drivers of returns. We examine the major countries and regions below, and the Trusts offering exposure to each.
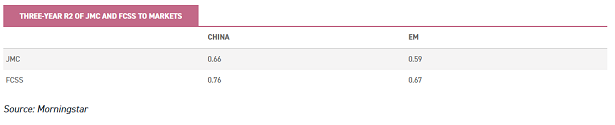
China & Hong Kong
As noted above, Chinese markets are the only major emerging market to show an increased R2 to the EM benchmark, likely thanks to the increasingly large proportion of the benchmark index that the Chinese market represents.
Compared to other emerging market indices at an individual level, it is striking how the trend for China’s R2 relative to major markets such as India, Russia and Brazil has been decidedly lower over the years. All these countries have of course faced particular issues over the past three years, but, as we will see, are likely to have different drivers of returns going forward.
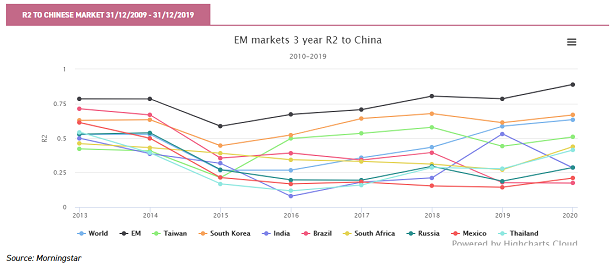
What perhaps strikes us as more interesting in the above graph is the rise in Chinese R2 to the Korean, Taiwanese and World markets. The Korean and Taiwanese economies are both very export orientated, and their stock market fortunes are often perceived as being tied to global trade volumes.
The Chinese authorities operate capital controls to control flows, reducing the ability of domestic savers to allocate savings overseas. Thus, Chinese savers have a very strong domestic bias in their allocations.
In recent years, this has facilitated rallies in asset markets as and when the authorities make credit more readily available, but it has been noted that these often tend to vary between different assets (property, bonds and equities) at different times.
Accordingly, Chinese markets have frequently been driven by changes in domestic monetary conditions, and microeconomic policy decisions affecting the relative desirability of shares compared to property.
Irrespective of this, the increased allocation share of Chinese markets in wider EM allocations means they are mechanically less likely to offer intra-asset class diversification to a broader EM strategy going forward. Trusts such as JPMorgan Chinese (LSE:JMC) and Fidelity China Special (LSE:FCSS) would thus seem likely to be positively aligned with the success of wider EM indices.
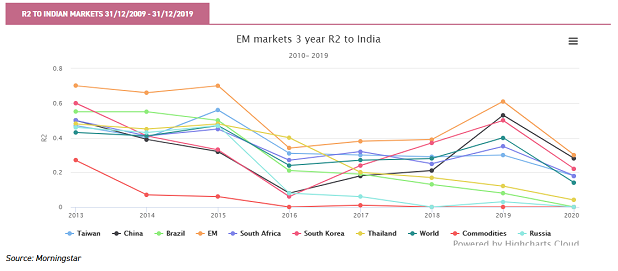
India
The growth story around the Indian economy is well known, driven by economically friendly demographics and increasing attempts to further liberalise the economy and make the federal structure more economically efficient.
India operates capital controls, limiting liquidity to overseas investors. With substantial domestic savings, and a demographic profile likely to increase this element, domestic drivers are often the key to returns.
As a result, correlations to other EM markets are, unsurprisingly, consistently low. Indeed, investors’ primary concern in recent years has been the varying expectations of the Modi government’s success (and to what degree) in reducing the role of the state in the economy and pursuing more free-market economic policies. Similarly, domestic inflation expectations often impact the relative attractiveness of bonds to equities, particularly to domestic investors.
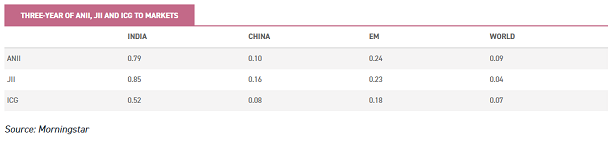
The relatively low R2 of most markets to India can be seen in the graph below.
The ability to benefit from the solid fundamental long-term economic picture informs the investment decisions of many overseas investors who allocate to the Indian market, such as Aberdeen New India (LSE:ANII), Ashoka India Equity Investment (LSE:AIE) (on which we hope to initiate coverage soon – please click here for an alert when we do), JPMorgan Indian Trust (LSE:JII) and India Capital Growth (LSE:IGC).
Overseas investors tend, as a result of capital controls, to be very aware of liquidity issues in their own portfolio which very much plays into the hands of closed-ended funds in accessing the country. In our view, closed-ended structure allows managers to focus on the best growth opportunities, with many fewer liquidity constraints. This is evident in the India country portfolios, with the investment trusts typically overweight the small and mid-cap markets, further reducing correlations to broad EM strategies.
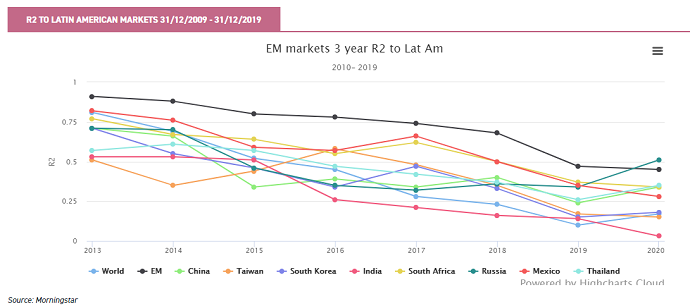
Latin America
Latin American markets are dominated by the Brazilian and Mexican markets, with c. 63% and 20%, respectively, of the benchmark Latin America index invested in these markets.
The drivers of Brazilian markets have become increasingly internal in recent years, though political noise around potential tariffs has seen the Mexican market diverge from this pattern. Of interest is the extremely low R2 to the Indian market, despite the fact that the Indian and Brazilian markets have themselves displayed the lowest correlation to wider EMs over this period; clearly there are idiosyncratic influences on investment decisions driving these markets.
As with India above, investor sentiment in Brazil has mainly centred on perceived political developments. After enduring the worst recorded recession in Brazilian history in the early 2010s, investor confidence has tentatively started to return.
For much of 2019, there was ongoing interest in the potential for reform to the public pension system. With around half of all public expenditure under the previous system forecast to be spent on pensions, reform was critically needed. Ultimately reform has now come, and it is estimated this will save the Brazilian government around $200 billion over the coming years.
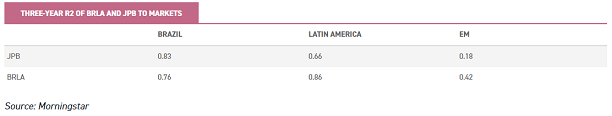
With a relatively closed economy, international sentiment towards the Brazilian market has been less exposed to swings in the relationship between the US and China. At the same time, with regulatory moves in place to allow private pension funds to substantially increase their equity exposure, domestic savers seem likely to be more of a key input to long-term returns going forward. We covered some of these issues in October 2019; meanwhile trusts such as BlackRock Latin American (LSE:BRLA) and JPMorgan Brazil (LSE:JPB) have voiced their optimism over the outlook in this market, yet continue to trade on substantial discounts.
The relationship of these trusts to the Brazilian and Latin American passive products is as one might expect, but the low correlation to wider EM markets is worth noting.
Eastern Europe
With the Eastern European market dominated by the Russian index (c. 67% of the Eastern European index and an R2 consistently above 0.85), it might be expected that the oil price would be a substantial driver of returns, given that energy companies make up nearly 50% of the Russian market. However, this has not been the case in recent years, as we can see below.
The declining correlation of Eastern Europe to wider EM markets comes against a backdrop of ratcheting geopolitical tensions between Russia and the West. Over the past ten years, the Russian economy has experienced significant internal turbulence, including sharp interest rate rises to stem capital outflows following the imposition of sanctions. It is debatable whether, following these events, Russia will start to align more closely again with the global economy and global markets.
However, managers we have spoken to in this region noted that this may not be the key determinant of future market moves in Russia.
Instead, substantial secular changes in corporate culture are under way, such that conditions are becoming much more favourable to minority shareholders, with greatly increased dividend payout ratios among other factors likely to provide attractive return profiles. We discussed this in our recent note on Baring Emerging Europe (LSE:BEE).
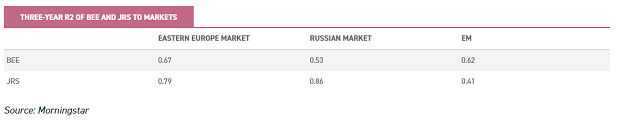
With the Polish market, the second biggest constituent in the benchmark index at c. 22%, displaying a consistently low R2 to the Russian market, eastern European markets themselves appear to have differentiated internal drivers that may actually help to somewhat diversify returns from Russia. However, investors looking for a ‘pure-play’ exposure to Russia also have this option available to them through the JPMorgan Russian Securities (lLSE:JRS) trust.
We can see below the diversifying effect of investing in other eastern European countries, which reduces the correlation to the Russian market. BEE offers a lower R2 to the Russian market, but given the idiosyncratic returns profile of the Russian market in recent years, this actually translates into a greater correlation to wider EM markets.
Conclusion
The data above suggests that within a broader Global EM allocation there is increasing scope for diversification, with regional or single country strategies increasingly driven by individual, country/region-specific characteristics as opposed to large / global drivers. The latter will undoubtedly remain important (all of the above-mentioned trusts, for example, consistently display negative correlation to the US dollar).
With geopolitical tensions between China and the US likely to be a recurring feature as both vie for a dominant position in the Pacific region, Chinese markets (and broad EM indices by extension) may remain volatile and driven by short-term newsflow.
The investment trust universe is well placed to provide investors with the ability to diversify portfolios considerably. Not only does the closed-end structure allow trusts offering exposure to more than one emerging market country achieve significant diversification (through close monitoring of regional and country allocations, and the impact on portfolio level volatility), but the trust universe also offers plenty of choice in terms of single country allocations.
At the same time, investors who wish to make an asset allocation to emerging markets without having to make a specific country decision, retain the option of choosing a strategy which deliberately eschews the main emerging market players to focus on smaller countries with the greatest growth potential.
As many of these markets are relatively illiquid, they are less liable to be driven by international capital flows, with domestic factors arguably even more important (though this pattern will likely be impacted by global events).
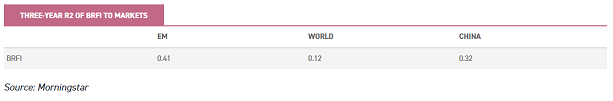
The BlackRock Frontiers (LSE:BRFI) trust for example, specifically looks to invest in markets and economies that display low correlations to global markets, whilst remaining cognisant of top-down factors that can drive market returns, and closely monitoring regional and country allocations. This has helped them maintain a low R2 to wider emerging market, global, and Chinese market moves.
Kepler Partners is a third-party supplier and not part of interactive investor. Neither Kepler Partners or interactive investor will be responsible for any losses that may be incurred as a result of a trading idea.
Full performance can be found on the company or index summary page on the interactive investor website. Simply click on the company's or index name highlighted in the article.
Important Information
Kepler Partners is not authorised to make recommendations to Retail Clients. This report is based on factual information only, and is solely for information purposes only and any views contained in it must not be construed as investment or tax advice or a recommendation to buy, sell or take any action in relation to any investment.
This report has been issued by Kepler Partners LLP solely for information purposes only and the views contained in it must not be construed as investment or tax advice or a recommendation to buy, sell or take any action in relation to any investment. If you are unclear about any of the information on this website or its suitability for you, please contact your financial or tax adviser, or an independent financial or tax adviser before making any investment or financial decisions.
The information provided on this website is not intended for distribution to, or use by, any person or entity in any jurisdiction or country where such distribution or use would be contrary to law or regulation or which would subject Kepler Partners LLP to any registration requirement within such jurisdiction or country. Persons who access this information are required to inform themselves and to comply with any such restrictions. In particular, this website is exclusively for non-US Persons. The information in this website is not for distribution to and does not constitute an offer to sell or the solicitation of any offer to buy any securities in the United States of America to or for the benefit of US Persons.
This is a marketing document, should be considered non-independent research and is subject to the rules in COBS 12.3 relating to such research. It has not been prepared in accordance with legal requirements designed to promote the independence of investment research.
No representation or warranty, express or implied, is given by any person as to the accuracy or completeness of the information and no responsibility or liability is accepted for the accuracy or sufficiency of any of the information, for any errors, omissions or misstatements, negligent or otherwise. Any views and opinions, whilst given in good faith, are subject to change without notice.
This is not an official confirmation of terms and is not to be taken as advice to take any action in relation to any investment mentioned herein. Any prices or quotations contained herein are indicative only.
Kepler Partners LLP (including its partners, employees and representatives) or a connected person may have positions in or options on the securities detailed in this report, and may buy, sell or offer to purchase or sell such securities from time to time, but will at all times be subject to restrictions imposed by the firm's internal rules. A copy of the firm's conflict of interest policy is available on request.
Past performance is not necessarily a guide to the future. The value of investments can fall as well as rise and you may get back less than you invested when you decide to sell your investments. It is strongly recommended that Independent financial advice should be taken before entering into any financial transaction.
PLEASE SEE ALSO OUR TERMS AND CONDITIONS
Kepler Partners LLP is a limited liability partnership registered in England and Wales at 9/10 Savile Row, London W1S 3PF with registered number OC334771.
Kepler Partners LLP is authorised and regulated by the Financial Conduct Authority.
Kepler Partners is a third-party supplier and not part of interactive investor. Neither Kepler Partners or interactive investor will be responsible for any losses that may be incurred as a result of a trading idea.
These articles are provided for information purposes only. Occasionally, an opinion about whether to buy or sell a specific investment may be provided by third parties. The content is not intended to be a personal recommendation to buy or sell any financial instrument or product, or to adopt any investment strategy as it is not provided based on an assessment of your investing knowledge and experience, your financial situation or your investment objectives. The value of your investments, and the income derived from them, may go down as well as up. You may not get back all the money that you invest. The investments referred to in this article may not be suitable for all investors, and if in doubt, an investor should seek advice from a qualified investment adviser.
Full performance can be found on the company or index summary page on the interactive investor website. Simply click on the company's or index name highlighted in the article.
Important Information
Kepler Partners is not authorised to make recommendations to Retail Clients. This report is based on factual information only, and is solely for information purposes only and any views contained in it must not be construed as investment or tax advice or a recommendation to buy, sell or take any action in relation to any investment.
This report has been issued by Kepler Partners LLP solely for information purposes only and the views contained in it must not be construed as investment or tax advice or a recommendation to buy, sell or take any action in relation to any investment. If you are unclear about any of the information on this website or its suitability for you, please contact your financial or tax adviser, or an independent financial or tax adviser before making any investment or financial decisions.
The information provided on this website is not intended for distribution to, or use by, any person or entity in any jurisdiction or country where such distribution or use would be contrary to law or regulation or which would subject Kepler Partners LLP to any registration requirement within such jurisdiction or country. Persons who access this information are required to inform themselves and to comply with any such restrictions. In particular, this website is exclusively for non-US Persons. The information in this website is not for distribution to and does not constitute an offer to sell or the solicitation of any offer to buy any securities in the United States of America to or for the benefit of US Persons.
This is a marketing document, should be considered non-independent research and is subject to the rules in COBS 12.3 relating to such research. It has not been prepared in accordance with legal requirements designed to promote the independence of investment research.
No representation or warranty, express or implied, is given by any person as to the accuracy or completeness of the information and no responsibility or liability is accepted for the accuracy or sufficiency of any of the information, for any errors, omissions or misstatements, negligent or otherwise. Any views and opinions, whilst given in good faith, are subject to change without notice.
This is not an official confirmation of terms and is not to be taken as advice to take any action in relation to any investment mentioned herein. Any prices or quotations contained herein are indicative only.
Kepler Partners LLP (including its partners, employees and representatives) or a connected person may have positions in or options on the securities detailed in this report, and may buy, sell or offer to purchase or sell such securities from time to time, but will at all times be subject to restrictions imposed by the firm's internal rules. A copy of the firm's conflict of interest policy is available on request.
Past performance is not necessarily a guide to the future. The value of investments can fall as well as rise and you may get back less than you invested when you decide to sell your investments. It is strongly recommended that Independent financial advice should be taken before entering into any financial transaction.
PLEASE SEE ALSO OUR TERMS AND CONDITIONS
Kepler Partners LLP is a limited liability partnership registered in England and Wales at 9/10 Savile Row, London W1S 3PF with registered number OC334771.
Kepler Partners LLP is authorised and regulated by the Financial Conduct Authority.
These articles are provided for information purposes only. Occasionally, an opinion about whether to buy or sell a specific investment may be provided by third parties. The content is not intended to be a personal recommendation to buy or sell any financial instrument or product, or to adopt any investment strategy as it is not provided based on an assessment of your investing knowledge and experience, your financial situation or your investment objectives. The value of your investments, and the income derived from them, may go down as well as up. You may not get back all the money that you invest. The investments referred to in this article may not be suitable for all investors, and if in doubt, an investor should seek advice from a qualified investment adviser.
Full performance can be found on the company or index summary page on the interactive investor website. Simply click on the company's or index name highlighted in the article.