The big changes made to this income portfolio
8th November 2018 09:54
by Andrew Pitts from interactive investor
A quarterly review has triggered multiple changes to our sister publication Money Observer's model portfolios. Andrew Pitts and Kyle Caldwell reveal which funds and trusts are in and out in Q3.

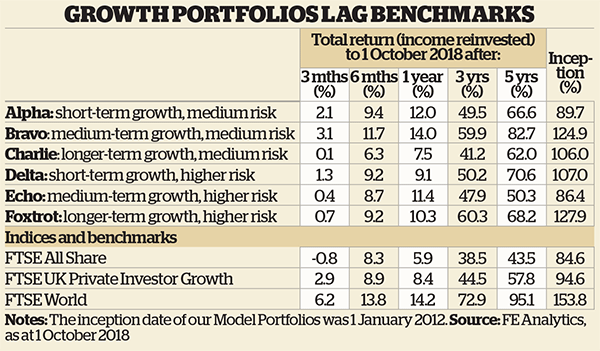
The UK equity market lagged international stockmarkets in the first half of 2018, and it was the same story in the third quarter, with the FTSE All-Share index posting a loss of 0.8%. In contrast, the FTSE World index returned 6.2% in sterling terms.
While the underperformance of UK equities may whet the appetite of more contrarian-minded investors, as far as our model portfolios are concerned, it was a big factor behind eight of the 12 falling short of their relevant FTSE UK Private Investor index benchmark in the three months to 1 October.
On a six-month view, though, the picture is brighter, with 10 of our models beating their benchmarks. More importantly, over longer time horizons our models continue to more than hold their own thanks to astute fund selection, with 11 of the 12 portfolios outperforming on a five-year view.
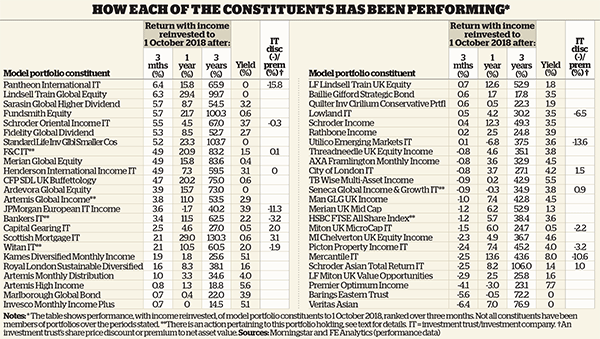
Over the quarter the one growth portfolio that outshone its benchmark was Bravo, our medium-term growth, medium-risk portfolio. Two global funds fuelled Bravo's performance. Fundsmith Equity and Fidelity Global Dividend returned 5.7 and 5.3% respectively over the quarter. Bravo returned 3.1%, ahead of the FTSE UK Private Investor Growth index return of 2.9%.
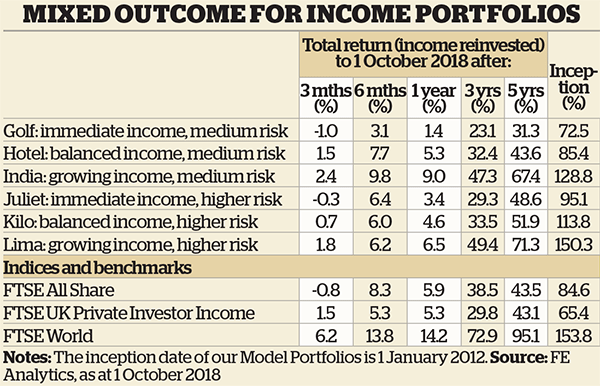
Our income funds generally fared better, with India (up 2.4%) and Lima (up 1.8%) gaining an edge on the FTSE UK Private Investor Income index, which returned 1.5%. Hotel returns were in line with the index.
India, our growing income, medium-risk portfolio, also saw its global fund exposure pay off. Over the quarter Henderson International Income Trust returned 4.9% and Artemis Global Income gained 3.8%. It was a similar story in the case of Lima, our growing income, higher-risk portfolio, which also holds Artemis Global Income.
A bigger helping hand, though, was provided by Schroder Oriental Income, which gained 5.5% over the quarter. That was an impressive feat against a volatile backdrop for Asia and the emerging markets, owing to an escalating trade war and strong dollar. It was therefore not much of a surprise to see the Veritas Asian and Barings Eastern Trust funds in the bottom two positions out of the 48 funds held across our models, with losses of 6.4% and 5.6% respectively.
Overall, it was a challenging quarter, with 17 holdings in the red. At the other end of the table, global funds were big winners, with eight out of the top 10 performers operating with an overseas equity remit. Private equity trust Pantheon International was the best performer in the quarter, having gained 6.4%. It benefited from reporting a 4.4% increase in net asset value per share in August.
Brexit concerns remain at the forefront of investors' minds, leading many investors to shy away from UK equities. As a result, the UK market has fallen behind other global indices as investors have recycled their money into businesses listed overseas. Figures from the Investment Association for the first two quarters of 2018 show that global funds were the most popular category among retail investors.
In the third quarter UK growth and income funds lagged their global counterparts, in line with a wider trend playing out over the past year or so. However, it is worth pointing out that various UK funds have put in a good show over the period, with CFP SDL UK Buffettology and Schroder Income the star performers, returning 20.2 and 12.3% respectively on a one-year view.
Nevertheless, in this review the UK weightings across our models caused performance to cool versus the respective private investor benchmarks, as our models have notable 'overweight' positions to UK equities. With this in mind, and also the prevailing uncertainties over how Brexit will pan out, we have taken some UK equity exposure off the table and recycled the proceeds into global equities.

Sources: Morningstar and FE Analytics Past performance is not a guide to future performance
Growth portfolios: Medium risk
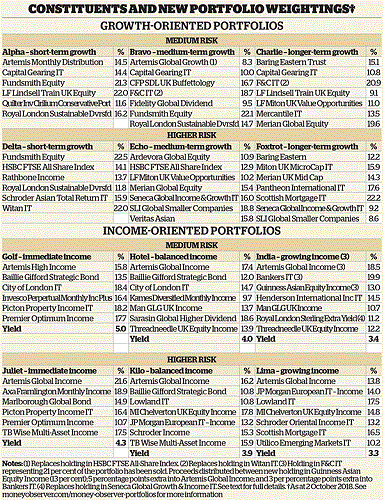
This has led to swapping Witan IT with F & C Trust (formerly Foreign & Colonial) in both Bravo and Charlie. While both operate on a global scale, Witan has a third of its assets in the UK, whereas in contrast, F&C has just 6.6% in the UK. We are fans of its dynamic asset allocation approach, including its exposure to private equity. The net dividend yield is low, at 1.5%, but dividend growth is reliable and progressive, averaging 3.7% a year over the past five years.
In addition, we have decided to remove the HSBC FTSE All-Share Index tracker in Bravo in favour of Artemis Global Growth, which has achieved Money Observer Rated Fund status in every year since 2014. During the annual review, we will consider replacing the trackers in the other two portfolios where passive investments are held (Delta and Echo).
One potential downside to reducing the UK weightings in some portfolios is the prospect of a sterling recovery, which will play out in the event of a Brexit deal being reached with the EU.
However, as things stand, there is a real possibility of a negative outcome and either side walking away from the negotiating table without an agreement. In such a scenario, the pound will weaken further. Such currency moves are notoriously difficult to predict and prepare for. In any case, the FTSE All-Share is heavily influenced by non-sterling earnings (a positive influence on the index when sterling is weak, and vice versa), so the influence of a stronger pound would have been minimal if the tracker fund had been retained.
As a result of the changes, Bravo's UK equity weighting falls from 39% to 25%, while Charlie's new weighting will be 31%, down from 37%. This puts both portfolios' UK exposures closer to the Private Investor Growth index, which has a 21% weighting. But, in the case of Alpha, the shorter-term, medium-risk growth portfolio, we have decided to stick with our choices, and for this model we are comfortable with the 35 % weighting to UK equities.
Eagle-eyed readers will also notice a new name in our Charlie portfolio, but this is only due to a rebranding at Old Mutual Global Investors, part of which is now known as Merian Global Investors. As a result, Old Mutual Global Equity is now called Merian Global Equity. The fund is also held in Echo.

Source: FE Analytics Past performance is not a guide to future performance
Growth portfolios: Higher risk
We have opted to hold fire on making any changes to our higher-risk growth portfolios, but we are keeping a close eye on a couple of funds on performance grounds.
In Echo, our higher-risk medium-term growth portfolio, LF Miton UK Value Opportunities is a concern. On a three-month view, the fund was the fourth-worst performer out of all the funds in our models, having lost 2.9%, while its one-year return was also disappointing, at just 2.5%. The fund is also held in Charlie.
Barings Eastern and Miton UK Microcap Trust are also struggling for form over three and six months. Both are held in Foxtrot. In the case of Baring Eastern, the macroeconomic backdrop has been unkind, but we will nevertheless be looking for performance to improve in all three of the funds mentioned above at the annual review. Elsewhere in Foxtrot, Old Mutual UK Mid Cap is now called Merian UK Mid Cap.
Income portfolios: Medium risk
We are making big changes to India, the medium-risk, growing income portfolio, with two funds entering the portfolio and two making way.
We have removed F&C Trust to boost the portfolio's yield and make room for Asian equity income exposure. It was a difficult decision, but when pitting F&C against Bankers Investment Trust, the latter's higher yield of 2.2%, compared with F&C's 1.5%, was more compelling given the aims of this portfolio.
Both trusts are members of the AIC's global sector, so they are not specifically oriented to growing income. But both trusts have multi-decade records of rising dividend payouts. Bankers targets inflation-beating dividends and its annual average dividend growth over five years of 6.9% is superior to F&C's 3.5%.
We are also dropping Seneca Global Income & Growth . With the proceeds, as well as deciding to add Asian equity exposure, we felt it was prudent to include some defensive assets in the form of a bond fund. We have also added allocations to our other global fund choices.
Entering the portfolio is Guinness Asian Equity Income. Its yield of 3.6% catches the eye and we wanted a slice of the growing dividend culture taking root across Asian markets. The India portfolio now has 18% in Asia excluding Japan equities, up from around 6%, with a fraction of the balance coming from Artemis Global Income, which has a small weighting of 5% in the region.
Our bond pick is Royal London Sterling Extra Yield, a consistently good performer that has a high yield of 5.5%to boot. For India, the bond exposure further diversifies the portfolio and keeps a lid on overall risk following the Asian equity addition. It also boosts the overall yield of India from 3.1% to 3.4%.

Source: FE Analytics Past performance is not a guide to future performance
Income portfolios: higher risk
No changes are being made in this quarter, but we will watch how TB Wise Multi-Asset Income fares over the next three months. This fund, held in both Juliet and Kilo, has returned just 0.2% over the past year.

Source: interactive investor Past performance is not a guide to future performance
What's in store for the annual review
One aim of the model portfolios is to keep trading costs to a minimum, which is the reason we try not to make too many changes to portfolio constituents in the quarterly reviews.
In February's annual review, we will be closely analysing underlying fund performance and considering whether to place greater faith in actively managed funds in the portfolios that currently hold tracker funds. We will also be reviewing the asset allocation in all the portfolios, paying particular attention to the aims of each portfolio.
Higher-risk portfolios, for example, will continue to be heavily weighted to equities. However, as yields are beginning to creep up on fixed-interest securities and the funds that invest in them, we are considering reintroducing more bond fund exposure, particularly to the income portfolios.
When the model portfolios were launched in January 2012, most of the income-oriented portfolios had far higher allocations to bond funds. But quantitative easing and persistently low interest rates led to a general collapse in bond yields as investors flocked into bonds. This boosted capital returns from bonds, but depressed yields for new investors.
With yields from fixed interest securities on the way back up, decent income from bond funds is reappearing.
Full performance can be found on the company or index summary page on the interactive investor website. Simply click on the company's or index name highlighted in the article.
This article was originally published in our sister magazine Money Observer, which ceased publication in August 2020.
These articles are provided for information purposes only. Occasionally, an opinion about whether to buy or sell a specific investment may be provided by third parties. The content is not intended to be a personal recommendation to buy or sell any financial instrument or product, or to adopt any investment strategy as it is not provided based on an assessment of your investing knowledge and experience, your financial situation or your investment objectives. The value of your investments, and the income derived from them, may go down as well as up. You may not get back all the money that you invest. The investments referred to in this article may not be suitable for all investors, and if in doubt, an investor should seek advice from a qualified investment adviser.
Full performance can be found on the company or index summary page on the interactive investor website. Simply click on the company's or index name highlighted in the article.