ii Investment Outlook: Q2 2020
One of the worst quarter’s ever for global financial markets is followed by one of the best.
24th July 2020 10:12
by Lee Wild from interactive investor
One of the worst quarter’s ever for global financial markets is followed by one of the best.

Market round-up
All asset categories recovered strongly during the second quarter of 2020 from steep declines suffered in the first three months of the year. Enormous amounts of stimulus provided by global central banks and reopening economies after lockdown have been the key positive drivers.
However, while there has been an improvement in employment data both in the UK and the US, figures for the UK domestic economy showed activity rebounded by much less than expected in May. The shallow 1.8% improvement in GDP from the previous month was weaker than City expectations of 5%, and means the UK economy is still 24.5% smaller than it was in February.
Expectations are that June’s figures should be far stronger thanks to the easing of lockdown restrictions, with pent-up demand among consumers providing some respite as shops and restaurants re-open.
There’s optimism around a possible vaccine and other drugs to help combat the pandemic, too, yet many investors still worry about the prospect of a ‘second spike’, possibly during the autumn and winter months.
It perhaps explains the current impasse that we see in the domestic stock market where dividends have been a major casualty of lockdown, and the FTSE 100 has moved largely sideways.
Bitcoin has been the best performing asset class over the quarter, three and five-year periods, and performance volatility across different asset classes underscores the need for diversification.
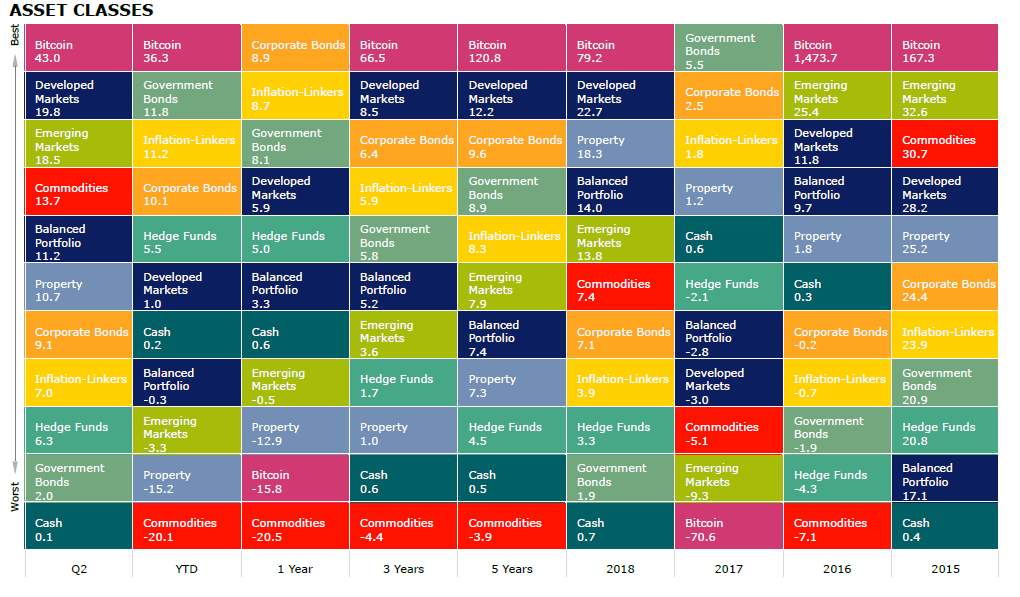
Source: Morningstar Total returns in sterling
Shares
Share prices remain under pressure given the Covid-19 lockdown UK economic uncertainty caused by the coronavirus has been compounded by Brexit negotiations. This has been reflected in the FTSE 100 index, which has been the worst performer of the major developed stock indices during the quarter.
Since breaking back above 6,000 in May, even more bullish investors remain wary about chasing the market too high during a deep recession that could last through 2020.
Dividend payments are likely to be a lot lower or remain cancelled in the short term, so expect volatility levels to remain elevated. Some stocks may offer value if the global lockdown is ended in the short term, however, risk is to the downside if there are any major flare-ups, or if progress toward a vaccine is delayed. The gloomier outlook also means small and mid-cap stocks, which are the most sensitive to economic growth, no longer look so attractive.
US equities rallied during the quarter and outperformed other major developed equity markets. With massive fiscal and monetary stimulus, fundamentals are looking stronger than other regions, even though high valuations remain a concern. Presidential elections in November pose less of a risk now that the centrist Joe Biden has become the Democratic candidate. However, the US still has high coronavirus infection rates, so a second wave is an obvious downside risk to monitor.
European equities also delivered strong returns in Q2 as lockdown restrictions were eased and plans of further stimulus from the European Central Bank. Emerging markets recorded their strongest quarterly return in over a decade, with support of US dollar weakness.
| Performance | |||||
|---|---|---|---|---|---|
| Q2 (%) | YTD | 1 Year | 3 Years | 5 Years | |
| Brazil | 23.3 | -34.4 | -31.4 | -0.9 | 5.3 |
| India | 21 | -11 | -14.6 | 0.1 | 5.9 |
| S&P 500 | 21 | 3.9 | 10.7 | 12.6 | 16.2 |
| World | 19.8 | 1 | 5.9 | 8.5 | 12.2 |
| Russia | 19.1 | -19 | -10.4 | 13.5 | 14 |
| Asia Pacific Ex Japan | 18.8 | 0.7 | 2.7 | 5 | 9.5 |
| Emerging Markets | 18.5 | -3.3 | -0.5 | 3.6 | 7.9 |
| FTSE Small Cap | 18.3 | -14.8 | -7.4 | -0.6 | 4.5 |
| Europe Ex UK | 18.1 | -2.6 | 0 | 3 | 8 |
| China | 15.7 | 11 | 16.5 | 10.4 | 10.5 |
| FTSE 250 | 13.9 | -21.1 | -10 | -1.4 | 2.2 |
| TOPIX Japan | 11.7 | -0.8 | 6.1 | 4.3 | 9.1 |
| FTSE All Share | 10.2 | -17.5 | -13 | -1.6 | 2.9 |
| FTSE 100 | 9.1 | -16.9 | -13.8 | -1.6 | 2.9 |
Source: Morningstar, Total returns in sterling
Sectors
Along with the ongoing infrastructural support for businesses which continue to operate remotely, seen across the majority of industries, technology continued its rapid share price expansion, but fundamentals did not manage to keep the same pace.
One of the reasons for this could be because the current market is momentum driven. As a result, the sector is trading at extremely high multiples, and many investors consider it expensive.
The demand for non-essential goods increased in line with the loosening of lockdown restrictions, and the Consumer Discretionary sector has been a major beneficiary.
As economies awaken and continue their recovery, factories and other “real-economy” entities resume operations and, naturally, the demand for energy and materials increased. On the other hand, defensive areas such as consumer staples that provide household essentials, and utilities, lagged behind, which was expected during a growth period.
| Performance | |||||
|---|---|---|---|---|---|
| Q2 (%) | YTD | 1 Year | 3 Years | 5 Years | |
| Information Technology | 31.6 | 22.1 | 36.7 | 26.4 | 27.1 |
| Consumer Discretionary | 30.3 | 8.7 | 11.8 | 12.3 | 14.2 |
| Materials | 26.3 | -0.6 | 0.4 | 5.5 | 9.9 |
| Communication Services | 19.4 | 5.3 | 10.7 | 7.7 | 9.3 |
| Industrials | 17.8 | -7 | -4.8 | 3.4 | 10.6 |
| Energy | 17 | -31 | -34.4 | -9.7 | -3.7 |
| Health Care | 15 | 8.7 | 17.3 | 11.6 | 12 |
| Financials | 13.3 | -17.5 | -13.5 | -2.1 | 5.9 |
| Real Estate | 12 | -8.2 | -7 | 3.3 | 8.7 |
| Consumer Staples | 9 | 1 | 3.5 | 4.8 | 10.6 |
| Utilities | 6.6 | -1.9 | 2.4 | 7.2 | 12.2 |
Source: Morningstar, Total returns in sterling
Bonds
Corporate bonds outperformed government bonds, as they benefited from stronger risk appetite. High yield performed particularly well, with total returns of 12%, led by the European market. Investment grade bonds returned 9%.
| Performance | |||||
|---|---|---|---|---|---|
| Q2 (%) | YTD | 1 Year | 3 Years | 5 Years | |
| Information Technology | 31.6 | 22.1 | 36.7 | 26.4 | 27.1 |
| Consumer Discretionary | 30.3 | 8.7 | 11.8 | 12.3 | 14.2 |
| Materials | 26.3 | -0.6 | 0.4 | 5.5 | 9.9 |
| Communication Services | 19.4 | 5.3 | 10.7 | 7.7 | 9.3 |
| Industrials | 17.8 | -7 | -4.8 | 3.4 | 10.6 |
| Energy | 17 | -31 | -34.4 | -9.7 | -3.7 |
| Health Care | 15 | 8.7 | 17.3 | 11.6 | 12 |
| Financials | 13.3 | -17.5 | -13.5 | -2.1 | 5.9 |
| Real Estate | 12 | -8.2 | -7 | 3.3 | 8.7 |
| Consumer Staples | 9 | 1 | 3.5 | 4.8 | 10.6 |
| Utilities | 6.6 | -1.9 | 2.4 | 7.2 | 12.2 |
Source: Morningstar, Total returns in sterling
Commodities and Alternative investments
Brent crude futures skyrocketed more than 80%, their best quarterly performance in 30 years. Gold delivered over 10% total return, driving its year to date return to 25%. Gold should continue to benefit from both low interest rates, quantitative easing and the longer-term danger of a major upturn in inflation.
Performance | |||||
|---|---|---|---|---|---|
| Q2 (%) | YTD | 1 Year | 3 Years | 5 Years | |
Brent Crude Oil | 81.6 | -33.2 | -36.3 | -3.4 | -3.8 |
Global Natural Resources | 20.9 | -13.3 | -14.3 | 1.6 | 5.9 |
Global Infrastructure | 14.3 | -13.5 | -12.2 | 0.8 | 7.7 |
Commodity | 13.7 | -20.1 | -20.5 | -4.4 | -3.9 |
Gold | 10.7 | 24.7 | 29.1 | 14.4 | 13.9 |
Hedge Funds | 7.2 | -4.2 | -4.6 | 2.2 | 5.6 |
UK REITs | 4.6 | -24.1 | -9.1 | -2.3 | -1.6 |
Cash | 0.1 | 0.2 | 0.6 | 0.6 | 0.5 |
CBOE Market Volatility (VIX) | -43.0 | 161.6 | 107.8 | 42.0 | 16.3 |
Source: Morningstar, Total returns in sterling
ii Super 60 fund selections
As markets continued their recovery in Q2, all Super 60 active strategies, apart from BMO Commercial Property Trust (LSE:BCPT), delivered a positive return for the period, 87.5% of which were double digits. That also had a positive impact on medium and long-term performance, where 67% of our rated active portfolios ranked 1st and 2nd quartile within their peer group over three years, and 71% over five years, respectively.
In addition, all rated passive funds delivered consistent returns in-line with their benchmark, while keeping tracking error lower than the sector average both over the short and long-term.
Three investment trusts “occupy” the first three places for best performing strategies over the quarter. Scottish Mortgage Investment Trust (LSE:SMT) delivered a staggering total return of 44% compared to 26% for the MSCI ACWI Growth Index for the three months to end of June, mostly contributed by their top holding Tesla (NASDAQ:TSLA) and the large tech exposure through Amazon (NASDAQ:AMZN), Tencent Holdings (SEHK:700) and Alibaba (NYSE:BABA). TR European Growth (LSE:TRG) returned 36% in Q2 against 26% for the MSCI Europe ex UK Small Cap benchmark on the back of strong rally in European mid and small caps.
Recovery in Chinese equities benefited Fidelity China Special (LSE:FCSS), which returned 35%, while Baillie Gifford Shin Nippon (LSE:BGS) tech and healthcare exposure, as well as the ongoing recovery in Japanese small caps, had a positive impact and the trust returned 33% over the quarter compared to 13% MSCI Japan Small Cap Index.
On the other hand, among the least impressive performances over the quarter was BMO Commercial Property, which, regardless of its high quality portfolio, delivered 0% return in Q2 on the back of lockdown restrictions and temporary suspension of dividend payments. Fixed income also continued providing investors with the desired downside protection along with some capital growth. The two passive bond options – Vanguard Global Bond Index and, Vanguard UK Government Bond Index delivered 2% and 3% respectively, while holders of the decent yielding Jupiter Strategic Bond fund enjoyed 5% absolute return.
Over five years, top performer again is growth-focused Scottish Mortgage, with 27% annualised return, followed by the mid and small cap-oriented Legg Mason Japan Equity and Baillie Gifford Shin Nippon with 23% and 20%, respectively.
On the other hand, due to the ongoing negative investor sentiment towards the asset class, worst performing over the same period were the value-focused R&M Recovery, Royal London UK Equity Income, City of London (LSE:CTY) and the specialist BlackRock Frontiers Investment Trust (LSE:BRFI), all of which delivered 2% annualised return.
Top five ii Super 60 funds in Q2
| Performance | |||||
|---|---|---|---|---|---|
| Investment | Q2 (%) | YTD | 1 Year | 3 Years | 5 Years |
| Scottish Mortgage Trust | 44 | 44.13 | 55.22 | 28.62 | 26.8 |
| TR European Growth | 35.89 | -2.52 | 4 | -0.55 | 11.32 |
| Fidelity China Special Situations | 34.58 | 26.58 | 32.37 | 10.77 | 12.71 |
| Baillie Gifford Shin Nippon | 33.17 | 6.74 | 11.76 | 14.01 | 19.94 |
| ASI Global Smaller Companies | 31.97 | 8.39 | 7.03 | 10.57 | 15.19 |
Source: Morningstar Total returns in sterling
Bottom five ii Super 60 funds in Q2
| Performance | |||||
|---|---|---|---|---|---|
| Investment | Q2 (%) | YTD | 1 Year | 3 Years | 5 Years |
| M&G Global Macro Bond | 5.55 | 13.33 | 11.72 | 6.28 | 9 |
| Jupiter Strategic Bond | 4.71 | 2.62 | 4.26 | 3.65 | 4.62 |
| Vanguard UK Government Bond Index | 2.58 | 10.14 | 12.48 | 6.49 | 6.43 |
| Vanguard Global Bond Index | 2.27 | 3.41 | 4.8 | 3.6 | 3.36 |
| BMO Commercial Property Trust | 0 | -3.58 | -5.33 | 0.15 | 3.6 |
Source: Morningstar Total returns in sterling
ii ACE 30 ethical selections
Over Q2 of 2020, all active ACE 30 funds have delivered a positive return, and over the long term, all active funds delivered a positive return over five years and 85% delivered a positive return over three years. Over the quarter, 48% of active funds were in the 1st and 2nd quartile vs their peer groups, and 61% had outperformed their respective benchmarks.
Over the longer term to end Q2 2020, 65% of active funds were in the top 2 quartiles vs their peer groups over three years and 75% of active funds over five years, with 50% outperforming their respective benchmarks over three years and 56% over five years.
The majority of ACE 30 index funds have kept tight tracking errors over the long term, with their tracking errors below their peer group averages over the quarter.
Over Q2 2020, the top performing active ACE 30 funds on an absolute basis were: Brown Advisory US Sustainable Growth, up 28.95% as the US outperformed other major developed equity markets, Pacific Assets (LSE:PAC), up 24.31% which rebounded following its downturn as a result of its underweight to China and overweight to India and BMO Responsible Global Equity, up 22.56% again supported by its large exposure to the US which outperformed other major developed equity markets over the period.
Over the same period, the bottom performing ACE 30 active funds on an absolute basis were: PIMCO Global Bond, up 3.74% although this fund proved relatively resilient over the crisis following the outbreak of the virus, Threadneedle UK Social Bond, up 4.95% plus strong social impact generated due to new issues as a result of the pandemic, and Rathbone Ethical Bond, up 7.14% following a weaker period due to the credit market sell off in March.
Most-traded funds on the ii platform in Q2
Changes to the ii Super 60 list (under review/developments)
There have been a number of changes to the interactive investor Super 60 list of investments recently:
- Artemis Global Income is removed after formal review
- Morgan Stanley UK Global Brands is added as a Global Equity Income option
- Murray International (LSE:MYI) is recategorised as an Adventurous option
- BlackRock Frontiers (LSE:BRFI) placed under formal review following an extended period of unsatisfactory performance
These articles are provided for information purposes only. Occasionally, an opinion about whether to buy or sell a specific investment may be provided by third parties. The content is not intended to be a personal recommendation to buy or sell any financial instrument or product, or to adopt any investment strategy as it is not provided based on an assessment of your investing knowledge and experience, your financial situation or your investment objectives. The value of your investments, and the income derived from them, may go down as well as up. You may not get back all the money that you invest. The investments referred to in this article may not be suitable for all investors, and if in doubt, an investor should seek advice from a qualified investment adviser.
Full performance can be found on the company or index summary page on the interactive investor website. Simply click on the company's or index name highlighted in the article.