The secrets of the silver market explained
In the aftermath of one of the most volatile periods for precious metals prices, analyst John Ficenec explains how it all works, why prices moved so sharply and the view of industry experts.
11th February 2026 12:02
by John Ficenec from interactive investor
Record high prices, a shortage of silver in London, and the largest one-day drop in prices since 1980 have all made for one of the most turbulent silver markets in living memory.
The precious metal that is a store of wealth for some, an essential manufacturing component for others and a speculative punt for a few has been on an unprecedented run, but what’s actually behind the silver market?
- Learn with ii: ISA Investment Ideas | Top ISA Funds | Buy US Shares in UK ISA
Paper promises
What is the price of silver? It seems like a decent place to start, but it’s from this simple premise that the silver market gets interesting. Most people would log on or check their phone and quote back the spot price of silver. The problem with the spot silver price is that it is made up, backed only by paper promises.
It’s so-called because the price is made up “on the spot”, during what is called an over the counter, or OTC, trade. The trader looks at the current price, and then they will quote a bid, which is the price they will buy the client’s silver at, or an offer price at which they will sell to the client, the spread between the two will cover the risk of market movements while the trade is settled. As each trade is input, the mid-point between the bid and the offer is what appears as the spot price, but it’s never one you could receive at that point in time.
But what has just happened? The spot price of silver has moved up or down, and the client now owns a piece of paper, a contract with the bank, or brokerage, to exchange their cash for a claim to some silver. The bank takes the cash and then has the risk of buying the physical silver and storing it in a vault to complete the trade. So, the price of silver can start to move without physical silver coming into it, that comes later.
- City view: Glencore, Fresnillo, Endeavour, Pan African Resources
- Gold and silver prices: what the City thinks will happen next
- Gold, silver and defence: reasons to be bullish and bearish
A similar thing happens for retail investors when you buy a silver exchange-traded fund (ETF); you don’t hold silver, what you hold is a share in a company that aims to hold the physical assets to match, but if things go wrong you won’t get your silver back, you’ll wait in line with the rest of the creditors. A bit like investors who thought they held physical silver through US broker MF Global when it failed in 2011, they had to wait four years through bankruptcy proceedings before they received their cash back.
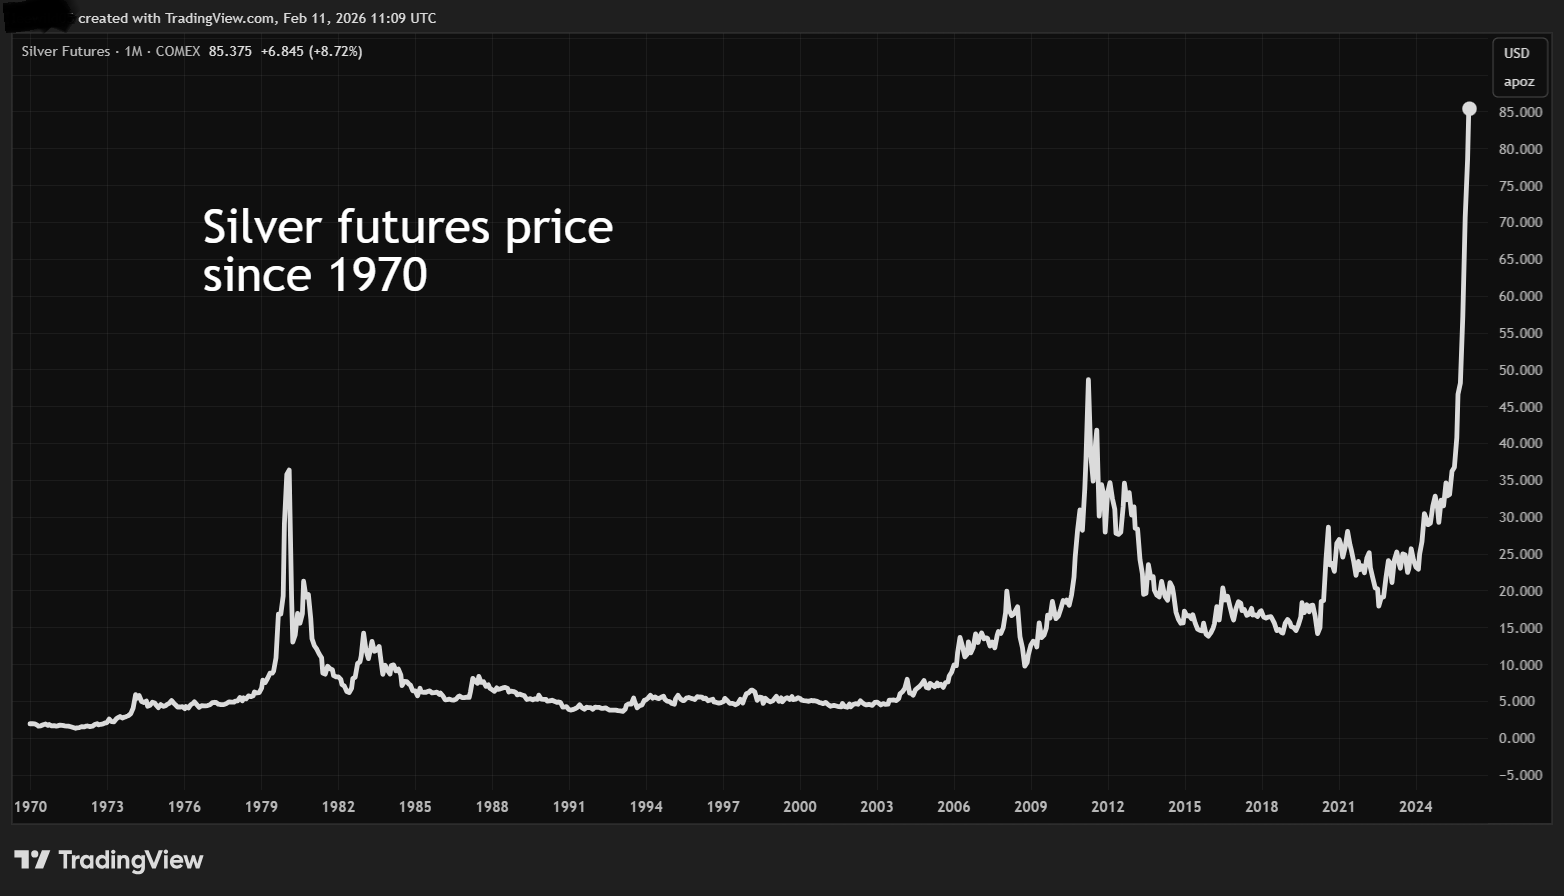
Source: TradingView. Chart does not show most recent peak above $121/ounce. Past performance is not a guide to future performance.
Secret vaults
The silver market is underpinned by millions of ounces held across London in vaults. Each day at 12 o’clock the banks and trading houses accredited by the London Bullion Market Association (LBMA) hold an online auction to fix the silver price. Each accredited participant will look across their entire trading book aggregating all their open buy and sell orders, including individual trades such as above, and decide whether they need to buy or sell silver.
The auction usually kicks off at or near the current spot price and participants submit how much they wish to buy or sell after netting off all their trades. If the buyers and sellers in the auction are matched within the agreed margin, the price is set, if there are too many buyers at the current price then the price increases until equilibrium is reached. Once the auction is complete then silver moves around London from vault to vault as required.
The auction serves several purposes, it provides liquidity to the silver market by linking OTC trades to physical silver, but also sets a reference price that is used by derivatives markets, such as the Chicago Mercantile Exchange (CME), to price options and futures.
The price set in London by the LBMA is therefore used as a benchmark around the world, with a discount or premium applied in Dubai, Mumbai, or Shanghai depending on local supply. So, you have a situation where for the same silver you pay a different price depending on where you are. The derivatives such as options and futures also use the LBMA benchmark and allow participants such as miners and electronics manufacturers to reduce risk by guaranteeing a price today for a date in the future.
Let’s get physical
Ultimately, where the metals markets differ from, say ,equities or currencies that are just recorded on an electronic register, is that it all comes back to a claim on a silver bar somewhere in the world.
Demand for holding physical silver has reached extreme levels, and supply isn’t keeping up. Central banks around the world have sought to diversify reserves away from the US dollar by increasing their holdings of gold and silver. Sanctions against Russia and President Donald Trump’s increasingly belligerent foreign policy have also spooked central banks and wealthy individuals who are no longer as comfortable holding reserves overseas in foreign currencies.
“We’re also seeing more first-time physical buyers, reflecting a wider shift toward diversification into tangible assets during uncertain periods,” says Catherin Thom, chief financial officer, BullionbyPost.
- 10 shares to give you a £10,000 annual income in 2026
- Are high fees chipping away at your investment returns?
Retail investors concerned about excessive debt levels and currency devaluation, who have missed the gold price spike, have looked to get exposure to silver, and demand for physical coins and bars has also been strong. Data on the most-bought funds and equities by interactive investor customers shows Fresnillo (LSE:FRES), Global X Silver Miners ETF USD Acc GBP (LSE:SILG), and iShares Physical Silver ETC GBP (LSE:SSLN) have been particularly popular. Industrial demand has also been increasing by around 2% a year for the past decade as silver is essential in solar panels and electronic vehicles.
Demand exceeds supply
Much of the world’s silver supply, some 80%, comes from mining, with the remaining 20% from recycling industrial machinery and jewellery, according to figures from the World Silver Survey. The mining industry produces around 60% of its silver as a by-product of mining for other metals such as lead, zinc and copper, with only 25% coming from dedicated silver mines. The balance of 15% is from gold mining.
Mine investment cycles take many years, and output cannot be rapidly increased. Depressed commodity prices from a decade ago mean output only increased 1% last year, and less silver is being mined now than in 2015. While recycling has picked up some of the slack, running at its highest level for 13 years, it isn’t enough to meet demand, and the market is now in its fifth year of deficit. However, deficits alone can’t explain recent price movement. As a sense check, the deficit was far higher in 2020 than now, and the price only increased 25% that year.
“More broadly, we are in the early stages of a critical mineral/materials contest between the US and China,” said Ned Naylor-Leyland, manager of the Jupiter Gold & Silver I GBP Acc fund.
US shockwaves
The US has sent two shockwaves through the silver market recently, first from the fall in the value of the dollar and second its trade wars. The US government is currently undergoing the so-called Section 232 investigation into critical minerals, which will decide if silver faces restrictions and tariffs. Banks and exchanges in the US were so spooked by the potential for precious metal tariffs that throughout early 2025 they rushed to bring tonnes of gold and silver back into US vaults in advance of any changes.
The silver deficit, strong demand, and market dynamics all reached crisis point in October last year as heavy buying during Diwali celebrations in India meant physical stocks of silver began to run low in London and the market went haywire.
Demand for silver in London became so extreme that banks which needed silver to provide a physical backing for derivative positions, had to pay almost any price. At one stage in October, the one-month lease rate for silver reached 40%, more than 40 times the usual level at below 1%. It had returned to around 6% last week, but it still demonstrates stress in the system. The bid-offer spread on pricing widened to unprecedented levels as the risk and uncertainty hit trading desks. The price difference for the same ounce of silver between London and New York blew out to record levels.
- Is it time to move on from money market funds?
- Sign up to our free newsletter for investment ideas, latest news and award-winning analysis
When markets become volatile and supply strained, the gap between the bid and offer price widens on every deal. So, instead of the price moving steadily say at $1 increments, it begins to jump by $10 increments. As price movements accelerate, anyone taking leveraged bets on the silver price that banks offer through margin, can get into trouble fast.
Typically, going short you would be asked to provide around 10% margin, so going short $100 of silver, the bank would ask you to provide $10 cash while the bank loans you the rest. But if the price falls, the bank will ask for more cash to cover the loss, and if the market becomes more volatile, they may increase the margin from 10% to 20% to reduce their risk. This must be paid within days, so rapidly rising prices can leave those on the wrong side having to find a lot of cash very fast, or they have to start closing positions.
Silver streak
The all-time high for silver came at $121 per ounce on 29 January, and just a day later the party ended when Donald Trump announced Kevin Warsh as new chair of the Federal Reserve. The belief that Warsh won’t cut interest rates as fast or print as much money resulted in a strengthening of the dollar and caused panic among metal speculators.
An extreme situation developed only hours later on 30 January, as the paper price of spot silver collapsed in London and New York from around $111 oz to $79 oz in one day. Meanwhile, dealers in Shanghai held prices level and were charging buyers of physical silver coins a 50% premium to the spot price.
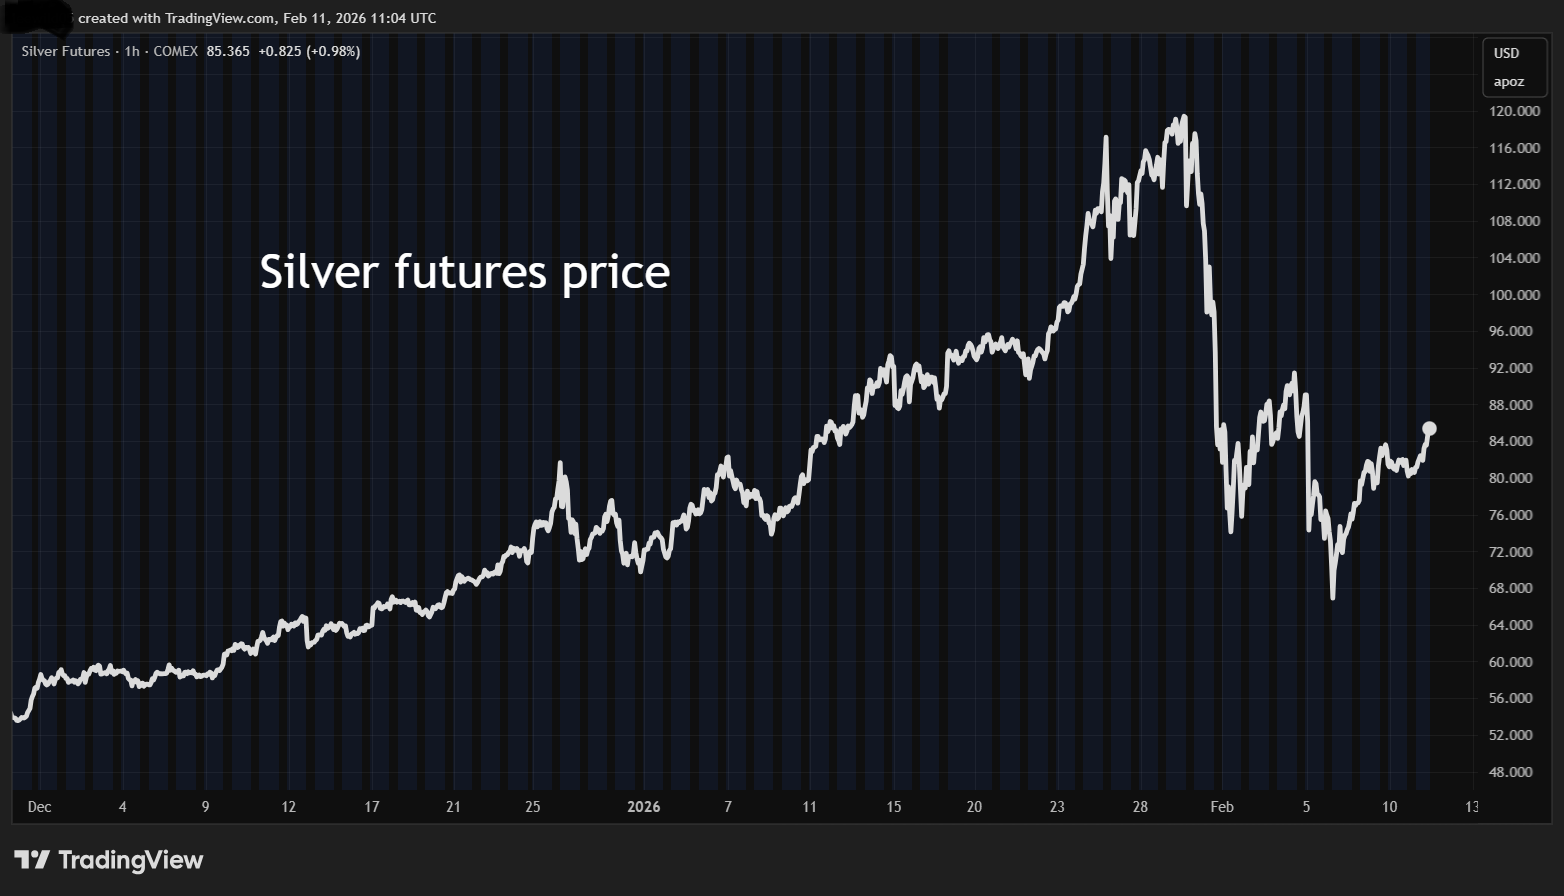
Source: TradingView. Past performance is not a guide to future performance.
“The liquidation primarily affected leveraged positions. Those holding physical bullion or quality mining equities have remained relatively relaxed, supported by miners that continue to generate strong free cash flow even after the pullback in spot prices. In that context, the recent dip looks less like a warning signal and more like a potential entry point for investors who were previously underweight,” added Jupiter’s Naylor-Leyland.
- Stockwatch: have equity bulls become complacent?
- Insider: directors pounce after software stock slump
“Gold and silver have had a strong run, so some retracement is hardly surprising. The sharp pullback appeared to be more about speculation and froth coming out of the market than any single macro trigger, but those same assets have already snapped back from lows,” said Greg Eckel, portfolio manager Canadian General Investments Ord GBP (LSE:CGI).
These views were echoed by retail investors as Adrian Ash, the director of research at BullionVault.com, pointed out an analysis of the selling taking place in the January pullback showed that it was predominantly accounts opened in the past 12 months. This shows that people attracted by the rising prices last year, were the ones banking a quick profit in January, and why not?
Silver bullet?
The incredible volatility in the silver market is a reminder to understand what you are buying and why. If it’s held to protect against currency devaluation and to diversify your portfolio, then wild swings shouldn’t bother you - silver at around $83 oz is still 165% above where it was 12 months ago. However, if you’re speculating, be honest with yourself. The fundamental reasons driving silver higher haven’t changed, but given the strain in the system right now the year ahead might be a roller-coaster ride.
John Ficenec is a freelance contributor and not a direct employee of interactive investor.
These articles are provided for information purposes only. Occasionally, an opinion about whether to buy or sell a specific investment may be provided by third parties. The content is not intended to be a personal recommendation to buy or sell any financial instrument or product, or to adopt any investment strategy as it is not provided based on an assessment of your investing knowledge and experience, your financial situation or your investment objectives. The value of your investments, and the income derived from them, may go down as well as up. You may not get back all the money that you invest. The investments referred to in this article may not be suitable for all investors, and if in doubt, an investor should seek advice from a qualified investment adviser.
Full performance can be found on the company or index summary page on the interactive investor website. Simply click on the company's or index name highlighted in the article.