Seven investment trusts exposed to further upside in Trump's America
2nd November 2018 14:43
This content is provided by Kepler Trust Intelligence, an investment trust focused website for private and professional investors. Kepler Trust Intelligence is a third-party supplier and not part of interactive investor. It is provided for information only and does not constitute a personal recommendation.
Material produced by Kepler Trust Intelligence should be considered a marketing communication, and is not independent research.
Two years after the shock election of Donald Trump, we take a look at what the Trump administration has really meant for US markets and the trusts that invest in them...

The Trump effect
William Sobczak, analyst at Kepler Trust Intelligence
Two years after the shock election of Donald Trump and with the US mid-term elections approaching on 6 November, we thought it a good time to strip out all the noise and bluster and assess what the Trump administration has really meant for US markets and the trusts that invest in them.
We can identify two key policy moves Trump has achieved as President: tax reforms and trade tariffs. Each has significant ramifications for certain sectors and trusts, some good and some bad. The long-term effects are still in the balance, with the mid-terms a crucial fork in the road.
Since Trump was inaugurated as president, the landscape of the US market has arguably transformed, with greater optimism around the near-term prospects for equities and greater pessimism around international relations. We take a look at how trusts have positioned themselves vis-à-vis these trends.
"I promised the American people a big, beautiful tax cut for Christmas. With final passage of this legislation, that is exactly what they are getting."
Arguably the most significant piece of Trumpian legislation for the economy and the stockmarket was his wide-ranging tax reform introduced at the end of December 2017. This included cutting n the corporate tax rate from 35% to 21% and a dramatic change to the current model of taxation, in particular the taxation of US corporations' foreign subsidiaries.
Tax Rates prior to the reforms
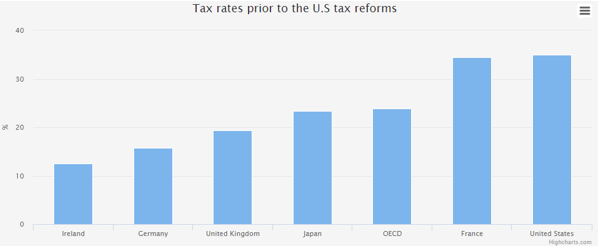
Source: Kepler partners/ Bloomberg
Up until this point, the United States had unemployed a 'worldwide tax regime' where income earned by any US multinationals was taxed as soon as it was repatriated to the US, regardless of where it was earned.
As the US had the highest corporate tax rate prior to December 2017, domestically domiciled companies were incentivised to keep their cash overseas and this led to US companies having as much as $3.1 trillion in overseas accounts (according to Bloomberg as December 2017). In comparison, the majority of other developed nations used a territorial tax regime, where businesses are taxed on the basis of income earned within the country's borders, regardless of where they are headquartered.
With the new tax bill, not only will US companies benefit from lower taxes in the future, but they were also incentivised to bring offshore cash back to the United States through an additional one-time tax cut to 15.5% on cash that was repatriated.
Prior to 2018, US nonfinancial corporations parked about $50 billion of their earnings abroad every three months. In comparison, during the first three months of 2018, that number turned to a negative $158 billion, according to the Federal Reserve, as a wave of cash was repatriated. This was the biggest inflow since 1946.
Foreign Earnings Retained Abroad by Non-Financial Corporations, Delta as a % of GDP
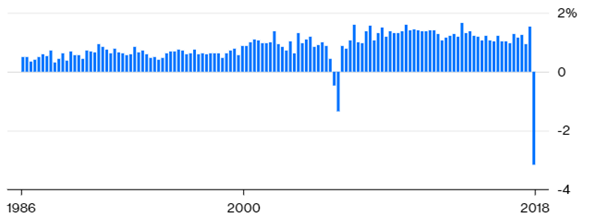
Source: US Federal Reserve
Trump's stated goal was to create a more prosperous US economy, encouraging companies to invest domestically and, as a result, to increase employment opportunities within the US. So, has the policy had any effect on the economy and the market? It is certainly true that capex has soared in 2018, one indication that his policy is working as intended. In the first half of 2018, capital investment rose by 19%.
At the industry level, the biggest beneficiaries of the tax cuts were predicted to be retail, telecommunications, industrials, utilities, retail staples, and healthcare equipment and services, as each had an effective tax rate above 30% before the reforms, according to Credit Suisse.
Sectors which already had tax rates under 20% – such as REITS, pharmaceuticals and biotech – stood to benefit less. (However, as we discuss in our recent note on International Biotechnology Trust (IBT), other implications of the Trump presidency have supported the latter – not least an industry-friendly boss at the FDA in the form of Scott Gottlieb.)
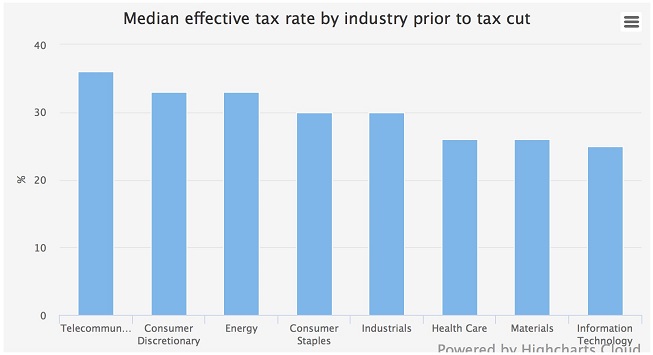
Source Credit Suisse
Median Effective Tax Rate By Industry Prior to Tax Cut
Some of the industries with the greatest previous tax rates have been among the best market performers since the changes came through, such as consumer discretionary and energy. Although there are other factors involved, the boost to future earnings from lower tax rates may well be a factor.
Returns Leading up to the Reforms and Afterward
| PRE | POST | DIFFERENCE | |
|---|---|---|---|
| Consumer Discretionary | 0 | 10.2 | 10.2 |
| Consumer Staples | -5.4 | -11.2 | -5.8 |
| Energy | -0.1 | 15.6 | 15.7 |
| Financials | 3.5 | 5.7 | 2.2 |
| Health Care | 0.5 | 1.4 | 0.9 |
| Industrials | -2.3 | 5.1 | 7.4 |
| Information Technology | 11 | 7.8 | -3.2 |
| Materials | 3.7 | 1.7 | -2 |
| Real Estate | 0.4 | -9.6 | -10 |
| Telecommunication Services | -7.6 | 0.1 | 7.7 |
| Utilities | 0.8 | -13.3 | -14.1 |
Source: Morningstar
However, one major factor behind the stockmarkets' gains since the reforms is not economic. As the critics feared, the repatriation of earnings has led to a significant increase in share buybacks, which mathematically enhance EPS and benefit shareholders, but are of questionable benefit to the rest of the economy.
Goldman Sachs forecasts that buybacks will total more than $1 trillion this year, having surpassed the 2017 full-year figure of $520 billion in the first half alone. We can see below that the EPS for US markets surged in 2018, with buybacks being a key factor.
S&P 500 Earning Growth by Year
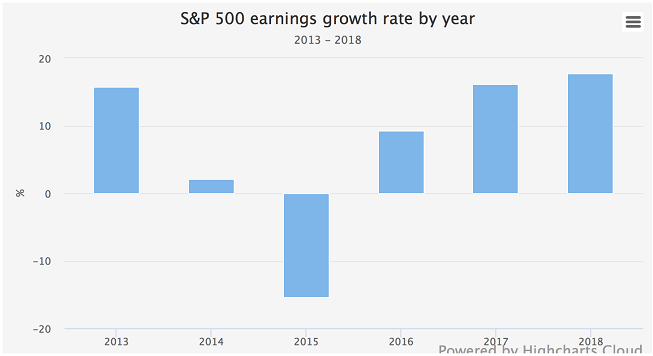
Source: multpl.com
To the extent that buybacks put more money in the pocket of shareholders, the question of whether this will trickle down to the rest of the economy depends on those investors' marginal propensities to save or spend, which time will only tell. However, we can at least see in the increased capital investment cited above one key piece of evidence that the US economy will benefit from these reforms.
The largest turnaround in performance after the reforms came from the energy sector. Clearly a major factor was the oil price. WTI crude has risen to $70 a barrel today from $50 a year ago and $60 at the start of the year, with worsening relations with Iran a headwind that shows no sign of weakening.
However, the sector is also a major beneficiary of the tax reforms, which should provide an impetus behind earnings whatever happens to the oil price. According to MarketWatch, the energy sector's median tax rate for the past 11 years was 36.8%, far above the 30% average tax rate for all S&P 500 companies.
Some companies, including the likes of Marathon Oil Corporation and ConocoPhillips, were previously paying taxes at a rate of close to 50%. Even the lowest-taxed company from the sector was paying more tax than the average S&P 500 company.
BlackRock North American is a trust that could benefit if these factors continue to have an effect: over 10% of the portfolio is invested in the sector, almost double the S&P 500 weighting. The managers believe that oil markets have now passed through the weakness seem in 2015-2017, and declining oil production rates from certain areas have helped create an environment of higher prices and US production growth.
Another area that saw a huge upswing in sentiment this year was the consumer discretionary sector. One element of the tax reform with a positive impact on the consumer discretionary sector was a new 20% tax deduction for small businesses. This allows them to protect one-fifth of their earnings from taxation, effectively lowering the top marginal tax rate on small businesses from 40% to 30%. With this extra income, small businesses can afford to expand and hire, again boosting both employment, the economic outlook and, in turn, the consumer discretionary sector.
However, the sector has also been benefiting from the onward march of the economic cycle in the US. As a cyclical sector, it is benefiting from the strong GDP growth and job growth seen in 2018, which has boosted the discretionary income of the US consumer.
Another factor behind the sector.s success is that it houses a couple of the world's largest companies, which have had strong momentum behind them this year: Amazon and Netflix.
US GDP Growth Rate
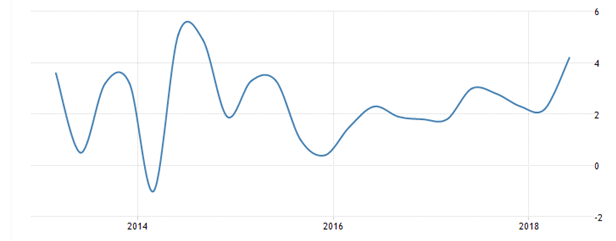
Source: Trading Economics
Baillie Gifford US Growth is a trust that offers investors significant exposure to the consumer discretionary sector (27.8% as of August). The trust's portfolio is made up of companies that they believe have exceptional growth prospects, and the trust holds these companies on a long-term view. The managers see them as the major drivers of market wealth creation, largely due to their outsized role in driving productive innovation in society.
The technology sector has done particularly well from the reforms, even though it previously had one of the lowest tax rates at the sector level. Nevertheless, according to data from Thomson Reuters, the technology sector actually felt the biggest positive financial impact in dollar terms as the tax cuts kicked in in Q1. Partly this is due to the size of the profits in the sector, and partly due to the importance of overseas earnings to these companies.
Apple, for example, saw its effective tax rate fall from 26% to 15%, helped by the fact its huge overseas sales were no longer subject to US tax. Similarly, Intel saw its tax rate halved in Q1 of 2018, to 11%. This was a net increase of around $560 million to their bottom line.
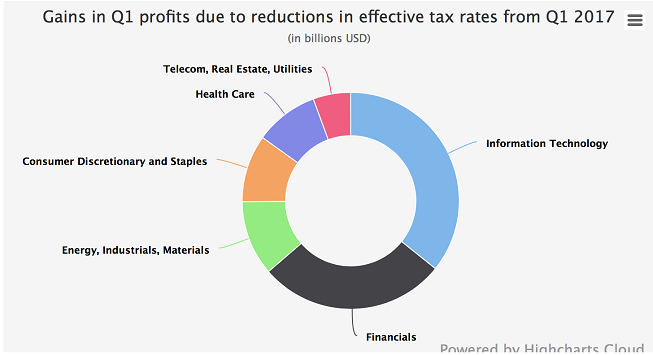
Source: Thomas Reuters
Gains in Q1 Profits due to Effective tax Rate Reductions
Allianz Technology Trust has benefited greatly from the huge profits in the sector and has a long-term track record as a standout performer within the technology sector. Run by Walter Price, the trust has delivered returns of 210% over five years, c.80% greater than the S&P 500. ATT offers exposure to companies involved in 'innovative disruption' and invests in a wide variety of sectors, ranging from automobiles to web services.
Alternatively, JPMorgan American also offers investors significant exposure to the US technology sector (c.30% of the portfolio). The managers utilise a truly bottom up approach, aiming to own any kind of stock as long as it offers what they view as the greatest potential for capital growth. This encompasses growth stocks and value stocks, as well as large, mid and small caps.
It offers a 'core' exposure to North American equities, with the rare distinction of having outperformed the benchmark over five, 10 and 15-year periods, putting the fund in the top quartile of both open - and closed-end funds over these time frames. The trust is significantly more cost-effective than its peers, and the OCF of 0.38% is over half the sector average
The 1st of March saw the second pivotal moment of Trump's presidency so far…
On this date, the first concrete steps towards a possible trade war with China were taken, in the form of a 25% tariff on steel imports and a 10% levy on aluminium. This came despite a split of opinion towards the move within the White House, and even triggered the resignation of Trump's top economic advisor, Gary Cohn.
However, Trump believes Beijing is using "unfair" trade practices to gain an advantage on the US, particularly in its lack of regard for intellectual property law. Additionally, the president is troubled by the size of the US trade deficit with China. Currently, the US Census Bureau shows America bought $376 billion more of Chinese goods than the total value of all US goods sold in China last year.
The most recent development in the confrontation came at the end of last month, when after weeks of threats, Trump followed through with 10% tariffs on $200 billion in imports from China, on top of the $50 billion already subject to 25% taxes. The 10% tariff will increase to 25% at the end of the year. As one would expect, China has retaliated with duties on $60 billion in US goods. However, as the country only imports $130 billion in US goods, its power to hit back with the same force is limited.
This latest move is a clear sign that the tariffs are not simply a short-term annoyance for markets, but will most likely continue to have an impact. This was recognised by Moody's, which recently released research that forecast tariffs would reduce US growth by 0.2% next year, and China's by 0.3-0.5%.
But this isn’t necessarily the consensus, and Strategas Research sees the negatives of the tariffs as being outweighed by the positives of Trump’s tax reforms. When estimating the "worst-case" scenario of the tariffs, it only saw a cost of $120 billion, compared to positive offsets from tax cuts of $200 billion and profit repatriation of $500 billion.
One basic trend we might expect to see if tariffs take effect on the economy and investor sentiment is US domestic earners doing well. This would likely mean small and mid-caps, which tend to earn greater proportions of their earnings at home. We have actually seen a shift from large caps to small caps in the US this year.
Over 2017, large caps offered over double the returns of their small-cap counterparts, however, 2018 has seen this trend reverse and small caps outperform.
It is too early to say this has anything to do with the tariff regimes, and it may just be a reflection of the strong US domestic economy and a weakening of the momentum in the large cap tech names which dominated last year, but this is a trend we would expect to see continue should concerns about a trade war take hold among investors.
Large vs Small-Cap Performance
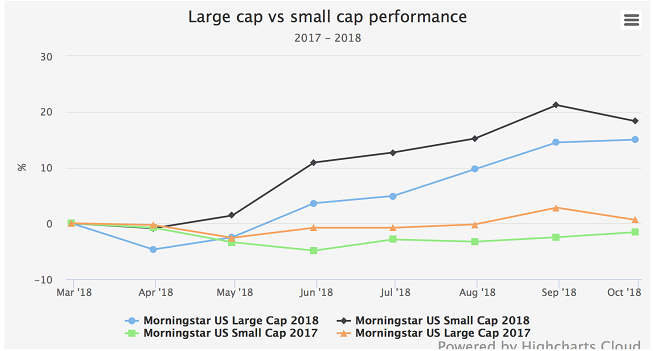
Source: Morningstar
JPMorgan US Smaller Companies is a trust that we have identified as an attractive vehicle for investors looking for small-cap exposure within the US. It sees the Federal Reserve continuing to tighten policy at a moderate pace, which will help to benefit more domestically-focused smaller companies.
The management team continues to see the US smaller company sector as an attractive one and interesting for long-term investors. Generally, they argue it is under-researched and offers areas of undiscovered value. Shareholders should benefit from the Company’s conservative investment approach, which focuses on buying good companies when their shares are out of favour.
Trump's tariffs have negatively impacted the materials and industrials sectors over the course of the year. Obviously the two go hand in hand, with an extremely strong correlation of returns (0.76).
Materials and Industrials vs The S&P 500
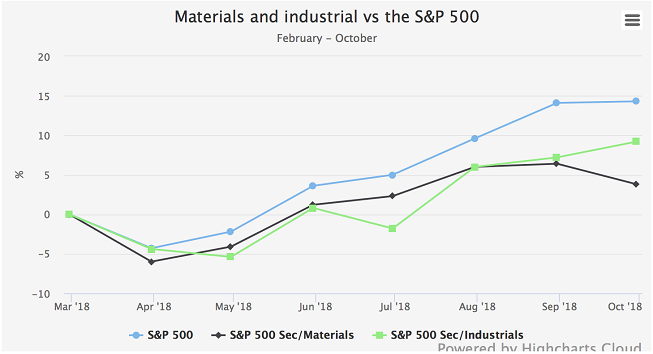
Source: Morningstar
These sectors have been hurt by the material cost increases and possible issues with global supply chains. Many American companies' business models have localised the manufacturing of finished goods - i.e. goods to be sold in China are made there - and this has meant they have felt the full force of the tariffs.
An example would be aircraft manufacturers, which have extensive production facilities in China that, according to IHS Market, produce goods worth over $16 billion. Original equipment manufacturers (OEMs) that rely on imported goods have also been affected, as many of the raw materials used in manufacturing have increased in price.
In particular, those manufacturers that rely on steel will have felt the greatest impact. According to Statista, the US exports more than 10-million tons of steel products but about four times that amount is imported.
Gabelli Value Plus+ has a significant exposure to the industrials and materials sectors, equating to over 40% of the portfolio when combined, which has hurt it this year. The trust has lost 5% year to date and has underperformed the broad US market.
However, the trust has a bottom-up valuations-based approach and in the case of each holding the manager has bought into a situation where he sees a company-specific catalyst for a significant re-rating, regardless of short-term macroeconomic noise.
Where to from here?
On November 6th, a wide range of candidates are up for election, with the whole House of Representatives, a third of the Senate, 36 governorships and a large number of state legislature seats all being voted on.
As can be seen below, it appears more than likely that we will see the Republicans lose control of the House. According to FiveThirtyEight, there is even a 21.1% chance of them losing the senate. However, FiveThirtyEight gave Trump only a 29% chance of winning the presidential election in 2016 on the eve of the vote, so we should perhaps be prepared for all outcomes.
The Likelihood Republicans Remain in Full Control
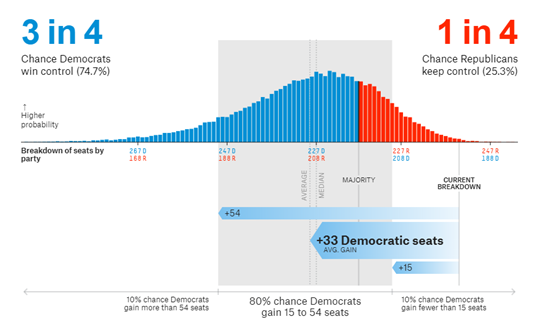
Source: Fivethirtyeight
This is extremely important for US domestic politics, because if the predictions come to fruition, the Democrats can stop the Republicans sending new bills to Trump’s desk with their party's vote alone. However, it is not clear that the major Trump policies described above are under threat.
His trade policies are unlikely to be blocked as the president has the ability to impose and alter tariffs unilaterally (Trump used the Trade Expansion Act of 1962 for his recent impositions). The measures have actually become law despite the fact that there is probably not a majority for them in Congress right now given the extent of Republican opposition to restrictions on free trade. We therefore think that Trump's key policies on trade will remain in force.
Tax reform is one area where the Democrats will have more control should they win control of Congress. However, discussions within the democratic party are focusing on raising the corporate tax cut up to 25%, far short of its previous level, so the negative impact on the US market should be muted. Other tax proposals focus more on wealthy individuals rather than companies, such as capital gains tax.
Essentially, we expect Trump to be free to continue the major thrusts of his trade policy of the past two years. However, it is less likely he will be able to pass stimulative tax cuts, and with the rate cycle slowly ratcheting up the pressure on high multiple companies and markets like the S&P 500, it may be that the next two years see more moderate returns than the last.
Outside of the North American sectors, there are also some trusts that can offer investors significant exposure to the region. Securities Trust of Scotland is a diversified global trust, but has the highest weighting to the US among peers - currently at over 50% of NAV.
The trust looks to invest in the world's best companies, which are able to offer inflation-beating dividend grow. The team, led by Mark Whitehead, have a disciplined investment process, utilising unique income analyses to target companies that offer sustainable cash flows and returns.
Alternatively, Third Point Offshore, a listed hedge fund which describe itself as an "opportunistic multi-asset investor", also has a substantial weighting to the US. The manager, Daniel Loeb, blends bottom-up stock picking with macroeconomic insights, aiming to deliver strong risk-adjusted returns over the longer term.
Performance over 2018 hasn't matched the strong long-term performance of the strategy, which has annualised at almost double that of US equity markets since inception in 1996, with lower volatility and draw-downs. The shares currently trade on a discount of 26.6%. We hope to be updating our research note on the company soon.
Kepler Partners is a third-party supplier and not part of interactive investor. Neither Kepler Partners or interactive investor will be responsible for any losses that may be incurred as a result of a trading idea.
Full performance can be found on the company or index summary page on the interactive investor website. Simply click on the company's or index name highlighted in the article.
Important Information
Kepler Partners is not authorised to make recommendations to Retail Clients. This report is based on factual information only, and is solely for information purposes only and any views contained in it must not be construed as investment or tax advice or a recommendation to buy, sell or take any action in relation to any investment.
This report has been issued by Kepler Partners LLP solely for information purposes only and the views contained in it must not be construed as investment or tax advice or a recommendation to buy, sell or take any action in relation to any investment. If you are unclear about any of the information on this website or its suitability for you, please contact your financial or tax adviser, or an independent financial or tax adviser before making any investment or financial decisions.
The information provided on this website is not intended for distribution to, or use by, any person or entity in any jurisdiction or country where such distribution or use would be contrary to law or regulation or which would subject Kepler Partners LLP to any registration requirement within such jurisdiction or country. Persons who access this information are required to inform themselves and to comply with any such restrictions. In particular, this website is exclusively for non-US Persons. The information in this website is not for distribution to and does not constitute an offer to sell or the solicitation of any offer to buy any securities in the United States of America to or for the benefit of US Persons.
This is a marketing document, should be considered non-independent research and is subject to the rules in COBS 12.3 relating to such research. It has not been prepared in accordance with legal requirements designed to promote the independence of investment research.
No representation or warranty, express or implied, is given by any person as to the accuracy or completeness of the information and no responsibility or liability is accepted for the accuracy or sufficiency of any of the information, for any errors, omissions or misstatements, negligent or otherwise. Any views and opinions, whilst given in good faith, are subject to change without notice.
This is not an official confirmation of terms and is not to be taken as advice to take any action in relation to any investment mentioned herein. Any prices or quotations contained herein are indicative only.
Kepler Partners LLP (including its partners, employees and representatives) or a connected person may have positions in or options on the securities detailed in this report, and may buy, sell or offer to purchase or sell such securities from time to time, but will at all times be subject to restrictions imposed by the firm's internal rules. A copy of the firm's conflict of interest policy is available on request.
Past performance is not necessarily a guide to the future. The value of investments can fall as well as rise and you may get back less than you invested when you decide to sell your investments. It is strongly recommended that Independent financial advice should be taken before entering into any financial transaction.
PLEASE SEE ALSO OUR TERMS AND CONDITIONS
Kepler Partners LLP is a limited liability partnership registered in England and Wales at 9/10 Savile Row, London W1S 3PF with registered number OC334771.
Kepler Partners LLP is authorised and regulated by the Financial Conduct Authority.
Kepler Partners is a third-party supplier and not part of interactive investor. Neither Kepler Partners or interactive investor will be responsible for any losses that may be incurred as a result of a trading idea.
These articles are provided for information purposes only. Occasionally, an opinion about whether to buy or sell a specific investment may be provided by third parties. The content is not intended to be a personal recommendation to buy or sell any financial instrument or product, or to adopt any investment strategy as it is not provided based on an assessment of your investing knowledge and experience, your financial situation or your investment objectives. The value of your investments, and the income derived from them, may go down as well as up. You may not get back all the money that you invest. The investments referred to in this article may not be suitable for all investors, and if in doubt, an investor should seek advice from a qualified investment adviser.
Full performance can be found on the company or index summary page on the interactive investor website. Simply click on the company's or index name highlighted in the article.
Important Information
Kepler Partners is not authorised to make recommendations to Retail Clients. This report is based on factual information only, and is solely for information purposes only and any views contained in it must not be construed as investment or tax advice or a recommendation to buy, sell or take any action in relation to any investment.
This report has been issued by Kepler Partners LLP solely for information purposes only and the views contained in it must not be construed as investment or tax advice or a recommendation to buy, sell or take any action in relation to any investment. If you are unclear about any of the information on this website or its suitability for you, please contact your financial or tax adviser, or an independent financial or tax adviser before making any investment or financial decisions.
The information provided on this website is not intended for distribution to, or use by, any person or entity in any jurisdiction or country where such distribution or use would be contrary to law or regulation or which would subject Kepler Partners LLP to any registration requirement within such jurisdiction or country. Persons who access this information are required to inform themselves and to comply with any such restrictions. In particular, this website is exclusively for non-US Persons. The information in this website is not for distribution to and does not constitute an offer to sell or the solicitation of any offer to buy any securities in the United States of America to or for the benefit of US Persons.
This is a marketing document, should be considered non-independent research and is subject to the rules in COBS 12.3 relating to such research. It has not been prepared in accordance with legal requirements designed to promote the independence of investment research.
No representation or warranty, express or implied, is given by any person as to the accuracy or completeness of the information and no responsibility or liability is accepted for the accuracy or sufficiency of any of the information, for any errors, omissions or misstatements, negligent or otherwise. Any views and opinions, whilst given in good faith, are subject to change without notice.
This is not an official confirmation of terms and is not to be taken as advice to take any action in relation to any investment mentioned herein. Any prices or quotations contained herein are indicative only.
Kepler Partners LLP (including its partners, employees and representatives) or a connected person may have positions in or options on the securities detailed in this report, and may buy, sell or offer to purchase or sell such securities from time to time, but will at all times be subject to restrictions imposed by the firm's internal rules. A copy of the firm's conflict of interest policy is available on request.
Past performance is not necessarily a guide to the future. The value of investments can fall as well as rise and you may get back less than you invested when you decide to sell your investments. It is strongly recommended that Independent financial advice should be taken before entering into any financial transaction.
PLEASE SEE ALSO OUR TERMS AND CONDITIONS
Kepler Partners LLP is a limited liability partnership registered in England and Wales at 9/10 Savile Row, London W1S 3PF with registered number OC334771.
Kepler Partners LLP is authorised and regulated by the Financial Conduct Authority.
These articles are provided for information purposes only. Occasionally, an opinion about whether to buy or sell a specific investment may be provided by third parties. The content is not intended to be a personal recommendation to buy or sell any financial instrument or product, or to adopt any investment strategy as it is not provided based on an assessment of your investing knowledge and experience, your financial situation or your investment objectives. The value of your investments, and the income derived from them, may go down as well as up. You may not get back all the money that you invest. The investments referred to in this article may not be suitable for all investors, and if in doubt, an investor should seek advice from a qualified investment adviser.
Full performance can be found on the company or index summary page on the interactive investor website. Simply click on the company's or index name highlighted in the article.