Trackers vs trusts: what investors need to know
A Kepler analyst takes issue with arguments that passive investing is superior to active and explains why ‘meal replacement drinks’ can’t satisfy investors.
24th April 2026 14:00

Everyone on Reddit knows that Britain has a uniquely terrible economy and a uniquely shameful history, while also being the home of contemporary global high culture (PG Tips, Wotsits, and saying “sorry”). Everyone knows that if the Daily Mail has written about it, you are allowed to pretend it isn’t happening.
Similarly, a brief perusal of the personal finance pages will tell you that everyone knows that passive investing is supported by bulletproof theoretical work, and active investing is “literally”, like, so dumb.
But the academic justification for passive investing is for something very different from what is offered by index funds or ETFs. Moreover, how indices are constructed involves lots of “active” decisions, which we don’t think investors fully appreciate, and means sticking to the mainstream benchmarks departs far from what theory would propose.
Academic background
The Capital Asset Pricing Model (CAPM) is the source of the idea that the expected returns of portfolios vary only according to their systematic risk, i.e. their beta. Without getting too far into the weeds, the basic idea is that investors are not compensated for taking non-systematic risk, which we could call idiosyncratic risk, or stock-specific risk in some scenarios. So, two assets with the same beta, i.e. the same amount of systematic risk, have the same expected return. The expected return on your portfolio is determined by how much you have invested in risky assets and what the beta of those assets is. This isn’t to say that some people won’t beat the market, but that their expected return, or the best estimate of their return, or their average return, will be determined only by their beta and the percentage of their portfolio invested in risky assets.
In even simpler terms, there is no point in making active investment decisions, because the best estimate of your return is still the same as if you were diversified, while you are basically rolling the dice as to whether you get more or less in reality.
So far, so bad for the evil, rent-seeking, capitalist running dogs of the asset management industry. But crucially, the perfectly diversified portfolio imagined under the CAPM, the true market portfolio, includes all assets, both financial and non-financial, weighted by value. This means it includes not only equities and bonds, but private equity and private credit. It includes real estate, both listed and unlisted. It even includes assets in closed economies, like, say, North Korea, and even harder assets to estimate, such as “human capital”. It is a far cry from a simple portfolio made up of the MSCI All Country World Index and the Barclays Global Aggregate bond index.
We don’t want to get into a theoretical debate or argue in favour of CAPM. There are more sophisticated models for explaining returns, which involve adding more factors, but ultimately, these are empirically based. Multi-factor models work on past data, but will they always do so? The long underperformance of small caps suggests that the size factor, one of the best supported by data, might be an artefact of specific historical circumstances. The point we are making is that the idea that passive investing as practised today is justified by academic, theoretical work, is wrong.
A simpler argument claiming the only way to invest is passively is often provided, which ultimately rests on a similar idea. This is that active management must, on average, underperform because, on average, active managers deliver the market return, less costs. But if the true market portfolio includes many other assets not included in listed equity and bond markets, and investment decisions are not made based on relative value within that true market portfolio (which is certainly true), then this argument doesn’t work. It is true that gains from all trades must sum to 0, but that is different from saying the sum of all active decisions sums to zero. Even within the narrow scope of market-cap-listed public indices, some trades that are not passive are also not active, such as the sale of assets liquidated in probate or stock awards to employees. So it is not “mathematically certain” that active investors must, on average, underperform.
Index construction
The idea that passive investing is a cheat code is very alluring — “beat the experts with this one neat trick” — but the arguments that active investing is doomed to failure don’t stack up. What the CAPM concept of the true market portfolio highlights is how much broader the opportunity set for active investors is than just the MSCI ACWI and the Barclays Global Agg. The true passive investor would be looking to invest in these assets too. But how market-cap weighted indices themselves are constructed also departs from what CAPM would suggest. Indices are nowhere near as “passive” as might be assumed.
The market-cap weighted indices, which passive investors track, involve a number of “active” decisions in order to adjust the true market cap for investability. This means stock weights are adjusted for free float, excluding controlling shareholdings, strategic holdings by other companies, or government golden shares. These adjustments are widespread across developed and emerging markets. Companies like Mercedes-Benz Group AG (XETRA:MBG), Uber Technologies Inc (NYSE:UBER), and Standard Chartered (LSE:STAN) are among those household names marked down in the developed world, while impacts are greater in emerging markets, particularly China.
Another important, and conceptually linked, adjustment is for foreign ownership limits. The indices are constructed to be usable by international investors, which means MSCI reduces the weights of companies which limit overseas owners. It does this by monitoring the unused capacity for foreign ownership within the limits and reacting if space is getting squeezed. This has a modest impact on developed world indices, in particular through the airline industry. The US limits foreign ownership of airline shares to 25%, and the EU 50%, for example, and Ryanair and International Consolidated Airlines Group SA (LSE:IAG) have both been impacted by MSCI’s rules in recent years. This sort of adjustment makes a lot of sense: these limits can lead to forced selling or unfair treatment of existing and new investors in funds investing in the market. MSCI’s adjustments arguably make for a better index from the point of view of the trackers, but they mean the indices depart ever further from the theoretical ideal of investing in the true market portfolio. Impacts are even higher in the emerging markets, including the critical major countries of China and India. HDFC Bank Ltd ADR (NYSE:HDB), to take just one example, is adjusted by a foreign inclusion factor of 0.74.
Although MSCI reserves most of the details of the specific factors by stock for subscribers, it has reported that roughly 32% of companies in the MSCI ACWI IMI universe experienced a modification in the foreign inclusion factor (FIF) every year between May 2002 and August 2023. They note that there is a nearly linear relationship between an FIF change and its corresponding price impact, with a larger price impact from FIF increases than FIF decreases. In other words, an increase in foreign ownership limits leads to a price increase, presumably via passive and index-aware active managers increasing their weights. Whatever that is, it isn’t passive. It might explain why they keep the stock-specific data behind a subscription, too.
One of the biggest impacts these adjustments have is on China’s weight in international indices — not just the emerging market index, but the all-country world index. MSCI has been slowly adding China A Shares, i.e. shares listed on its mainland exchanges. They are currently included at just 20% of their free float market capitalisation, meaning that a downwards adjustment has already been made before the 80% cut. If this market-wide adjustment were lifted, China would be 10–15 percentage points more of the emerging markets index. MSCI’s rationale for this adjustment includes the market’s ability to absorb the huge flows that would result if it were weighted at 100%. This means that the index is being constructed in part precisely to facilitate ‘passive’ investing. The market the passive funds track is one that has been created in such a way as to be trackable, which doesn’t meet any reasonable definition of “passive”.
Other countries affected by these adjustments include Saudi Arabia, with its low free float, meaning that it has a low inclusion factor. Notably, holdings by sovereign wealth funds in their own countries are not included in the free float, which affects the free float of Saudi stocks, amongst others. South Korea’s Chaebols, family-controlled operating companies like Samsung Electronics Co Ltd DR (LSE:SMSN), are another set of companies to be severely downgraded versus their market cap. In Samsung’s case, it is included at roughly 60% of its true market cap (even after this adjustment, it makes up c. 33% of the MSCI Korea and 5.1% of the MSCI Emerging Markets).
Areas that are under-covered
All this means that if we were to try to follow the theory behind passive investing, we should really be investing in 1) a much broader set of assets than those in the mainstream equity and bond indices, and 2) investing in equities with very different weights to those the index providers use. Sticking to the conventional indexes isn’t passive in any real sense, but just tracking a series of steps and decisions made by index providers in their attempt to make products that can sell at a massive scale. Huge areas of the true market portfolio are missed out by simply sticking money in an equity and a bond tracker. These areas can offer attractive returns and improved diversification, as well as more opportunities to add alpha.
One of these areas is private equity, by which we mean not just the traditional private equity strategies, but those that involve investing in unlisted equity as a minority investor, such as those seen in the Growth Capital sector, and venture capital, too. As of the end of 2023, Preqin reported that private equity and venture capital assets under management were just over $11 trillion, which is around 11% of the current market capitalisation of the MSCI ACWI IMI Index, a significant asset class to omit from a diversified portfolio.
We think the closed-ended, listed structure remains the most attractive way to access this huge and growing segment. Trusts like CT Private Equity Trust Ord (LSE:CTPE), HarbourVest Global Priv Equity Ord (LSE:HVPE), and NB Private Equity Partners Class A Ord (LSE:NBPE) offer diversified exposure to different traditional private equity approaches. NBPE invests directly into buyout deals alongside leading private equity managers (co-investment). CTPE takes a hybrid approach, with around 50% of investments made through funds, and the balance directly through co-investments; the trust is mainly centred on the UK and Europe, with a focus on smaller companies. HVPE takes a broader approach, offering one of the most diversified portfolios in the sector, with good exposure to buyouts but also venture investments and real assets, including infrastructure. Venture capital is another well-established sector which Molten Ventures Ord (LSE:GROW) provides access to, and would have to be considered in any ‘true market portfolio’. GROW is benefitting from heavy investment in the nascent space industry, which has commercial and military drivers. One of its largest holdings, ICEYE, has recently signed a number of deals with European militaries, which have propelled the valuation upwards.
In fact, most of the space industry remains privately held, including Elon Musk’s SpaceX, which is preparing to make itself the world’s largest ever IPO later this year. No portfolio could be considered truly diversified or truly covering the whole market, passively or otherwise, which didn’t include one of the five largest companies in the world and a whole new industry. SpaceX can be accessed through Scottish Mortgage Ord (LSE:SMT), where it makes up 19% of the portfolio, or via Schiehallion Fund Ord (LSE:MNTN). In MNTN, SpaceX has a lower weight, at 10.5%, but the whole portfolio is devoted to unlisted equity. MNTN takes a very different approach to the traditional private equity strategy, investing as a minority investor in companies before they are listed. With companies increasingly staying off the listed market for longer, there is a larger swathe of economic assets which now sit outside the indices which soi-disant passive investors choose to focus on.
Private credit also has to be considered as part of the true market portfolio. This sector has been growing since the 2007/2008 financial crisis, which led financial regulators to tighten the rules governing bank balance sheets. A long, slow process implemented over stages has had the effect of reducing banks’ willingness and ability to make smaller or riskier loans, with other lenders stepping into the gap. Recently, some US private debt funds have run into trouble, but this does not mean the model is questionable any more than a 20% drawdown in public markets means investors should be in cash. Private credit is here to stay, and the investment trust sector offers a number of ways to participate in another huge and growing area which is not captured by trackable indices. Sequoia Economic Infrastructure Inc Ord (LSE:SEQI) is run by a team of specialists who originated loans within the banks before leaving to run the strategy for the mass market investor. It owns a portfolio of 50 loans made alone or in concert with other institutional lenders, and currently offers a yield of 8.5%, without the use of structural gearing. M&G Credit Income Investment Ord (LSE:MGCI) invests across public and private debt markets, including in a variety of private credit segments. It currently yields 8.3%. An even more specialist offering is that of BioPharma Credit Ord (LSE:BPCR), which makes loans to companies in the biotechnology industry looking to raise money ahead of product launches, development, or M&A. It is highly selective in the loans it makes and has delivered strong returns since launch, with only one default suffered in 17 years.
Turning to the mainstream equity indices, investment trusts also provide a way to access the areas the index providers have underemphasised. JPMorgan China Growth & Income Ord (LSE:JCGI) has a massive overweight position in China A Shares, with 34.6% as of the latest factsheet, compared to 11.8% in the MSCI China benchmark. JPMorgan has invested heavily in its on-shore resources in recent years, with a large team based in the country leaning heavily on local analysts. This could provide it with an advantage if A Shares are steadily upgraded by the index providers over the years, as well as being a source of alpha in the interim. A shares have strongly outperformed over the past year, delivering 23.8% to the end of March compared to just 3.9% for the broader MSCI China Index (all returns in USD).
China allocation
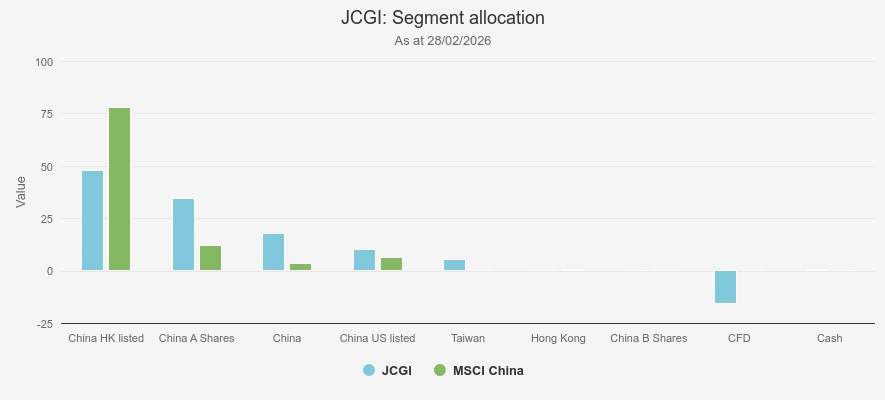
Source: JPM
Saudi Arabia is another big loser from the index providers’ adjustments, and currently accounts for only 3.6% of the MSCI Emerging Markets, making it a rounding error in the MSCI ACWI. It does, however, make up 21% of the portfolio of Barings Emerging EMEA Opportunities Ord (LSE:BEMO). Saudi Arabia was a strong performer until the war in the Gulf saw a sell-off. With a truce in place and negotiations under way, it could be an attractive market to have exposure to for any relief rally.
BlackRock Frontiers Ord (LSE:BRFI) has a broader investment remit than BEMO, which includes the universe of companies omitted from the emerging markets which most investors completely ignore, as well as the smaller emerging markets. This includes Indonesia, a country which is heavily hit by adjustments for free float by MSCI.
Another forgotten region BRFI invests in is Latin America. This is less affected than some others by index providers’ adjustments, but its market capitalisation is way out of line with its importance to world GDP. The whole region makes up less than 1% of the MSCI ACWI, but accounts for around 4.5% of world GDP. BlackRock Latin American Ord (LSE:BRLA) invests exclusively in the region, offering a way to correct this.
Conclusion
It’s comforting to believe a meal replacement drink can give you all the nutrition you need, that a secret cabal has been running world affairs for centuries, and that buying an index fund and forgetting about it is peak investment practice.
Unfortunately, reality is complex and chaotic, and there are no easy answers to important questions. We aren’t trying to suggest that buying trackers is bad, but just pointing out that the arguments that passive investing is inherently superior to active investing and mathematically provable to be superior would actually support investing in a much more diverse set of assets than an equity and bond tracker can provide.
In fact, many of the assets in the true market portfolio are hard to access for mass market investors, with investment trusts the only, or best, way in a lot of cases. If you want to be truly diversified, there is no option but active management, as trackers simply can’t access increasingly important asset classes such as unlisted equity and private credit.
Kepler Partners is a third-party supplier and not part of interactive investor. Neither Kepler Partners or interactive investor will be responsible for any losses that may be incurred as a result of a trading idea.
These articles are provided for information purposes only. Occasionally, an opinion about whether to buy or sell a specific investment may be provided by third parties. The content is not intended to be a personal recommendation to buy or sell any financial instrument or product, or to adopt any investment strategy as it is not provided based on an assessment of your investing knowledge and experience, your financial situation or your investment objectives. The value of your investments, and the income derived from them, may go down as well as up. You may not get back all the money that you invest. The investments referred to in this article may not be suitable for all investors, and if in doubt, an investor should seek advice from a qualified investment adviser.
Full performance can be found on the company or index summary page on the interactive investor website. Simply click on the company's or index name highlighted in the article.
Important Information
Kepler Partners is not authorised to make recommendations to Retail Clients. This report is based on factual information only, and is solely for information purposes only and any views contained in it must not be construed as investment or tax advice or a recommendation to buy, sell or take any action in relation to any investment.
This report has been issued by Kepler Partners LLP solely for information purposes only and the views contained in it must not be construed as investment or tax advice or a recommendation to buy, sell or take any action in relation to any investment. If you are unclear about any of the information on this website or its suitability for you, please contact your financial or tax adviser, or an independent financial or tax adviser before making any investment or financial decisions.
The information provided on this website is not intended for distribution to, or use by, any person or entity in any jurisdiction or country where such distribution or use would be contrary to law or regulation or which would subject Kepler Partners LLP to any registration requirement within such jurisdiction or country. Persons who access this information are required to inform themselves and to comply with any such restrictions. In particular, this website is exclusively for non-US Persons. The information in this website is not for distribution to and does not constitute an offer to sell or the solicitation of any offer to buy any securities in the United States of America to or for the benefit of US Persons.
This is a marketing document, should be considered non-independent research and is subject to the rules in COBS 12.3 relating to such research. It has not been prepared in accordance with legal requirements designed to promote the independence of investment research.
No representation or warranty, express or implied, is given by any person as to the accuracy or completeness of the information and no responsibility or liability is accepted for the accuracy or sufficiency of any of the information, for any errors, omissions or misstatements, negligent or otherwise. Any views and opinions, whilst given in good faith, are subject to change without notice.
This is not an official confirmation of terms and is not to be taken as advice to take any action in relation to any investment mentioned herein. Any prices or quotations contained herein are indicative only.
Kepler Partners LLP (including its partners, employees and representatives) or a connected person may have positions in or options on the securities detailed in this report, and may buy, sell or offer to purchase or sell such securities from time to time, but will at all times be subject to restrictions imposed by the firm's internal rules. A copy of the firm's conflict of interest policy is available on request.
Past performance is not necessarily a guide to the future. The value of investments can fall as well as rise and you may get back less than you invested when you decide to sell your investments. It is strongly recommended that Independent financial advice should be taken before entering into any financial transaction.
PLEASE SEE ALSO OUR TERMS AND CONDITIONS
Kepler Partners LLP is a limited liability partnership registered in England and Wales at 9/10 Savile Row, London W1S 3PF with registered number OC334771.
Kepler Partners LLP is authorised and regulated by the Financial Conduct Authority.