An investment trust sector for ‘building back better’
11th March 2022 14:00
Kepler turns the spotlight on infrastructure and renewable energy.

This content is provided by Kepler Trust Intelligence, an investment trust focused website for private and professional investors. Kepler Trust Intelligence is a third-party supplier and not part of interactive investor. It is provided for information only and does not constitute a personal recommendation.
Material produced by Kepler Trust Intelligence should be considered a marketing communication, and is not independent research.
Private markets could be the next big opportunity for investors. As part of a series of articles focused on different aspects of this diverse opportunity set, we look at the characteristics of private market exposure, examining what it brings to a portfolio. In this second article of the series, we look at infrastructure and renewable energy infrastructure, areas of the investment market that have traditionally appealed to very large institutional funds thanks to their high, cashflow based returns and the long duration of assets. Increasingly, investors of all types are recognising the investment opportunities presented by calls following the pandemic to ‘build back better’ in both traditional infrastructure but also in renewable energy.
London-listed funds exposed to these two broad areas have net assets totalling circa £27 billion, providing plenty of choice for investors wishing to get exposure to this area of the private asset market. As we discuss here, our first article in a series on private markets, listed funds provide an ideal way to access the sort of private market investments that are normally reserved for very large institutional investors who have the firepower, investment timeframe and expertise to access them.
For example, over the past 30 years, Yale’s endowment fund has dramatically increased its exposure to non-traditional asset classes. We share Yale’s view that alternative assets (or illiquid, private investments) offer an opportunity for long term investors of all types, with their potential to improve risk-adjusted portfolio returns. Closer to home, the UK government has been consulting the pension and investment management industry to remove barriers for pension schemes to access illiquid investments. The pensions minister, quoted in the FT, recognises that “green infrastructure, private equity and venture capital, fits well with the long-term horizons of DC [defined contribution] schemes”. “Such investments have the potential to provide better returns for members as part of a balanced portfolio and help to sustain employment, our communities and the environment”.
Investment trust investors are ahead of the game (not for the first time), with a total market capitalisation of investment trust alternative asset sectors of circa £115 billion according to data from Numis (as at 31/12/2021). Indeed, alternative assets are leading the growth of the sector, with AUM in “alternatives” rising by £11.5 billion over 2021 (or 73% of the sector’s issuance during the year) (Source: Numis).
What are ‘private assets’ from an investment perspective?
For long-term investors of all types, private assets surely make sense from a portfolio context. “Diversification is the only free lunch in investing” is widely attributed to the Nobel Prize winner Harry Markowitz, on whose work much investment theory is based. Investments that are listed are arguably just an accident of history, and so investors would be well served in examining the diversifying potential of other unlisted or private assets. These clearly offer a wider opportunity set, and with the complexity and illiquidity involved in buying, managing and selling them, offer the potential for good managers to add significant value in what are (by definition) less efficient markets. On the other hand, the opacity and expertise required in managing these assets mean that the risks from an investment perspective are potentially higher. But also scale is important for in many cases, private assets have a ‘unit size’ of many millions of pounds, euros or dollars.
So how do non-institutional investors get access to these assets? Whilst there has been much talk about Long-Term Asset Funds (LTAF), in our view, nothing can beat an investment trust! Investment trusts provide an excellent structure to hold long term, illiquid assets. Within many areas, investment trusts already offer investors a way of getting access to ready-made portfolios of these private assets, which might otherwise take an institution (such as CalPERS or Yale) months or even years to assemble – not to mention the significant transaction costs of doing so. Aside from being able to ‘try before you buy’ (in analysis terms), investment trusts provide daily liquidity (admittedly of varying degrees) where otherwise there is none, at negligible cost and sometimes a material discount to NAV. Of course, buying at discounts/premiums to NAV add to the risks and opportunities, but for most investors without the multi-decade long investment horizon of Yale or CalPERS, having liquidity is a significant advantage that likely outweighs the disadvantage of a discount potentially widening out significantly. An independent board provides expertise on whether the manager is performing their role correctly, allowing those non-experts in any asset class a degree of reassurance that their best interests will be looked after.
We examine the investment attributes of Private Equity in this article. In this article, we examine what is on offer within the infrastructure and renewable energy sectors.
Infrastructure and Renewable Energy Infrastructure
On a cashflow basis, these two sectors offer similar investment characteristics, albeit with very different considerations and risks. Both sectors’ underlying assets offer annuity-like characteristics with lives of between 25-40 years once they become operational. A proportion of cashflows are directly or indirectly linked to inflation and government-backed sources. Underpinning both sectors is an assumption that the variability of these cashflows will not be highly volatile. Aside from longevity and relatively low variability of cashflows, both also have a broad assumption of a zero-terminal value to assets at the end of the project’s life. As such, funds exposed to these areas need to re-invest surplus cashflows (or raise new equity capital) in order to avoid NAV ‘droop’. Finally, a unifying characteristic across these two sectors is the propensity of these assets to bear a relatively high level of gearing – either at an underlying project level or at a fund level.
The infrastructure sector offers exposure to physical assets that underpin an economy, such as roads, hospitals and schools. It also encompasses electricity transmission, water supplies and, more latterly, the infrastructure that enables the internet to function on a global basis. Infrastructure is typically characterised by a monopoly or quasi-monopoly and, as such, are typically regulated but linked to inflation. This encapsulates the opportunity but also the risk of the asset class as an investment proposition. Whilst long term cashflows are assumed to be relatively secure, changes to the political environment can be a potential risk. Within the infrastructure sector, different assets have different operational risks. The least risky are those termed “availability” based, which depend on their being available to contracted users for contracted cashflows to be paid – such as the UK’s PPP contracts for schools or hospitals. At the other end, cashflows for demand-based assets will vary directly in proportion to how much they are used, such as toll roads or digital infrastructure. Different funds have different proportions of their portfolio exposed to each.
The renewable energy infrastructure sector offers exposure to the physical assets that generate renewable energy or help electricity grids balance the intermittency of these generation sources. These vary by technology (wind, solar, hydro) and by geography (which impacts the subsidy regime, the ability of assets to harness weather to generate electricity, not to mention the nuances of each electricity market and political regime). Within each market, different subsidy regimes exist, which offer very different risks and rewards in terms of subsidy and exposure to electricity prices and inflation. Some assets and some funds have relatively low exposure to short term power prices (US Solar Fund (LSE:USF), for example), while others have unhedged exposure (which in Greencoat UK Wind (LSE:UKW)’s case, means around 50% of annual revenues are impacted by short term wholesale electricity prices), which has been very helpful in recent months (see graph below). Battery storage funds have rather different risks and rewards, offering a low-risk contractual element to their cashflows, with a more variable potential to benefit from electricity price arbitrage. Those that have exposure to short term electricity prices will be benefitting from current market conditions, which we illustrate below.
UK ELECTRICITY PRICES
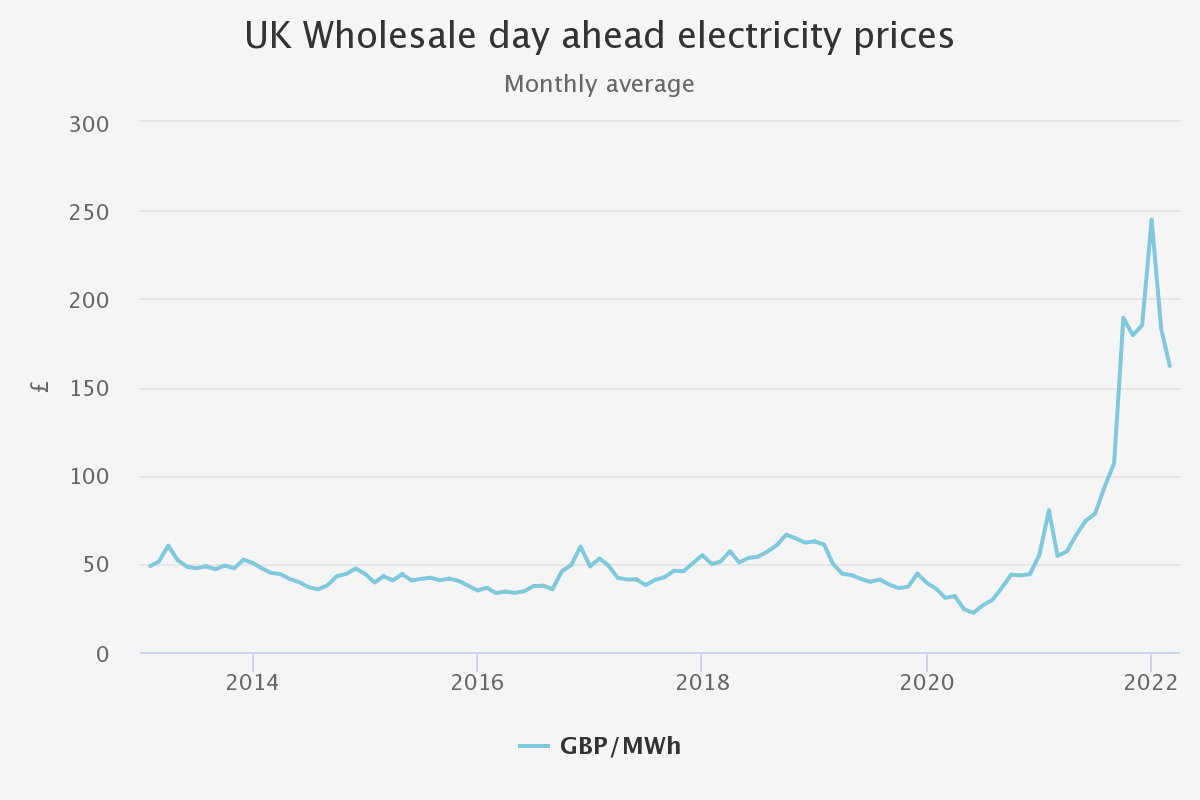
Source: Nord Pool
Underpinning both of these asset classes is a similar methodology in which NAVs are periodically calculated. Assets are valued using discounted cashflow models, into which various long-term assumptions are plugged. In our experience, the most impactful for availability-based infrastructure assets are the discount rate (i.e. valuations for similar assets), inflation and interest rates. For renewable energy, the most impactful assumptions are for the long-term power price, inflation, discount rate (valuations for other assets) and electricity output. Broadly, weather patterns can vary quite considerably over the short term, but we understand that over the long term tend to have relatively low volatility. However, renewable assets’ ability to capture weather and convert this to electricity can vary quite considerably – thanks to physics, but also site specifics and grid conditions.
How well does the listed sub-sector represent the wider market?
In our view, the assets in which the core listed infrastructure funds in the table below are invested represent a similar opportunity set available to other major infrastructure investors. Each portfolio has its nuances, which investors need to appraise themselves properly. HICL Infrastructure (LSE:HICL)was the first trust to list and retains its position as the largest in the sector. As the table below illustrates, it is the most UK-centric of the peer group, with the others generally having a wider spread of assets abroad. BBGI Global Infrastructure (LSE:BBGI) and International Public Partnerships (LSE:INPP), together with HICL, are, in our view, exposed to relatively lower risk ‘core’ infrastructure, whilst 3i Infrastructure (3IN), as well as the newer digital infrastructure trusts, have a slightly higher risk/return portfolio of assets.
INFRASTRUCTURE
| UK | CONTINENTAL EUROPE | NORTH AMERICA | ASIA PACIFIC | |
| BBGI Global Infrastructure | 30 | 11 | 46 | 13 |
| HICL Infrastructure | 74 | 19 | 7 | - |
| International Public Partnerships | 73 | 13 | 5 | 9 |
| 3i Infrastructure | 16 | 82 | - | 2 |
Source: Numis
The renewable energy infrastructure investment opportunity is arguably broader itself than traditional infrastructure, and the sector which now constitutes a relatively large number of trusts, therefore, offers a greater number of nuances. As the sector has evolved, each entrant has sought to exploit different niches and differentiate themselves. We attempt to categorise the sector below, noting that technology and geography are the most basic considerations for investors and that returns are clearly likely to be influenced by a much wider variety of factors such as manager alpha, exposure to wholesale power prices and the performance of each portfolio.
RENEWABLE ENERGY TRUSTS: AREAS OF FOCUS
Source: Kepler Partners, Numis
What returns might investors expect from Infrastructure/Renewable Energy Infrastructure sectors
On a top-down basis, given the variables we describe above, we think it fair to say that traditional infrastructure should be lower risk than renewable energy infrastructure. Both are clearly higher risk than government bonds as an asset class but arguably less risky than equities. Both sectors are cashflow based. At a NAV level, and assuming manager assumptions are correct, the discount rate should give an indicative return for long term shareholder returns. For the infrastructure trusts, the weighted average portfolio discount rates are between 6.5% (BBGI) and 6.8 (HICL & INPP). To infer long term NAV total returns, investors must adjust for the impact of any gearing and deduct fees and other costs, which might reduce shareholder total returns by c. 1%, all things being equal, to give a prospective total return in the order of 5.5-6%.
Actual returns will also reflect how accurate long-term assumptions prove to be. For example, as we highlighted in our recent note on HICL, the managers are yet to adjust their long-term inflation assumptions upwards following the rapid rise in short term inflationary fears. Should inflation be significantly higher than that assumed, returns will be higher and vice versa. HICL believe that total returns will improve by c. 0.8% per year, for every percentage point higher inflation is, over and above their assumptions.
For the renewable energy trusts, the six largest have portfolio discount rates of between 7.3% and 6.0% (with wind having a higher discount rate than solar). Equalising the different underlying assumptions between trusts and accounting for the current share price premiums (assuming a pull to par), JPMorgan Cazenove calculate shareholder total returns over the next 10 years of between 4.4% and 6.3% from the constituents. This assumes capital structures remain the same and no further equity raises or asset purchases. As with the infrastructure trusts, these returns will be positively or negatively impacted by changes in long term assumptions – such as long-term power prices and inflation, not to mention several other factors, which we touch on below. At a NAV level, both sectors should be relatively lowly correlated to equity markets. A fact neatly presented in the below table, which shows the correlation between the infrastructure sector and bonds and equities, which have low, and at times negative correlation, with certain trusts even offering superior diversification than bonds.
CORRELATION WITH EQUITIES & BONDS: THREE YEAR NAV TOTAL RETURN
| 3I INFRA-STRUCTURE | BBGI GLOBAL INFRA-STRUCTURE | HICL INFRA-STRUCTURE PLC | INTER-NATIONAL PUBLIC PARTNER-SHIPS | ISHARES MSCI ACWI ETF | ISHARES S&P 500 INDEX | HSBC FTSE ALL-SHARE INDEX | ISHARES US AGGREGATE BOND INDEX | ISHARES GORE UK GILTS ETF | ||
| 3i Infrastructure | 1 | 0.21 | 0.18 | 0.25 | -0.19 | -0.17 | -0.18 | 0.2 | -0.06 | |
| BBGI Global Infrastructure | 0.21 | 1 | 0.21 | 0.21 | -0.25 | -0.29 | -0.12 | -0.01 | -0.25 | |
| HICL Infrastructure | 0.18 | 0.21 | 1 | 0.31 | 0.42 | 0.34 | 0.5 | -0.07 | -0.17 | |
| International Public Partnerships | 0.25 | 0.21 | 0.31 | 1 | 0.12 | 0.12 | 0.15 | 0.07 | -0.1 | |
| iShares MSCI ACWI ETF (LSE:ISAC) | -0.19 | -0.25 | 0.42 | 0.12 | 1 | 0.98 | 0.87 | -0.1 | 0.07 | |
| iShares S&P 500 Index | -0.17 | -0.29 | 0.34 | 0.12 | 0.98 | 1 | 0.8 | -0.04 | 0.14 | |
| HSBC FTSE All Share Index | -0.18 | -0.12 | 0.5 | 0.15 | 0.87 | 0.8 | 1 | -0.36 | -0.17 | |
| iShares US Aggregate Bond Index | 0.2 | -0.01 | -0.07 | 0.07 | -0.1 | -0.04 | -0.36 | 1 | 0.58 | |
| iShares Core UK Gilts ETF (LSE:IGLT) | -0.06 | -0.25 | -0.17 | -0.1 | 0.07 | 0.14 | -0.17 | 0.58 | 1 |
Source: Morningstar
On a dividend basis, average dividend yields for the infrastructure sector and renewable energy sectors are currently 5% and 5.6%, respectively (according to data from JPMorgan Cazenove). As with any dividend-paying trust, investors should pay close attention to dividend cover, and related to this, financing structures and the variability of revenues that generate the dividend. Within both of these sectors, gearing is employed, and its term and structure influence dividend cover and risks to it being eroded. Infrastructure funds and some of the renewable energy infrastructure trusts use project finance debt. This is fixed-rate debt employed on an asset level basis and is paid down over time, representing a de-risking exercise. Trusts such as Renewables Infrastructure (LSE:TRIG)employ this strategy. Over 2021, TRIG reported an underlying dividend cover of 1.06x. TRIG uses project finance debt to finance its assets within SPVs, which are set up to repay debt over time. Without this, the dividend cover would have been 2.1x.
Other trusts buy assets unencumbered by debt and employ structural gearing at a portfolio/trust level. This debt is usually due to be repaid at a single point in the future, and so whilst dividend cover is higher (none of the revenues is being used to repay debt), it does expose the trust to refinancing risk. For example, UKW recently reported that dividend cover was 1.9x for 2021. This dividend cover gives the board the confidence to continue to explicitly link dividend growth with inflation. In some prior years, thanks to either poor wind resources (2019) or low power prices (2020), dividend cover has been lower than budgeted. However, in each year, the trust has been able to reinvest a proportion of revenues to grow the asset base. Since IPO, the company reports it has reinvested a total of £272m, or 31% of revenues generated.
Whichever approach a trust takes, dividend cover is, in our view, one of the most important metrics for investors to monitor over time. It gives investors confidence that the trust’s dividends are sustainable, an idea of whether dividend increases are likely or feasible, and finally, it gives investors an idea of whether the NAV ‘droop’ we refer to above will kick in sooner rather than later.
Another consideration for investors to consider is the exposure each trust has to macro factors. Within the Infrastructure space, availability-based assets have an extremely low correlation to economic activity, and revenues have a contractual link to inflation. Demand-based assets have an element of variability, which tend to be linked to economic growth. HICL has around 20% exposure to demand-based assets, which were negatively impacted by the lockdowns in the UK, Europe and the US during 2020. This meant HICL paid an uncovered dividend in the financial year to end March 2021, but the recovery in activity since then means that the trust is on track to pay a covered dividend once again.
Inflation linkage is also a feature of renewable energy infrastructure funds. In most cases, a proportion of their revenues have explicit linkage to inflation through subsidy regimes. This provides a direct link for some trusts, although other influences on revenues must also be considered. Power prices, for example, also make up a proportion of revenues. Whilst wholesale electricity prices are at highs currently, it wasn’t long ago that prices were significantly below average, and some commentators were forecasting ‘lower for longer’. The sector’s exposure varies significantly across the peer group, with some having an unhedged exposure to power prices (UKW), whilst others have no exposure (US Solar). Others, such as TRIG, seek to sell forward a proportion of electricity generation and fix at prices for a period into the future. As at 31/12/2021, 66% of TRIG’s forecasted revenues were fixed over the five years to December 2026.
Outlook
Currently, both the Infrastructure and Renewable Energy Infrastructure sectors trade at hefty premiums to NAV. The core infrastructure funds trade on an average premium north of 10%, whilst the weighted average of the renewable energy funds trade is an 8.9% premium. In our view, these premia reflect their fundamental attractions, and premiums have been a fairly consistent feature over the past few years. That said, there is always a risk that shareholder returns will be negatively affected by a shift in sentiment, precipitating discounts.
With extremely low-interest rates globally and interest rate rises potentially in prospect, the threat of investor interest in either the infrastructure or renewable energy infrastructure sectors being eroded by bond yields rising is a consideration. At the same time, the spread between what bonds offer and prospective total returns provides plenty of insulation. Each fund has a different link to inflation, depending on the specifics of the underlying asset mix. However, if interest rates rise as a result of inflationary pressures, the inflation link should go some way towards ensuring the yield spread over bonds remains.
For the renewable energy infrastructure sector, with wholesale electricity prices high and set to remain so for the foreseeable future (even if peace is achieved in Ukraine, it seems unlikely that gas prices will return to normal for some time), the short-term outlook for the sector appears bright.
Kepler Partners is a third-party supplier and not part of interactive investor. Neither Kepler Partners or interactive investor will be responsible for any losses that may be incurred as a result of a trading idea.
These articles are provided for information purposes only. Occasionally, an opinion about whether to buy or sell a specific investment may be provided by third parties. The content is not intended to be a personal recommendation to buy or sell any financial instrument or product, or to adopt any investment strategy as it is not provided based on an assessment of your investing knowledge and experience, your financial situation or your investment objectives. The value of your investments, and the income derived from them, may go down as well as up. You may not get back all the money that you invest. The investments referred to in this article may not be suitable for all investors, and if in doubt, an investor should seek advice from a qualified investment adviser.
Full performance can be found on the company or index summary page on the interactive investor website. Simply click on the company's or index name highlighted in the article.
Important Information
Kepler Partners is not authorised to make recommendations to Retail Clients. This report is based on factual information only, and is solely for information purposes only and any views contained in it must not be construed as investment or tax advice or a recommendation to buy, sell or take any action in relation to any investment.
This report has been issued by Kepler Partners LLP solely for information purposes only and the views contained in it must not be construed as investment or tax advice or a recommendation to buy, sell or take any action in relation to any investment. If you are unclear about any of the information on this website or its suitability for you, please contact your financial or tax adviser, or an independent financial or tax adviser before making any investment or financial decisions.
The information provided on this website is not intended for distribution to, or use by, any person or entity in any jurisdiction or country where such distribution or use would be contrary to law or regulation or which would subject Kepler Partners LLP to any registration requirement within such jurisdiction or country. Persons who access this information are required to inform themselves and to comply with any such restrictions. In particular, this website is exclusively for non-US Persons. The information in this website is not for distribution to and does not constitute an offer to sell or the solicitation of any offer to buy any securities in the United States of America to or for the benefit of US Persons.
This is a marketing document, should be considered non-independent research and is subject to the rules in COBS 12.3 relating to such research. It has not been prepared in accordance with legal requirements designed to promote the independence of investment research.
No representation or warranty, express or implied, is given by any person as to the accuracy or completeness of the information and no responsibility or liability is accepted for the accuracy or sufficiency of any of the information, for any errors, omissions or misstatements, negligent or otherwise. Any views and opinions, whilst given in good faith, are subject to change without notice.
This is not an official confirmation of terms and is not to be taken as advice to take any action in relation to any investment mentioned herein. Any prices or quotations contained herein are indicative only.
Kepler Partners LLP (including its partners, employees and representatives) or a connected person may have positions in or options on the securities detailed in this report, and may buy, sell or offer to purchase or sell such securities from time to time, but will at all times be subject to restrictions imposed by the firm's internal rules. A copy of the firm's conflict of interest policy is available on request.
Past performance is not necessarily a guide to the future. The value of investments can fall as well as rise and you may get back less than you invested when you decide to sell your investments. It is strongly recommended that Independent financial advice should be taken before entering into any financial transaction.
PLEASE SEE ALSO OUR TERMS AND CONDITIONS
Kepler Partners LLP is a limited liability partnership registered in England and Wales at 9/10 Savile Row, London W1S 3PF with registered number OC334771.
Kepler Partners LLP is authorised and regulated by the Financial Conduct Authority.