Nine funds that pass the consistency test
Saltydog Investor’s quarterly look at which funds top the consistency charts reveals an uptick in the number delivering gains of at least 5% in each of the last six six-month periods.
24th February 2026 09:02
by Douglas Chadwick from ii contributor

This content is provided by Saltydog Investor. It is a third-party supplier and not part of interactive investor. It is provided for information only and does not constitute a personal recommendation.
At Saltydog Investor, we focus on providing data-led insights to help DIY investors navigate an ever-changing fund landscape.
Much of our weekly commentary concentrates on shorter-term trends, from one week to six months. However, we also recognise the value of identifying funds that have performed well over a longer time frame. That is why, every three months, we conduct our in-depth 6×6 analysis.
- Invest with ii: Top ISA Funds | FTSE Tracker Funds | Open a Stocks & Shares ISA
For this review, we examine all the funds that we monitor each week. We look for those that have risen by 5% or more in each of the last six consecutive six-month periods. In effect, it is a test of consistency across three years. It’s a demanding hurdle. Often, only a handful of funds make the grade. Sometimes none do.
This time, nine funds have achieved the full six out of six.
Saltydog Investor 6x6 Report: February 2026
| Funds that have risen by 5% or more in 6 out of 6 periods | Feb 23 to July 23 | Aug 23 to Jan 24 | Feb 24 to July 24 | Aug 24 to Jan 25 | Feb 25 to July 25 | Aug 25 to Jan 26 | One-year return | Two- year return | Three-year return |
| Polar Capital Global Technology I Inc GBP | 21.8% | 14.4% | 11.2% | 19.7% | 13.2% | 30.8% | 48% | 97% | 174% |
| Polar Capital PLC-Artificial Intelligence I Acc GBP | 13.0% | 10.4% | 13.2% | 14.2% | 5.7% | 25.0% | 32% | 71% | 113% |
| Ninety One UK Special Situations I Acc | 5.3% | 11.9% | 19.1% | 5.9% | 14.8% | 9.6% | 26% | 59% | 87% |
| Ranmore Global Equity Investor GBP | 5.7% | 6.9% | 9.2% | 10.7% | 14.0% | 9.7% | 25% | 51% | 71% |
| GS Japan Equity Partners R Acc GBP H (Snap) | 24.6% | 7.5% | 12.8% | 7.8% | 5.9% | 10.6% | 17% | 42% | 91% |
| New Capital US Growth GBP Acc | 23.5% | 13.1% | 15.0% | 16.9% | 8.4% | 8.0% | 17% | 57% | 120% |
| Fidelity MSCI World Index GBP P Acc H | 11.0% | 5.6% | 12.8% | 9.0% | 5.3% | 10.8% | 17% | 43% | 68% |
| L&G Global Technology Index I Acc | 30.1% | 13.9% | 16.6% | 16.2% | 6.2% | 9.5% | 16% | 57% | 133% |
| T. Rowe Price Global Tech Equity C Acc | 26.0% | 15.3% | 9.8% | 17.0% | 6.4% | 8.4% | 15% | 48% | 115% |
Data source: Morningstar. Past performance is not a guide to future performance.
This represents a noticeable increase compared with previous updates – one in November, three in August, one in May, and none this time last year. The explanation lies not only with the individual funds, but also with the broader market environment.
Our current rolling analysis covers the six periods from February 2023 to January 2026. The period that has just dropped out of the calculation was August 2022 to January 2023. During that earlier window, only 64% of funds produced positive returns.
By contrast, in the most recent six-month period, from August 2025 to January 2026, 89% of funds rose.
When nearly nine out of 10 funds are advancing, it becomes easier for managers to maintain uninterrupted gains of 5% or more.
The latest list is dominated by technology and growth-oriented strategies.
Polar Capital Global Technology I Inc GBP is the standout performer. Across the six periods it delivered returns of 21.8%, 14.4%, 11.2%, 19.7%, 13.2%, and 30.8%. Its one-year return is 48%, its two-year return 97%, and over three years it has risen by 174%.
Polar Capital PLC-Artificial Intelligence I Acc GBP also features prominently. Its most recent six-month gain was 25.0%, and it has delivered 113% over three years. Continued enthusiasm for artificial intelligence (AI), semiconductors, and digital infrastructure has provided a powerful tailwind.
Other technology-focused funds have also cleared the hurdle. L&G Global Technology Index I Acc and T. Rowe Price Global Tech Equity C Acc each delivered six consecutive six-month gains of at least 5%. The three-year returns for the duo stand at 133% and 115%.
Although not in the Technology & Technology Innovation sector, the New Capital US Growth GBP Acc fund, also in the list, is heavily biased towards the large US technology companies.
However, the list is not solely about high-growth technology exposure.
Ninety One UK Special Situations I Acc has achieved six out of six, with returns ranging from 5.3% to 19.1%. Its three-year return stands at 87%.
Ranmore Global Equity Investor GBP offers a different profile. Its six-period returns range between 5.7% and 14.0%, and its three-year return is 71%. The fund follows a value-oriented, geographically diversified approach and has less exposure to the large US technology companies that dominate global indices.
- Why fund managers are ‘uber-bullish’ despite AI concerns
- Sign up to our free newsletter for investment ideas, latest news and award-winning analysis
GS Japan Equity Partners R Acc GBP H (Snap) and Fidelity MSCI World Index GBP P Acc H complete the list.
The chart of the four leading funds over the past three years highlights an important distinction. The two technology funds have been significantly more volatile. Both experienced a sharp setback in early 2025 but recovered within the six-month window. By contrast, Ninety One UK Special Situations and Ranmore Global Equity Investor have delivered steadier progress.
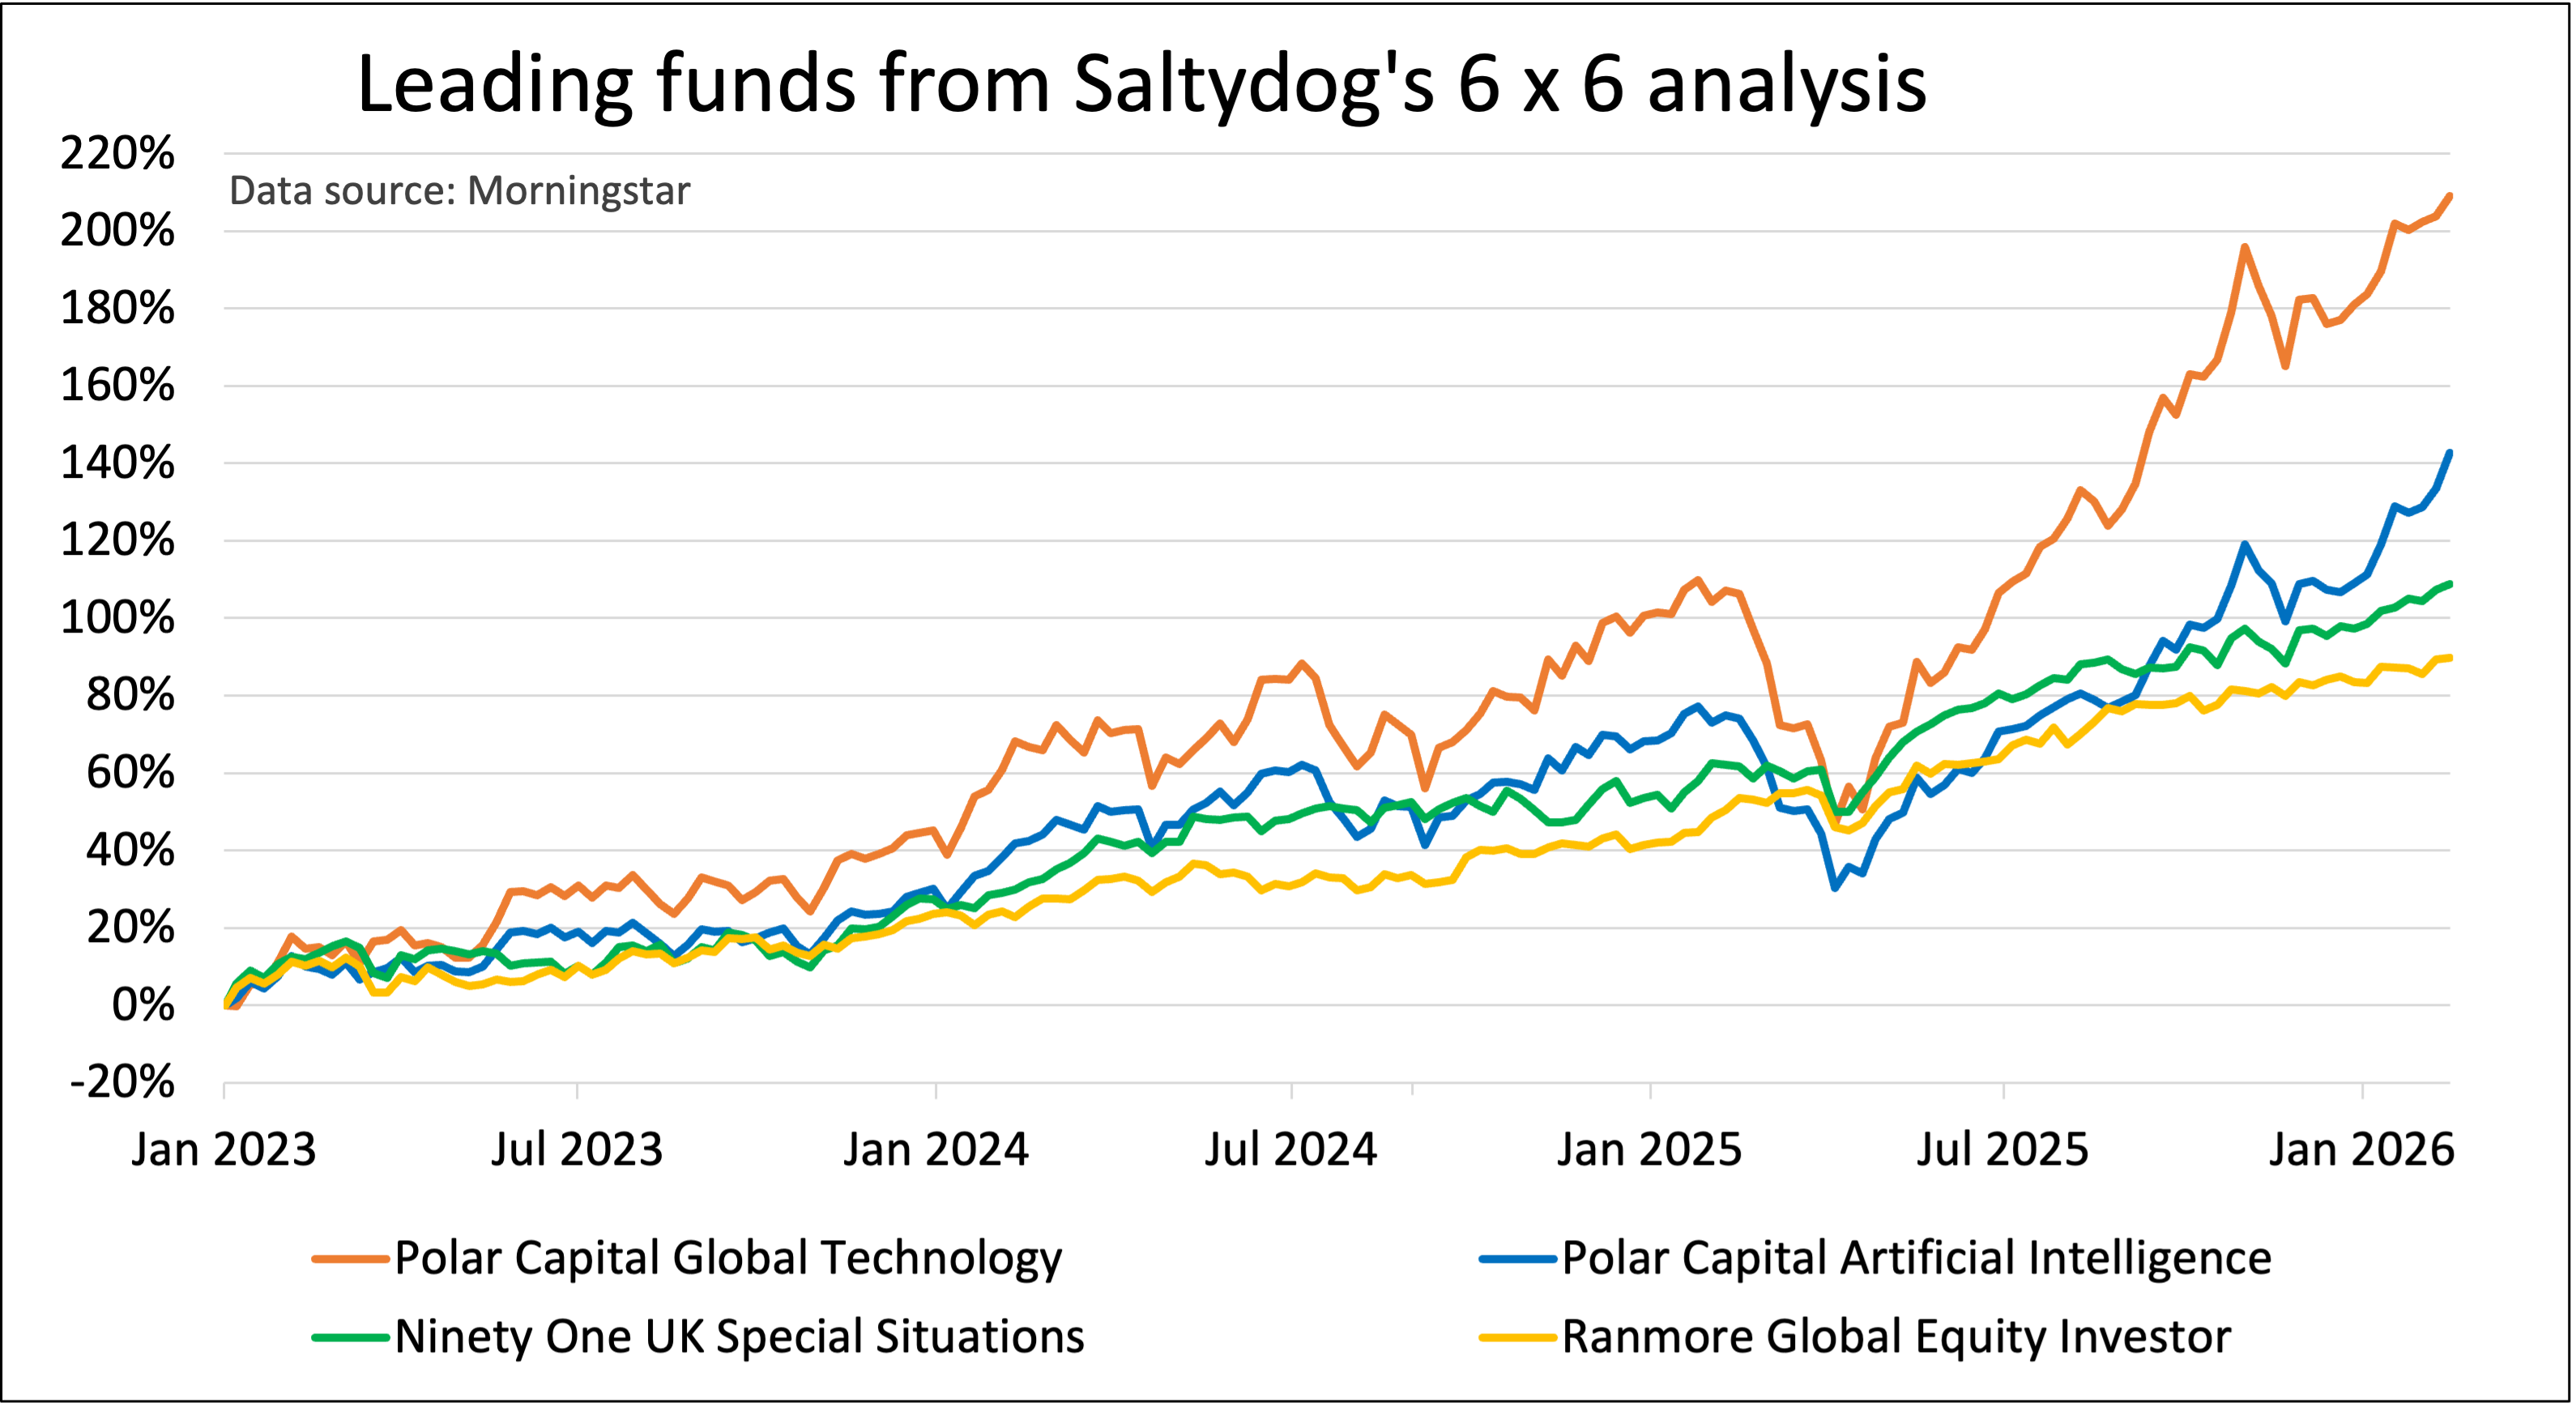
Past performance is not a guide to future performance.
This illustrates that the 6×6 test only measures whether each period ends at least 5% higher, not how smooth the journey has been.
One previous achiever has dropped out of the elite group. Invesco Global Equity Inc UK Z Acc, which previously met the six-out-of-six standard, declined by 1.6% in the latest six-month period.
The key point is that consistency is often closely tied to the prevailing market conditions. When a high proportion of funds are rising, as in the latest six-month period, more managers are able to sustain consecutive gains. When market conditions become less favourable or volatility increases, the number meeting the 6×6 threshold typically falls.
The 6×6 report highlights funds that have demonstrated resilience and sustained progress across multiple rolling periods. For now, that group is larger than usual. Whether it remains so will depend on how supportive the next six months prove to be.
For more information about Saltydog, or to take the two-month free trial, go to www.saltydoginvestor.com
These articles are provided for information purposes only. Occasionally, an opinion about whether to buy or sell a specific investment may be provided by third parties. The content is not intended to be a personal recommendation to buy or sell any financial instrument or product, or to adopt any investment strategy as it is not provided based on an assessment of your investing knowledge and experience, your financial situation or your investment objectives. The value of your investments, and the income derived from them, may go down as well as up. You may not get back all the money that you invest. The investments referred to in this article may not be suitable for all investors, and if in doubt, an investor should seek advice from a qualified investment adviser.
Full performance can be found on the company or index summary page on the interactive investor website. Simply click on the company's or index name highlighted in the article.