Stockwatch: hedges and opportunities amid the crisis
With little sign of an end to conflict in the Middle East, analyst Edmond Jackson reviews the current situation, repercussions for investors and revisits some recent tips.
20th March 2026 12:13
by Edmond Jackson from interactive investor
Is the current macro context deteriorating so much that a critical instrument to hold is the L&G FTSE 100 Super Short Strategy Daily 2x ETF (LSE:SUK2)?
- Invest with ii: Open a Stocks & Shares ISA | Top ISA Funds | ISA Offers & Cashback
This higher risk exchange-traded fund (ETF) has shot to popularity among some retail investors, given that it’s a simple means to hedge their portfolios, or just to take a bet on the market breaking down.
Might its long-term chart now constitute an inflection point upwards?
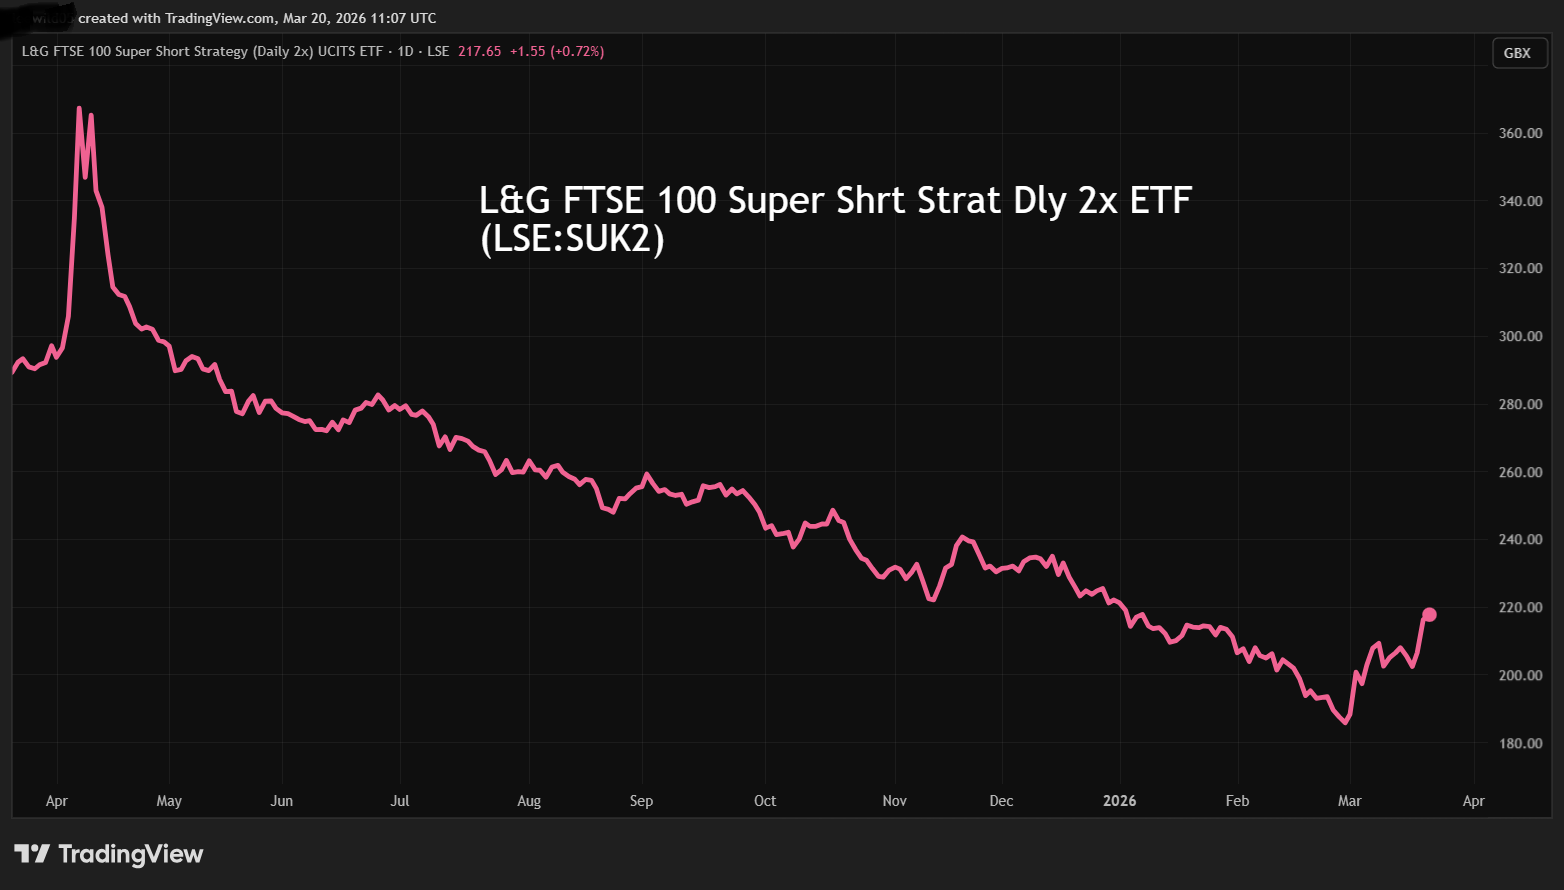
Source: TradingView. Past performance is not a guide to future performance.
Very few investors have any awareness of the extent of economic damage wrought by the 1973-74 OPEC oil embargo caused by Arab nations taking vengeance on countries supporting Israel in the Yom Kippur war from October 1973. It’s likely why the stock market initially did not know what to make of the current crisis until a wake-up this week.
While it is premature to draw much parallel, Iran has prepared for an Israeli/US air onslaught for decades, and most people assumed Ukraine would fall when Russia struck its initial blitz, a “decapitation” effort for regime change that failed. The Ukraine invasion continues after four years, and Iranian forces are not just an army, they are “revolutionary guards” driven by religion.
Possibly, the shock effect of gas prices initially soaring 30% yesterday in response to tit-for-tat strikes on major Iranian/Qatari gas facilities, will calm down after the US president had stern words with the Israeli prime minister against further such action.
Yet the disruptive effect is already apparent, with claims that the strikes on Qatari capacity have knocked out 17% of its liquefied natural gas (LNG) export capacity, adding problems to the supply choke given that Iran controls the Strait of Hormuz.
With some 2,500 US marines on the way from Singapore, this starts to look like it could be a “boots on the ground” longer-term commitment. While the US secretary of war mouths “finish the job”, it is possible President Donald Trump backs down, mindful of public opinion ahead of mid-term elections. But that would leave a wounded, angered regime intent on inflicting maximum economic damage to the West.
S&P 500 down below its 200-day moving average
It marks the first time in around 10 months that the S&P 500 index has dropped below its 200-day moving average, a key long-term support level. If there is no respite, it marks a shift to bearish sentiment.
The last time the S&P 500 closed below this level was in early 2025, but Trump quickly softened his “reciprocal tariffs” that had caused the plunge.
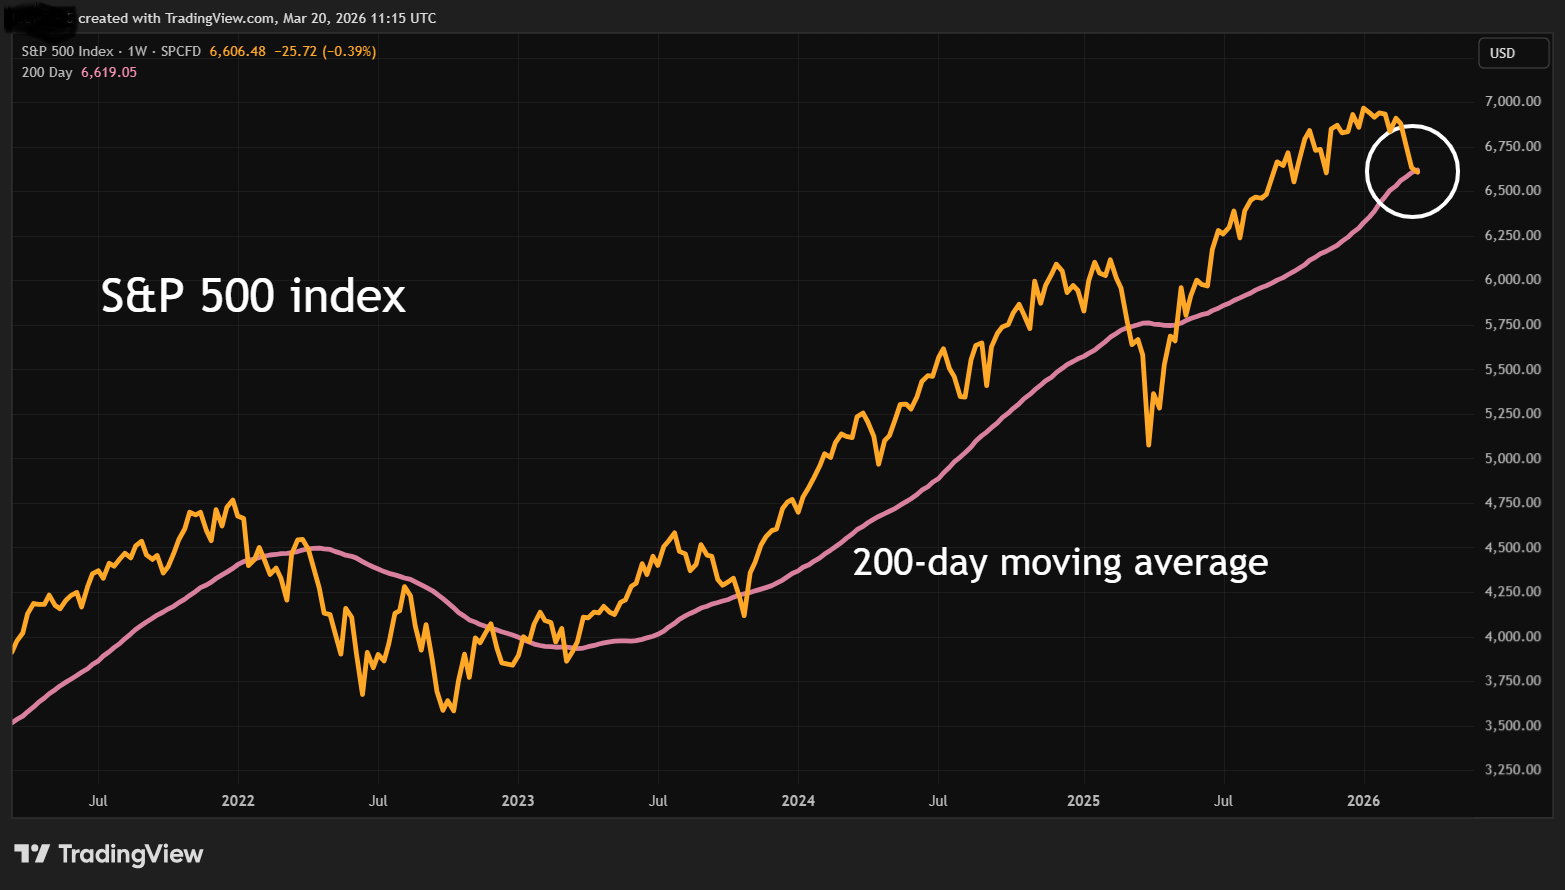
Source: TradingView. Past performance is not a guide to future performance.
Currently, however, the US arguably does not have control over events. A sudden request for Congress to approve $200 billion (£149 billion) for the war effort probably has the Iranian regime gleeful that it can dig in and exact a painful toll on US debt, hence potentially the dollar.
During the October 1973 to March 1974 oil crisis, the S&P 500 fell nearly 50%, related to a 60-70% slump in oil exports from the Middle East by November 1973, causing sharp fuel price increases. The oil price trebled to near $12 a barrel and, despite US oil production, the lack of a strategic petroleum reserve sparked America’s first major oil shortage since the Second World War.
In the UK, the impact was worse due to conflation with a secondary banking crisis after the 1960s Labour government relaxed controls, creating risky Northern Rock-type banks. Since 2008, banking regulation has toughened, but we still see a £2 billion property lender – Market Financial Solutions – having collapsed amid allegations of lending irregularities. While this doesn’t seem on a scale similar to 1974, strains in the US private credit market, as wealthy individuals rush to extract money from funds, needs watching.
- Funds worth watching as Middle East conflict grinds on
- Sign up to our free newsletter for investment ideas, latest news and award-winning analysis
Years ago, I used to chat with a retired fund manager who worked throughout the period when the UK stock market fell 74% from an April 1972 peak to December 1974 trough. He was scarred by the experience and would relate to me how long it took sentiment to recover.
Drivers of current inflation are, however, relatively tame compared with industrial unrest and strikes in the 1970s, resulting in a three-day-week to conserve electricity, which crippled industrial production. The irresponsible “Barber Boom” loose policies by the Edward Heath government chancellor, helped UK inflation soar over 24%, and stagflation meant gross domestic production (GDP) fell nearly 7%.
There was also a 1979 crisis due to a drop in oil production following the Iranian Revolution, the price more than doubling to near $40 a barrel. This also led to fuel shortages despite global oil supply easing only 4%. Then in 1980, following the onset of the Iran-Iraq War, Iraq’s production also fell and consequent price rises helped trigger global recession.
While I don’t think we face as serious a dilemma as the 1970s, I am askance at the Bank of England governor saying yesterday that inflation risk is unlike crises such as Covid and the Ukraine invasion. He was responding to claims that interest rates may need to rise serially this year to fight the impending inflation shock. To me, it repeated his complacency during Covid, and if he lets inflation jump again it will drive more voters towards the Greens and Reform, exploiting dissatisfaction with UK elites.
- Want to pay less tax? Here are five allowances to use by 5 April
- Fund Focus: what the Iran conflict means for your portfolio
This time, a major Middle East energy crisis has the potential to compromise supplies a lot longer than OPEC’s vengeance-action that came to a negotiated end after six months. Shipping escorts do not seem a solution due to the extent of resources required and their vulnerability to attack.
While there are scant signs of profit warnings currently – the situation seems balanced, with some companies even surprising on the upside – unless this crisis calms soon, then scope exists for affected companies to warn in a few months.
This is worth considering if you are minded to “buy the drop”, especially when compared with the tariffs situation a year ago when Trump swiftly changed his tune once the stock market was hit.
A boon for renewables energy investment trusts?
On 10 March, I explained how I liked both the Renewables Infrastructure Grp (LSE:TRIG) and Greencoat UK Wind (LSE:UKW) given their discounts to net assets and high dividend yields – arguing that there was a decent chance of inflection points at current depressed share price levels.
I wrote: “Soaring oil & gas prices – especially if sustained – will raise electricity prices, rekindling appeal for broader resources given around 30% is currently derived from natural gas.”
Mind you, such trusts are not pure plays given TRIG has hedged 75% of revenues over the next five years, diluting price rises, while Greencoat has fixed 59% of its discounted cash flows over the next seven years. Its dividend policy usefully links to consumer price inflation (CPI).
Even so, the shares picked up yesterday after gas prices leapt 30% in initial response to attacks on key Middle East facilities. TRIG rose 2% to 69p, but Greencoat soared 6% to 103p on 13.5 million volume compared with 4.2 million last Wednesday.
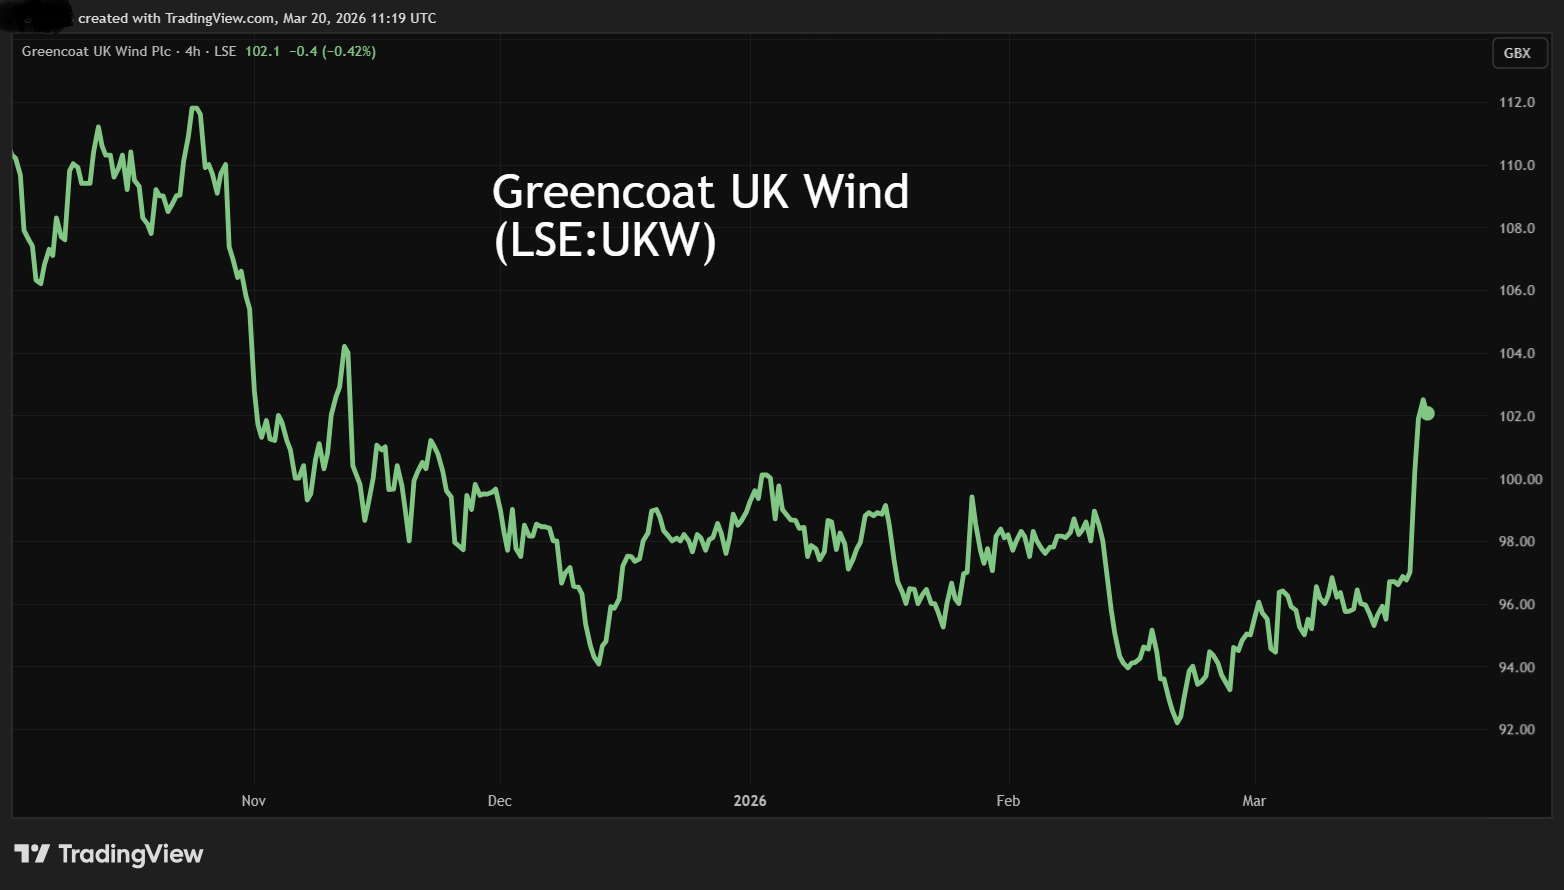
Source: TradingView. Past performance is not a guide to future performance.
interactive investor yesterday published a recent interview with Greencoat’s fund manager. A key takeaway for me was his claim that although wind returns can be volatile in the average year – a standard deviation of about 10% in terms of energy production – this is more like 2% over 30 years.
- Greencoat UK Wind interview: how we’ll power our inflation-linked dividend
- Greencoat UK Wind interview: 10%-plus yield but hit by rate rises: will performance turn around?
- Stockwatch: why I like these two renewable infrastructure funds
I’m not sure whether that answers some investors’ wariness about wind, and whether climate change is changing the long view, but this gas-price hike raises the odds of an inflection point for long-sold renewables trusts.
Obviously, oil & gas is to the fore: mid-cap Harbour Energy (LSE:HBR) shares rose 9% yesterday to 319p, not long after I maintained a “buy” stance at 285p on 6 March.
The dilemma with all such “fossil-fuel energy risk” plays is that it only takes an abating of fear for prices to calm. Progress restoring oil passage through the Strait of Hormuz would see oil prices sell off.
Harbour Energy – a sensitive share given its debt – is initially down 5% to 304p this morning after a US general explicated the fight along Iran’s southern coast, taking out attack craft in the Strait.
Pressure is on the Israeli and US leaders to justify their actions, hence I suspect the military onslaught will continue in the near term, rather than either backing down.
Edmond Jackson is a freelance contributor and not a direct employee of interactive investor.
These articles are provided for information purposes only. Occasionally, an opinion about whether to buy or sell a specific investment may be provided by third parties. The content is not intended to be a personal recommendation to buy or sell any financial instrument or product, or to adopt any investment strategy as it is not provided based on an assessment of your investing knowledge and experience, your financial situation or your investment objectives. The value of your investments, and the income derived from them, may go down as well as up. You may not get back all the money that you invest. The investments referred to in this article may not be suitable for all investors, and if in doubt, an investor should seek advice from a qualified investment adviser.
Full performance can be found on the company or index summary page on the interactive investor website. Simply click on the company's or index name highlighted in the article.
Disclosure
We use a combination of fundamental and technical analysis in forming our view as to the valuation and prospects of an investment. Where relevant we have set out those particular matters we think are important in the above article, but further detail can be found here.
Please note that our article on this investment should not be considered to be a regular publication.
Details of all recommendations issued by ii during the previous 12-month period can be found here.
ii adheres to a strict code of conduct. Contributors may hold shares or have other interests in companies included in these portfolios, which could create a conflict of interests. Contributors intending to write about any financial instruments in which they have an interest are required to disclose such interest to ii and in the article itself. ii will at all times consider whether such interest impairs the objectivity of the recommendation.
In addition, individuals involved in the production of investment articles are subject to a personal account dealing restriction, which prevents them from placing a transaction in the specified instrument(s) for a period before and for five working days after such publication. This is to avoid personal interests conflicting with the interests of the recipients of those investment articles.