The investments trusts that beat Nvidia in 2025
Many ‘vanilla’ trusts outperformed the sexiest stock in the world, writes Kepler analyst Thomas McMahon.
9th January 2026 14:00
This content is provided by Kepler Trust Intelligence, an investment trust focused website for private and professional investors. Kepler Trust Intelligence is a third-party supplier and not part of interactive investor. It is provided for information only and does not constitute a personal recommendation.
Material produced by Kepler Trust Intelligence should be considered a marketing communication, and is not independent research.
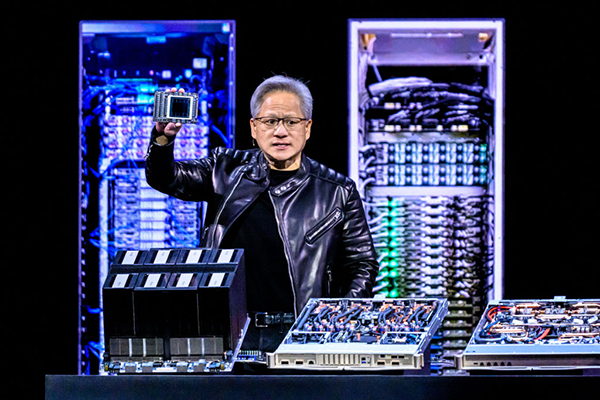
Nvidia CEO Jensen Huang at the GTC AI Conference in San Jose, California, in March 2025. (Photo: JOSH EDELSON/AFP via Getty Images.
Without looking, what would be your best guess for the returns of the Latin American index in 2025? Well, as of 19 December 2025, it was up 43.6% in sterling terms. NVIDIA Corp (NASDAQ:NVDA), on the other hand, was up around half this, at 26.4%. Great returns for the year, and well ahead of the 10.4% the S&P 500 delivered, but UK investors aren’t benchmarked to the S&P. In fact, lots of investment trusts did significantly better than the world’s largest graphics card creator in 2025, which we think has some lessons for 2026.
Monotonous monoculture
Nvidia has dominated investment discourse over 2025. The most popular retail buys and sells tracked by our investment writing team show that it has dominated trades as well. Across four of the largest retail platforms it was the most-bought stock in five of the first 11 months of 2025, and in the top three most-bought in nine of those months.
The chart below shows some signs of a wobble in conviction in the three months following Liberation Day, but it was back at the top again by the end of the year.
To interpret the chart below, note that a lower number means it is higher up the list of most-bought stocks.
NVIDIA ON RETAIL PLATFORMS
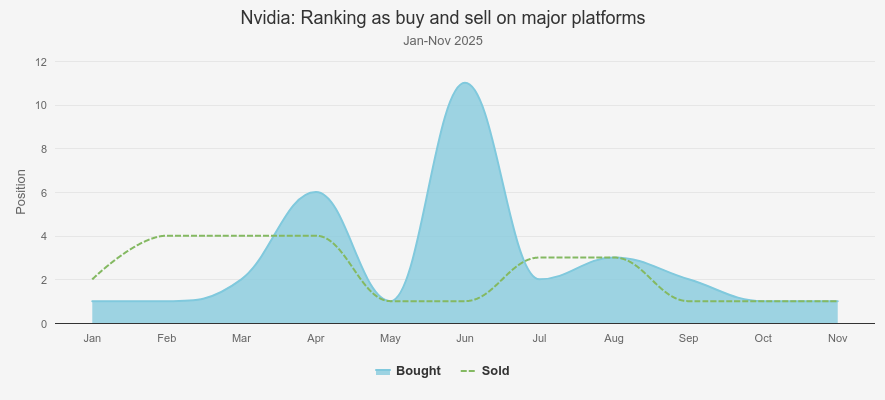
Source: Hargreaves Lansdown, AJ Bell, Bestinvest and interactive investor.
Any parent will be well aware that the American dominance of our culture is only growing. We think the US-centric nature of financial media and social media in general has contributed to Nvidia staying central to the conversation – in dollar terms it has returned around 33%, and, of course, outperformed the US investor’s benchmark, the S&P 500. But under the radar, lots of more prosaic investments have delivered much better returns.
The growth themes that outperformed
By our count, 65 investment trusts outperformed an investment in Nvidia in 2025, and 10 Morningstar sector averages did. The top performer was Golden Prospect Precious Metal Ord (LSE:GPM), which delivered a stunning 147.9% share price return (to 19 December 2025). Gold the metal had a good year, and the miners finally caught up.
The performance of gold miners also drove the generalist mining trusts: CQS Natural Resources G&I Ord (LSE:CYN)made 89.9% and BlackRock World Mining Trust Ord (LSE:BRWM)73.9%. Gold miners entered the year looking cheap and unloved, not having responded to gold’s strength in 2024. In fact, gold mining indices underperformed the metal in 2024, and investors who stuck with that trade rather than investing in thematically related equities, which had lagged, would have lost out.
Copper prices were also strong over 2025, and this contributed to good returns for the mining trusts. Copper benefits from demand for AI data centres and the expansion of the grid necessary to power them. Copper miners supported the returns of BlackRock Latin American Ord (LSE:BRLA), up 52.9%, with the strength of demand for materials boosting domestic economies in its region, as well as Fidelity Emerging Markets Ord (LSE:FEML), with the latter delivering a share price total return of 49.3%.
FEML also had some very successful investments in technology stocks connected to the AI trade. This is another theme to come out of the table: investing in AI-related assets further down the chain than Nvidia’s GPUs. Rotating out of 2024’s leading stocks in this theme into related names yet to keep up would have been a winning strategy in 2025.
A recovery in China boosted a number of trusts to outperform Nvidia in 2025. Some optimism about the potential for AI may have contributed to good returns in the tech sector in the country, so there are some parallels with this trade. EVs and autonomous driving continues to deliver gains for related companies too, with there being some connections to AI.
Dale Nicholls, manager ofFidelity China Special Situations Ord (LSE:FCSS), has been taking some profits in these areas and rotating into consumer-related names, which he thinks could have catch-up potential. We think this might be a fruitful avenue to explore in 2026 in countries where AI-related earnings are strong enough to boost activity across the economy – Latin America could be one such area. FCSS made 42.3% over 2025, and Baillie Gifford China Growth Trust Ord (LSE:BGCG)37%.
MINING AND EM OUTPERFORMERS
Source: Morningstar, 01/01/2025 – 19/12/2025. Past performance is not a reliable indicator of future results.
Biotech is another success story of 2025, and here there is no AI-related angle. It is historically a high-growth sector that does well in lower interest rate environments. We entered the year with political risk hanging over the sector, but this has lifted, and as rates have come down and, we suggest, as institutional investors look to rotate away from AI to other growth themes, biotech has come back into business.
RTW Biotech Opportunities Ord (LSE:RTW) +48.5%, International Biotechnology Ord (LSE:IBT) +46.1%, and Biotech Growth Ord (LSE:BIOG) +39.8%, have all prospered, with these returns coming since August. Macro factors have worked for biotech, but so did value: biotechnology was looking cheap entering the year, and despite the fundamentals of the sector – the science, the need for larger companies to buy out the owners of new drugs, the strength of balance sheets – looking good.
The value themes that outperformed
Perhaps so far the trusts and themes to have outperformed Nvidia are, if not expected, then unsurprising. Mining, data centres, the AI supply chain and biotech are all well-known growth themes. Spotting growth themes that had yet to respond to an improving backdrop would have seen investors fishing in these areas and benefitting. We think it is much more surprising that many of the plain vanilla UK investment trusts outperformed the sexiest stock in the world.
Temple Bar Ord (LSE:TMPL)has delivered a share price total return of 44.8%, ahead of Fidelity Special Values Ord (LSE:FSV)and its 35.5%. Lowland Ord (LSE:LWI), Schroder Income Growth Ord (LSE:SCF), Shires Income Ord (LSE:SHRS), Aberdeen Equity Income Trust (LSE:AEI), CT UK High Income Ord (LSE:CHI), City of London Ord (LSE:CTY) and JPMorgan Claverhouse Ord (LSE:JCH) all outperformed Nvidia too.
The income trusts outperformed the growth trusts and the large-cap trusts outperformed the small- and mid-caps. We think this is a good example of how recoveries in out-of-favour sectors tend to fly under the radar at first. There isn’t really anything driving the UK large-caps beyond them being extremely cheap and having incorporated a huge amount of negativity in the price. In that regard, and looking at how the AI trade broadened over 2025, we think UK small- and mid-caps are somewhere to watch. We think they could be to UK large-caps in 2026 what the miners were to gold or the data centre materials were to GPUs in 2025.
Most trusts in the Europe sectors underperformed Nvidia, but there were a couple of exceptions: JPMorgan European Growth & Income Ord (LSE:JEGI), which was up 45.3%. JEGI aims to be a core holding, with a portfolio that mixes style exposure and delivers incremental outperformance of the benchmark. In 2025, it benefited as its managers tilted the portfolio away from the global growth leaders and towards more domestically oriented stocks, which included building up its exposure to small- and mid-caps. JPMorgan European Discovery Ord (LSE:JEDT), run by the same house’s small-cap team also outperformed Nvidia with returns of 35.5%.
UK AND EUROPEAN OUTPERFORMERS
| Association of Investment Companies (AIC) Sector | SP Return (GBP, %) | Latest Discount (Cum Fair, %) | |
| Marwyn Value Investors Ord (LSE:MVI) | UK Smaller Companies | 61.1 | -47.4 |
| JPMorgan European Growth & Income Ord (LSE:JEGI) | Europe | 45.3 | -0.92 |
| Temple Bar Ord (LSE:TMPL) | UK Equity Income | 44.8 | 1.1 |
| SVM UK Emerging | UK Smaller Companies | 37 | -4 |
| Fidelity Special Values Ord (LSE:FSV) | UK All Companies | 35.5 | -0.8 |
| JPMorgan European Discovery Ord (LSE:JEDT) | European Smaller Companies | 35.5 | -7.67 |
| Lowland Ord (LSE:LWI) | UK Equity Income | 33.9 | -9.4 |
| Schroder Income Growth Ord (LSE:SCF) | UK Equity Income | 33 | -5.1 |
| Shires Income Ord (LSE:SHRS) | UK Equity Income | 32.7 | -3.2 |
| Aberdeen Equity Income Trust (LSE:AEI) | UK Equity Income | 31.5 | 1.3 |
| CT UK High Income B Share Ord (LSE:CHIB) | UK Equity Income | 29.3 | -0.5 |
| City of London Ord (LSE:CTY) | UK Equity Income | 28.6 | 1.9 |
| JPMorgan Claverhouse Ord (LSE:JCH) | UK Equity Income | 28 | -5.2 |
| CT UK High Income Ord (LSE:CHI) | UK Equity Income | 26.7 | 3.2 |
| NVIDIA Corp (NASDAQ:NVDA) | 26.4 |
Source: Morningstar, 01/01/2025 – 19/12/2025. Past performance is not a reliable indicator of future results.
Another area of value to have delivered greater share price returns than Nvidia is to be found in deeply discounted trusts in the alternative assets sectors. In some cases, share price returns reflect positive operational developments and improving sentiment. Seraphim Space Investment Trust Ord (LSE:SSIT) more than doubled in share price terms as the discount narrowed from over 40% to circa 5%. A lot of these gains came in December after it was announced that its largest holding, ICEYE, had signed a £1.5 billion contract with German defence manufacturer Rheinmetall AG (XETRA:RHM). ICEYE made up 34.7% of SSIT’s NAV prior to the contract win, so there is scope for a significant uplift to the NAV.
Molten Ventures Ord (LSE:GROW)has seen a re-rating as asset sales have validated the NAV, with the write-up of largest holding Revolut ahead of an IPO acting as a reminder of the potential in venture capital. Gresham House Energy Storage Ord (LSE:GRID)’s 71% returns reflect some positive NAV progression, new projects being funded and refinancing at lower rates, as well as the resumption of dividends for the first time since Q4 2023.
In GRID’s case, the takeover of Harmony Energy Income in the summer may have raised hopes of a similar value-unlocking resolution too. In some cases, it is takeovers that have delivered the returns, with Urban Logistics REIT and Warehouse REIT both bought out at large premiums to the share price, delivering returns of 56.7% and 48.1% to shareholders respectively. Harmony Energy Income itself delivered 41.5%.
There are still plenty of exceptionally wide discounts in the alternative asset space and we think it likely that consolidation and takeovers will feature again next year. This is a hard theme for the individual investor to play, and perhaps one best left to the professionals who can invest at size and engage. MIGO Opportunities Trust Ord (LSE:MIGO) is set up precisely to find opportunities to engage to unlock value in the alternatives space, and could be one to watch in 2026.
ALTERNATIVE ASSETS OUTPERFORMERS
| Association of Investment Companies (AIC) Sector | SP Return (GBP, %) | Latest Discount (Cum Fair, %) | |
| Seraphim Space Investment Trust Ord (LSE:SSIT) | Growth Capital | 108.6 | -5.1 |
| Gresham House Energy Storage Ord (LSE:GRID) | Renewable Energy Infrastructure | 71.1 | -32.9 |
| Urban Logistics REIT | Property - UK Logistics | 56.7 | -0.4 |
| Molten Ventures Ord (LSE:GROW) | Growth Capital | 55.4 | -31.5 |
| Warehouse REIT | Property - UK Logistics | 48.1 | -12.9 |
| JPEL Private Equity Ord (LSE:JPEL) | Private Equity | 41.5 | -10.2 |
| Harmony Energy Income Trust | Renewable Energy Infrastructure | 41.5 | -0.3 |
| Ecofin Global Utilities & Infra Ord (LSE:EGL) | Infrastructure Securities | 41.2 | -6 |
| Schroders Capital Global Innov Trust Ord (LSE:INOV) | Growth Capital | 40.9 | -27.6 |
| Petershill Partners Ord (LSE:PHLL) | Growth Capital | 38.6 | -11.1 |
| Downing Renewables & Infrastructure | Renewable Energy Infrastructure | 37.9 | -9.5 |
| CareTrust REIT Inc (NYSE:CTRE) | Property - UK Healthcare | 35.3 | -13.1 |
| Premier Miton Glb Renewables Trust Ord (LSE:PMGR) | Infrastructure Securities | 35 | -0.1 |
| VPC Specialty Lending Investments Ord (LSE:VSL) | Debt - Direct Lending | 34.5 | -45.9 |
| NB Distressed Debt New Glb (LSE:NBDG) | Debt - Loans & Bonds | 31.5 | -14.1 |
| Chenavari Toro Income Fund Ord (LSE:TORO) | Debt - Structured Finance | 31.3 | -2.7 |
| Volta Finance Ord EUR (LSE:VTA) | Debt - Structured Finance | 30.3 | -7.1 |
| Aquila Energy Efficiency Trust Ord (LSE:AEET) | Renewable Energy Infrastructure | 29.1 | -43.7 |
| NVIDIA Corp (NASDAQ:NVDA) | 26.4 |
Source: Morningstar, 01/01/2025 – 19/12/2025. Past performance is not a reliable indicator of future results.
Conclusion
Nvidia has dominated the headlines this year. It is the largest company in the world and intimately involved in the strategic rivalry between the US and China, but we think a common trend in markets is for an aura of “winning” to hang around long after market leadership has passed on, and that is the case with Nvidia. Better returns have been delivered by trusts playing themes connected to the AI trade, further down the chain. Looking for areas connected to the leading themes that had lagged in price and valuation would have led investors there.
Other areas that have been deeply depressed for years also outperformed, sometimes simply because all the negativity was in the price (the UK) and sometimes because there was also a new growth factor to consider (Europe and the stimulus of defence spending). In the alternative assets space, it was a mixture of both, with corporate activity or the expectation of it another key driver.
Looking ahead to 2026, we think countries and sectors that will benefit as AI spend flows through could do better than the expensive hardware manufacturers – consumer-related areas in Latin America and China could be such areas. We think the most obvious deeply depressed area due a re-rating is the FTSE 250, one of history’s great growth markets, recently trading on lower valuations than large-caps; we expect UK mid- and small-caps to do well.
Meanwhile, the alternative assets space looks like it should see another year of corporate activity, while falling interest rates should be a positive. Biotechs flourished in 2025 as interest rates fell and political worries lifted. We expect rates to continue to fall, providing an impetus to many growth sectors that have been left behind as Nvidia and some connected large-caps have risen to unattractive valuations.
Kepler Partners is a third-party supplier and not part of interactive investor. Neither Kepler Partners or interactive investor will be responsible for any losses that may be incurred as a result of a trading idea.
These articles are provided for information purposes only. Occasionally, an opinion about whether to buy or sell a specific investment may be provided by third parties. The content is not intended to be a personal recommendation to buy or sell any financial instrument or product, or to adopt any investment strategy as it is not provided based on an assessment of your investing knowledge and experience, your financial situation or your investment objectives. The value of your investments, and the income derived from them, may go down as well as up. You may not get back all the money that you invest. The investments referred to in this article may not be suitable for all investors, and if in doubt, an investor should seek advice from a qualified investment adviser.
Full performance can be found on the company or index summary page on the interactive investor website. Simply click on the company's or index name highlighted in the article.
Important Information
Kepler Partners is not authorised to make recommendations to Retail Clients. This report is based on factual information only, and is solely for information purposes only and any views contained in it must not be construed as investment or tax advice or a recommendation to buy, sell or take any action in relation to any investment.
This report has been issued by Kepler Partners LLP solely for information purposes only and the views contained in it must not be construed as investment or tax advice or a recommendation to buy, sell or take any action in relation to any investment. If you are unclear about any of the information on this website or its suitability for you, please contact your financial or tax adviser, or an independent financial or tax adviser before making any investment or financial decisions.
The information provided on this website is not intended for distribution to, or use by, any person or entity in any jurisdiction or country where such distribution or use would be contrary to law or regulation or which would subject Kepler Partners LLP to any registration requirement within such jurisdiction or country. Persons who access this information are required to inform themselves and to comply with any such restrictions. In particular, this website is exclusively for non-US Persons. The information in this website is not for distribution to and does not constitute an offer to sell or the solicitation of any offer to buy any securities in the United States of America to or for the benefit of US Persons.
This is a marketing document, should be considered non-independent research and is subject to the rules in COBS 12.3 relating to such research. It has not been prepared in accordance with legal requirements designed to promote the independence of investment research.
No representation or warranty, express or implied, is given by any person as to the accuracy or completeness of the information and no responsibility or liability is accepted for the accuracy or sufficiency of any of the information, for any errors, omissions or misstatements, negligent or otherwise. Any views and opinions, whilst given in good faith, are subject to change without notice.
This is not an official confirmation of terms and is not to be taken as advice to take any action in relation to any investment mentioned herein. Any prices or quotations contained herein are indicative only.
Kepler Partners LLP (including its partners, employees and representatives) or a connected person may have positions in or options on the securities detailed in this report, and may buy, sell or offer to purchase or sell such securities from time to time, but will at all times be subject to restrictions imposed by the firm's internal rules. A copy of the firm's conflict of interest policy is available on request.
Past performance is not necessarily a guide to the future. The value of investments can fall as well as rise and you may get back less than you invested when you decide to sell your investments. It is strongly recommended that Independent financial advice should be taken before entering into any financial transaction.
PLEASE SEE ALSO OUR TERMS AND CONDITIONS
Kepler Partners LLP is a limited liability partnership registered in England and Wales at 9/10 Savile Row, London W1S 3PF with registered number OC334771.
Kepler Partners LLP is authorised and regulated by the Financial Conduct Authority.