AIM versus FTSE 100: why small-caps are flying
Our award-winning AIM writer talks top stocks, what moves AIM shares and outperformance since the crash.
15th May 2020 15:40
by Andrew Hore from interactive investor
Our award-winning AIM writer talks top stocks, what moves AIM shares and outperformance since the crash.

AIM has recovered faster than the FTSE 100 index in the past seven weeks since they both reached their low for the year.
Generally, smaller companies are likely to be slower in reacting to a downturn, although it can tend to be deeper, and they are later in recovering. That has not happened this time. Most of the outperformance has happened during the recovery.
One of the things about the decline in February and March was that it was such a sharp fall. Normally, smaller companies lag the performance of the larger ones which tend to be easier to sell in the downturn, and buying in a recovery can initially be focused on what are perceived as safer companies.
The latest fall was so fast and the recovery, while not equally as sharp, was also so significant that AIM companies have particularly outperformed since 20 March.
The FTSE SmallCap index has also outperformed the FTSE 100 since 20 March, but not by as much. This suggests that the outperformance is partly down to smaller companies, although those on AIM have done better than their Main Market counterparts.
| Index | 20 Mar 2020 to now (% change) | 20 Feb 2020 to now (% change) |
|---|---|---|
| FTSE 100 | 10.6 | -22.8 |
| FTSE 250 | 13.3 | -29.6 |
| FTSE SmallCap | 14.2 | -25.4 |
| FTSE AIM All Share | 28.4 | -17.9 |
| FTSE AIM 100 | 28.4 | -17.8 |
| Source: SharePad as at 14 May 2020 | ||
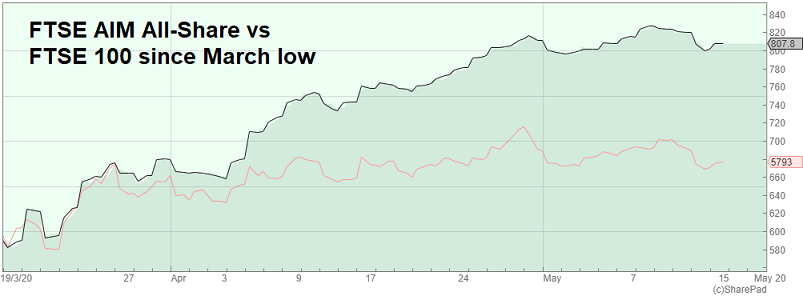
Source: SharePad (red line is FTSE 100) Past performance is not a guide to future performance.
Back at the time of the financial crisis in 2008-09, AIM continued to fall when the FTSE 100 started to stabilise.
This meant it had much further to recover in order to catch up with the FTSE 100 – and it has not managed to do that in the subsequent period.
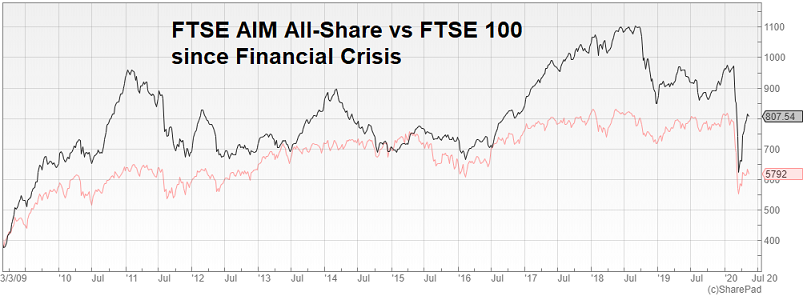
Source: SharePad (red line is FTSE 100) Past performance is not a guide to future performance.
Part of the reason that the FTSE 100 has outperformed AIM over the past decade is that its price/earnings (PE) ratio has been high. The PE ratio rose above 40 during 2016, although it had fallen below 17 by the start of this year.
AIM has had some high-profile winners in recent weeks, particularly those with operations that can help with the Covid-19 outbreak and respiratory diseases.
Since the start of the downturn, AIM-quoted Novacyt (LSE:NCYT) has soared by 423% on the back of its Covid-19 test, which has certainly helped to boost its cash pile, which reached €9.2 million at the end of April – although that is still lower than the overdraft and other loans at the end of 2019.
Even so, Novacyt’s weighting in the FTSE AIM All Share index is still small, so it will have a limited effect on overall AIM performance. That is despite the fact that the share price has risen more than twentyfold in the past 12 months. Many of the spectacular share prices on AIM have been by even smaller companies.
- Covid-19: winning AIM stocks fighting the virus
- 12 coronavirus stocks: another AIM share rallies 90%
- Why Genedrive shares are up 3,200% in just six weeks
The make-up of the markets and indexes is one of the things that have an effect on relative performance. AIM is likely to have faster growing companies, but that is not the only reason. Some markets and their index can have a bias towards poorly performing industry sectors.
Constituents help explain outperformance
The poorest performers in the FTSE 100 are predominantly airline and aerospace-related businesses. International Consolidated Airlines Group (LSE:IAG) and easyJet (LSE:EZJ) have slumped in recent weeks.
Melrose (LSE:MRO) and Meggitt (LSE:MGGT) have also fallen sharply, presumably on worries about the demand for aeroplanes once the lockdown ends around the world. Cruise company Carnival (LSE:CCL) is another of the worst performers.
Dart Group (LSE:DTG), the owner of the Jet2 airline, has lost three-quarters of its value since February and is one of the largest companies on AIM, but there is less exposure to these travel and aerospace sectors overall. Travel and leisure is just over 2% of AIM’s market value.
Banks have been hard hit by the crisis, particularly HSBC (LSE:HSBA) and Lloyds (LSE:LLOY), and this is a sector that is significant in the FTSE 100 index but has little representation on AIM.
Oil majors BP (LSE:BP.) and Royal Dutch Shell (LSE:RDSB), where both classes of share are included in the index, have two of the largest weightings in the FTSE 100, and the weak oil price has held back their performance.
BP and Shell shares have declined by more than one-third since 20 February, but they have outperformed the index since 20 March. At the start of the year, these two companies accounted for 14.4% of the index.
In contrast, oil and gas is 5.56% of AIM and slightly less of the AIM 100. The largest AIM oil companies - Hurricane Energy (LSE:HUR) and Serica Energy (LSE:SQZ) - have both performed worse than AIM as a whole.
This is an example of how AIM has changed over the years. In the past, oil and gas companies would have accounted for a much higher percentage of the junior market.
Ocado (LSE:OCDO) is one of the best performers in the FTSE 100 because of its exposure to online shopping.
Since 20 February, Ocado has risen by 70.8%, making it the best performer in the FTSE 100, and it is still the fourth-best performer since 20 March. But it is one of the smaller constituents of the index, so it does not have a large effect on the overall index.
However, online clothing retailers ASOS (LSE:ASC) and Boohoo (LSE:BOO) have both bounced back significantly and they make up the majority of the 10.1% weighting of the retail sector on AIM. ASOS has risen by 124% and boohoo by 84.9% since 20 March.
Best performers
| AIM 100 Company | Since 20 March 2020 (% change) |
|---|---|
| ASOS (LSE:ASC) | 124.0 |
| Boohoo (LSE:BOO) | 84.9 |
| Fevertree Drinks (LSE:FEVR) | 74.9 |
| ITM (LSE:ITM) | 64.9 |
| Highland Gold Mining (LSE:HGM) | 57.4 |
| FTSE 100 Company | Since 20 March 2020 (% change) |
|---|---|
| Flutter Entertainment (LSE:FLTR) | 51.1 |
| Ashtead (LSE:AHT) | 48.7 |
| Intermediate Capital Group (LSE:ICP) | 47.3 |
| Ocado Group (LSE:OCDO) | 45.6 |
| Polymetal International (LSE:POLY) | 40.1 |
Worst performers
| AIM 100 Company | Since 20 March 2020 (% change) |
|---|---|
| Eddie Stobart Logistics (LSE:ESL) | -41.0 |
| Alpha FX Group (LSE:AFX) | -36.8 |
| Scapa (LSE:SCPA) | -16.4 |
| Purplebricks (LSE:PURP) | -14.4 |
| Hurricane Energy (LSE:HUR) | -8.7 |
| FTSE 100 Company | Since 20 March 2020 (% change) |
|---|---|
| Rolls-Royce Holdings (LSE:RR.) | -31.3 |
| International Consolidated Airlines Group (LSE:IAG) | -22.2 |
| HSBC (LSE:HSBA) | -20.3 |
| easyJet (LSE:EZJ) | -19.3 |
| BT Group (LSE:BT.A) | -19.0 |
Healthcare has been one of the better performing sectors. AstraZeneca (LSE:AZN) and GlaxoSmithKline (LSE:GSK) have large weightings in the FTSE 100. The former has outperformed, but GlaxoSmithKline has lagged.
The FTSE AIM Healthcare index has fallen by 5% since 20 February, but it has risen by 31.5% since 20 March.
Antibodies supplier Abcam (LSE:ABC), one of the largest companies on AIM, has done well, but many of the healthcare companies that have had meteoritic share price rises, such as Novacyt, Genedrive (LSE:GDR), Avacta (LSE:AVCT) and Omega Diagnostics (LSE:ODX), are so small that they will not have as big an effect on AIM as a whole, despite the share prices trading at multiples of the level less than three months ago.
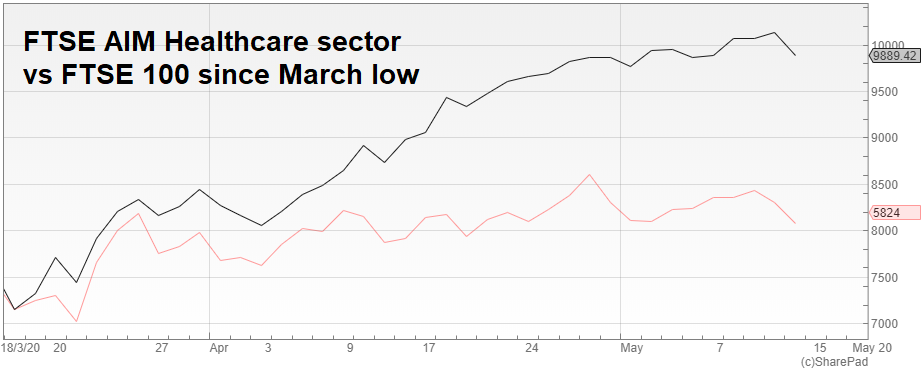
Source: SharePad (red line is FTSE 100) Past performance is not a guide to future performance.
Income – a more even playing field
Although it is a fallacy that AIM companies do not pay dividends, it is certainly true that fewer of the larger AIM companies have historically paid dividends than those in the FTSE 100. That is changing, with fewer companies paying dividends at all for the time being.
Some companies have said that they will not be paying dividends for the foreseeable future. BT (LSE:BT.A) is the main example of this. It is not just passing the latest final dividend, but says there will be no dividend for the current financial year so that it can invest in the business.
The FTSE Dividend Plus index includes companies with the top 50 yields (based on one-year forecasts) in the FTSE 350 index, and it has performed poorly. So far this year, the index has fallen by 38.2% and it has declined by 35.5% since 20 February. The bottom was 23 March, which is around the time that there was the latest review of constituents.
This gives an indication of the poor performance of the larger dividend payers with some of these impacting the FTSE 100.
The attraction of AIM companies is their potential to grow faster than their Main Market counterparts. That is a simplified description but broadly true. The flip side of that is that generally the yields of FTSE 100 companies previously offered a higher income stream, due to their cash generation.
The FTSE 100 dividend yield has been around 4% in recent years. It is currently 5.2%, although how accurate that is given the passing of many dividends is hard to gauge. AIM has a yield of 1.7% and it has only gone above 2% at times when share prices have plummeted.
- 10 Tiny Titans: cheap small-caps with a record of strong momentum
- Take control of your retirement planning with our award-winning, low-cost Self-Invested Personal Pension (SIPP)
In the past, investors might have switched into shares that were perceived to be safer and have an attractive yield. Dividends can always be passed or reduced, but this is much more likely to happen at the moment.
ASOS and boohoo do not pay dividends, so all the shareholder return comes in the form of share price movements. Fevertree Drinks (LSE:FEVR) is the third-best performer among the larger AIM companies, and it does pay dividends.
Liquidity – trading just got easier
AIM has been increasingly liquid in recent months, which means investors find stocks more easy to trade in size. This will make investors more confident when it comes to trading in shares on the junior market.
Back in 2008, when there were nearly double the number of companies, the average number of daily trades on AIM was 15,176. So far this year, it is 58,391, and in April it reached an all-time peak of 68,496. There have been more trades in the first four months of 2020 than in any one year prior to 2010.
The three best performing AIM 100 constituents since 20 March (Fevertree, ASOS and boohoo) accounted for more than £1.5 billion of trades during April. That is nearly 283,000 individual trades in total.
Novacyt was not very liquid up until this year, but it was the fourth most-traded AIM company in April. This shows that an illiquid share can become a much more liquid one if investor interest is sparked.
However, many of the companies on AIM do still lack liquidity. That can also lead to short-term price surges if there is a small amount of investor interest.
As many AIM shares are held in Inheritance Tax (IHT) portfolios, that could reduce the selling pressure in the short-term because investors need to retain them as long-term holdings or lose the IHT relief.
It has not helped Dart (LSE:DTG), but James Halstead (LSE:JHD) and Nichols have not fallen as far as the AIM market since February, even though the latter cancelled its dividend.
Taking a longer-term view, AIM is still underperforming the Main Market, but the recent level of outperformance is unlikely to continue.
Whether AIM continues to outperform the Main Market may depend on the performance of the banks and oil and gas companies, which would boost the FTSE 100 with a more significant recovery.
If companies that have passed or cancelled dividends decide they can afford to return to paying dividends, that could also provide a greater boost to the FTSE 100 than to AIM.
Andrew Hore is a freelance contributor and not a direct employee of interactive investor.
These articles are provided for information purposes only. Occasionally, an opinion about whether to buy or sell a specific investment may be provided by third parties. The content is not intended to be a personal recommendation to buy or sell any financial instrument or product, or to adopt any investment strategy as it is not provided based on an assessment of your investing knowledge and experience, your financial situation or your investment objectives. The value of your investments, and the income derived from them, may go down as well as up. You may not get back all the money that you invest. The investments referred to in this article may not be suitable for all investors, and if in doubt, an investor should seek advice from a qualified investment adviser.
Full performance can be found on the company or index summary page on the interactive investor website. Simply click on the company's or index name highlighted in the article.
Disclosure
We use a combination of fundamental and technical analysis in forming our view as to the valuation and prospects of an investment. Where relevant we have set out those particular matters we think are important in the above article, but further detail can be found here.
Please note that our article on this investment should not be considered to be a regular publication.
Details of all recommendations issued by ii during the previous 12-month period can be found here.
ii adheres to a strict code of conduct. Contributors may hold shares or have other interests in companies included in these portfolios, which could create a conflict of interests. Contributors intending to write about any financial instruments in which they have an interest are required to disclose such interest to ii and in the article itself. ii will at all times consider whether such interest impairs the objectivity of the recommendation.
In addition, individuals involved in the production of investment articles are subject to a personal account dealing restriction, which prevents them from placing a transaction in the specified instrument(s) for a period before and for five working days after such publication. This is to avoid personal interests conflicting with the interests of the recipients of those investment articles.