Kepler’s top income, growth and alt income trusts for 2026
In sharing its top-rated trusts across three categories, Kepler Trust Intelligence highlights a shift to value.
16th January 2026 14:38

This content is provided by Kepler Trust Intelligence, an investment trust focused website for private and professional investors. Kepler Trust Intelligence is a third-party supplier and not part of interactive investor. It is provided for information only and does not constitute a personal recommendation.
Material produced by Kepler Trust Intelligence should be considered a marketing communication, and is not independent research.
Our investment trust ratings set out to reward those funds that have done the best job of doing what active funds should do: outperform the returns of a passive alternative, while doing a better job of managing risk.
Strategies will come in and out of favour, but we think if you can identify those funds that deliver alpha when the backdrop is at least reasonably helpful, then with some intelligent portfolio construction and tactical moves, you should be able to do better than sticking it all in Vanguard.
Investment trusts are the ideal vehicle for an active approach. The main advantage is relatively subtle: as managers don’t have to worry about inflows or outflows, they can concentrate more fully on portfolio construction. They don’t have to keep cash on hand to fund outflows, so can remain more fully invested, and they don’t have to worry about having to sell 5% or 10% or more of the portfolio if the mood really shifts. As a result, they can take more risk with less liquid investments. There are other advantages too, not least the ability to take on long-term debt, which should in itself deliver outperformance over the long run.
With these ratings, we aim to reward those trusts which have made the most of these advantages. While they can’t be the basis of an investment decision, and investors have to research why a trust has done well and whether the future is likely to deliver conditions that will allow this to continue, we think they could be a starting point for that research.
For a full explanation of how we calculate our ratings, see the appendix at the bottom of this article.
2026 Growth rating winners
One of the interesting themes in the list of growth-rating winners for 2026 is the number of trusts with a strong value tilt winning the accolade. Temple Bar Ord (LSE:TMPL), Aberforth Smaller Companies Ord (LSE:ASL), Fidelity Asian Values Ord (LSE:FAS), and Murray International Ord (LSE:MYI) stand out in that regard.
Our growth/value score uses Morningstar data and ranks trusts within the whole peer group rather than in absolute terms. The scale is -5 (Value) to +5 (Growth). We think it is notable that the scores for these four trusts are well below the most value-tilted scores for the 2025 winners.
Japan also figures highly, with three trusts that, to a greater or lesser extent, are explicitly targeting opportunities thrown up by corporate governance reform. This has obviously been a great trend to play in order to generate alpha.
Our quality score is on a simple 1 to 10 scale, and it is interesting that the average score for our winners has risen from 5.5 last year to 6.8 this year. Much is written about the difficulties of a quality growth approach, but our data suggests it remains an important component of the strategies of the most successful managers in our sector.
2026 GROWTH-RATED FUNDS
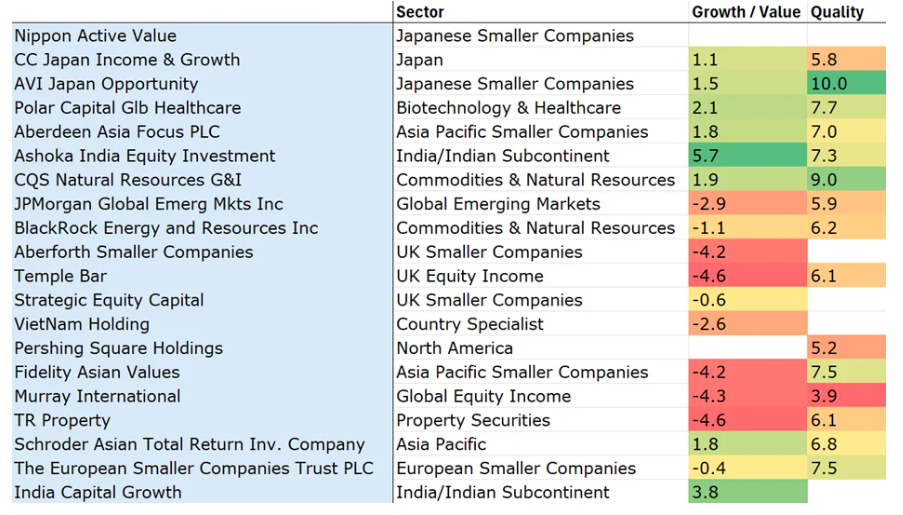
Source: Morningstar, Kepler calculations; Absence of scores indicates lack of Morningstar data
2026 Income-rating winners
Our income-rated funds for 2026 include trusts investing in multiple overseas markets, showing that while income investors might tend to have a home bias, this is not for want of strong opportunities in the investment trust sector.
In particular, the Asia equity income funds have scored very well, and as the dividend culture continues to grow in Asia, we see the argument for allocating more here. Notably, the quality score for these trusts is very close on average to that of the growth trusts, at 6.2. We have noted in the past that the most successful equity income or income and growth strategies have often tended to have a strong quality component to their strategy to counteract any danger of drifting into value traps.
This year also sees two bond funds winning an income rating: Invesco Bond Income Plus Ord (LSE:BIPS) and CVC Income & Growth GBP (LSE:CVCG). We have reorganised our ratings to bring publicly traded bond portfolios within the income rating, and reserve the alternative income rating for trusts owning private assets.
2026 INCOME-RATED FUNDS
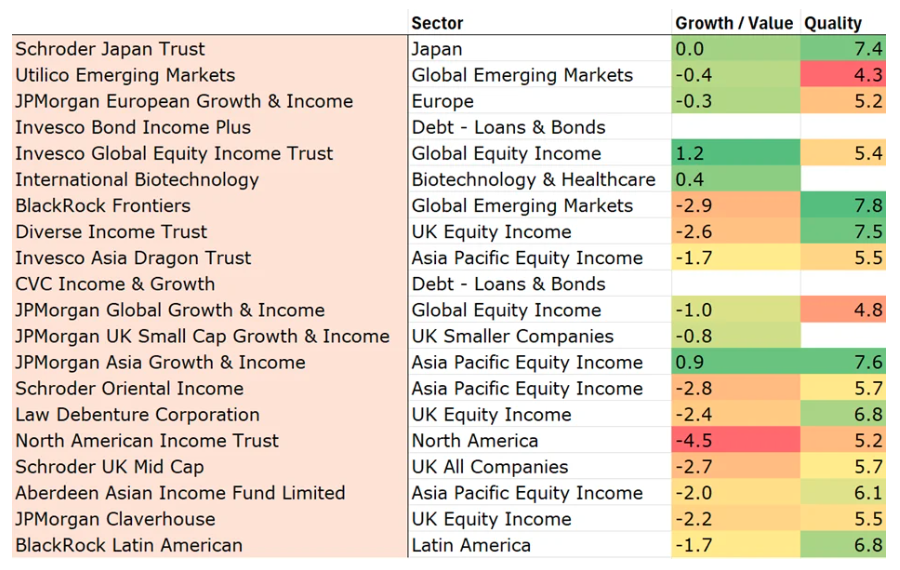
Source: Morningstar, Kepler calculations; Absence of scores indicates lack of Morningstar data
2026 Alternative income-rating winners
There has been some churn in the winners of the alternative income rating. BB Global Infrastructure (BBGI) was bought out opportunistically by an institutional investor, taking advantage of the wide discount. International Public Partnerships Ord (LSE:INPP) has taken its place.
We have brought property trusts into this category this year, and Schroder Real Estate Invest Ord (LSE:SREI) and AEW UK REIT Ord (LSE:AEWU) both made the cut. Some huge yields on this list hint at the real story in this sector, which is to do with share prices and discounts. These discounts will narrow one way or the other in the coming years, and while we look only at NAV for these ratings, in some cases, the discount narrowing will be more important than NAV to total returns in the foreseeable future.
2026 ALTERNATIVE INCOME-RATED FUNDS
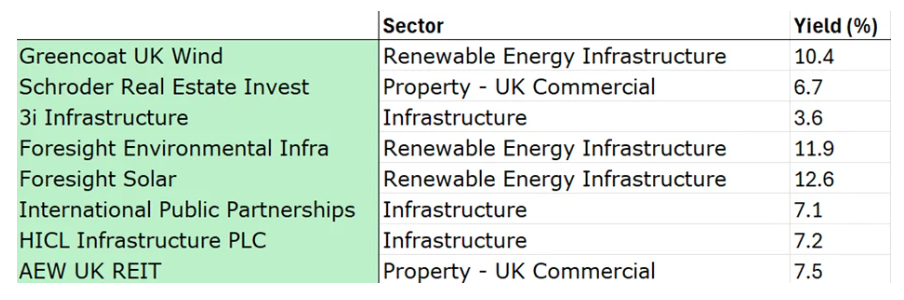
Source: Morningstar, Kepler calculations
2025 Performance
Our intention in making these ratings is to look over a long time frame of five years in order to cover a broad set of markets and avoid rating trusts based on short periods in which luck or circumstances have been helpful. However, it is interesting to look at how last year’s rated funds did over the past 12 months.
Our growth-rated funds for 2025 delivered strong returns in a good year for markets, with an average return of 18.9% and only three trusts down. However, they did underperform their benchmarks on average by 0.71%. The median underperformance was 3.6%, with five trusts underperforming by double digits. It’s worth stressing this is to the best fit benchmarks chosen using regression rather than official benchmarks. In particular, there has to be an asterisk over the figures for BlackRock Frontiers, which has a bespoke benchmark not in Morningstar databases, while the two Vietnam trusts may have chosen slightly different benchmarks themselves.
12M PERFORMANCE OF 2025’S GROWTH-RATED FUNDS
| Investment | Calculation Benchmark | NAV TR | Excess Return |
| CQS Natural Resources G&I Ord (LSE:CYN) | Morningstar Gbl Upstm Nat Res NR | 92.8 | 72.8 |
| BlackRock Energy and Resources Inc (LSE:BERI) | Morningstar Gbl Upstm Nat Res NR | 35.5 | 14 |
| The European Smaller Companies Trust PLC (LSE:ESCT) | Morningstar Dev Eur x UK Small TME NR | 33.2 | 8.9 |
| Pacific Horizon Ord (LSE:PHI) | Morningstar Asia x Jpn TME NR | 29.9 | 7.6 |
| Pershing Square Holdings Ord (LSE:PSH) | Morningstar US LM Brd Growth NR | 12.8 | 4.4 |
| Fidelity China Special Situations Ord (LSE:FCSS) | Morningstar China TME NR | 33.9 | 4 |
| Schroder Japan Trust Ord (LSE:SJG) | Morningstar Japan TME NR | 18.2 | 2.1 |
| AVI Japan Opportunity Ord (LSE:AJOT) | Morningstar Japan Sml NR | 14.7 | -0.6 |
| Invesco Global Equity Income Trust ord (LSE:IGET) | Morningstar Gbl High Div Yld NR | 13.3 | -1.9 |
| JPMorgan American Ord (LSE:JAM) | Morningstar US Large-Mid NR | 4.6 | -3.6 |
| Strategic Equity Capital Ord (LSE:SEC) | Morningstar UK Small Cap TME NR | 11.6 | -5 |
| Schroder Asian Total Return Inv. Company (LSE:ATR) | Morningstar APAC x Jpn TME NR | 14.2 | -5.5 |
| Ashoka India Equity Investment Ord (LSE:AIE) | Morningstar India TME NR | -8.8 | -6 |
| Odyssean Investment Trust Ord (LSE:OIT) | Morningstar UK Small Cap TME NR | 9.4 | -8.4 |
| Fidelity European Trust Ord (LSE:FEV) | Morningstar DM Eur x UK TME NR | 16.2 | -10.6 |
| Vietnam Enterprise Ord (LSE:VEIL) | Vietnam VN Index | 16.2 | -10.9 |
| BlackRock Frontiers Ord (LSE:BRFI) | MSCI Frontier Markets NR | 15 | -21.3 |
| Pacific Assets Ord (LSE:PAC) | Morningstar Asia x Jpn TME NR | -2.5 | -25.1 |
| VietNam Holding Ord (LSE:VNH) | Vietnam VN Index | -1.2 | -28.3 |
| Display Group Median | 14.7 | -3.6 | |
| Average | 18.9 | 0.7 |
Source: Morningstar. Past performance is not a reliable indicator of future results.
On the other hand, the income-rated funds outperformed by 1.65% on average, with the median outperformance being 2.3%. Absolute performance was a bit stronger on average at 19.7%, and only two trusts were down for the year. The Asian and Emerging Markets funds did particularly well, but BlackRock World Mining Trust Ord (LSE:BRWM)led the pack with excess returns of 53.7%. In the same sector, CQS Natural Resources Growth & Income delivered the best outperformance of the growth-rated funds, at 72.8%.
12M PERFORMANCE OF 2025’S INCOME-RATED FUNDS
| Investment | Calculation Benchmark | NAV TR | Excess Return |
| (Cumulative) | |||
| BlackRock World Mining Trust Ord (LSE:BRWM) | Morningstar Gbl Upstm Nat Res NR | 74.2 | 53.7 |
| Templeton Emerging Mkts Invmt Tr TEMIT (LSE:TEM) | Morningstar EM TME NR | 36.4 | 14.4 |
| Schroder Oriental Income Ord (LSE:SOI) | MSCI AC Asia Pacific ex Japan HDY NR | 27.1 | 14.1 |
| Aberdeen Asian Income Fund Limited (LSE:AAIF) | MSCI AC Asia Pacific ex Japan HDY NR | 22.2 | 11.1 |
| Diverse Income Trust Ord (LSE:DIVI) | Morningstar UK Small Cap TME NR | 23.5 | 6.9 |
| JPMorgan European Growth & Income Ord (LSE:JEGI) | Morningstar DM Eur x UK TME NR | 32.9 | 6 |
| Law Debenture Corporation Ord (LSE:LWDB) | Morningstar UK All Cap TME NR | 28.1 | 5.7 |
| Invesco Asia Dragon Trust Ord (LSE:IAD) | Morningstar Asia x Jpn TME NR | 26.5 | 4 |
| Fidelity Special Values Ord (LSE:FSV) | Morningstar UK All Cap TME NR | 26.4 | 3.1 |
| CC Japan Income & Growth Ord (LSE:CCJI) | Morningstar Japan TME NR | 18.5 | 2.3 |
| TR Property Ord (LSE:TRY) | Morningstar DM Eur Real Est NR | 12.6 | 1.4 |
| Utilico Emerging Markets Ord (LSE:UEM) | Morningstar EM TME NR | 20.1 | -3.1 |
| JPMorgan Global Growth & Income Ord (LSE:JGGI) | Morningstar Global TME NR | 7.3 | -4.8 |
| JPMorgan UK Small Cap Growth & Income (LSE:JUGI) | Morningstar UK Small Cap TME NR | 8.9 | -7.4 |
| Aberforth Smaller Companies Ord (LSE:ASL) | Morningstar UK Small Cap TME NR | 7.9 | -10.8 |
| Henderson Smaller Companies Ord (LSE:HSL) | Morningstar UK Small Cap TME NR | 5 | -12.7 |
| Scottish American Ord (LSE:SAIN) | Morningstar UK Adv Tgt Alloc NR | 2.5 | -13.3 |
| BlackRock Smaller Companies Ord (LSE:BRSC) | Morningstar UK Small Cap TME NR | -0.6 | -19 |
| Montanaro UK Smaller Companies Ord (LSE:MTU) | Morningstar UK Small Cap TME NR | -4.4 | -20.3 |
| Median | 20.1 | 2.3 | |
| Average | 19.7 | 1.6 |
Source: Morningstar. Past performance is not a reliable indicator of future results.
Conclusion
We think the shift in our ratings to value is evidence that a regime change is under way. The average style score of our growth-rated funds has a small tilt to value for the first time, while some very pronounced value strategies are now on the list. Meanwhile, the funds we rated for income last year, which are inherently more value-tilted, did better than the growth funds over 2025.
We highlighted in a recent article that there are relatively few trusts with a pronounced tilt to value left in the investment trust sector after a long period that has favoured growth. In particular, the dearth of value strategies in the European sectors may be why only one trust with a European focus has made it on to our lists this year. There’s always a possibility that the pendulum may swing back again, but we think persistent inflation, geopolitical tensions, and a high need for infrastructure spending for AI and green energy are all factors that suggest finding good value managers could be the way to go for 2026.
Appendix: our methodology
To identify the top growth trusts, we start by looking at performance versus the benchmark. For us, the information ratio is the key metric. This looks at the outperformance of a fund versus an appropriate benchmark and then relates this to the extent of divergence from the benchmark or the extra risk taken. In other words, it seeks to identify whether the active risk relative to the benchmark taken by the manager has been rewarded with outperformance. We pick a benchmark using regression to make sure the best comparator is being used. We then look at the performance of a fund in rising markets, for its benchmark, versus its performance in falling markets — the upside/downside capture ratio. We think this has two attractions. The first is that it reflects the ‘loss aversion’ of the average investor. Behavioural finance teaches us that investors prize avoiding loss more than they do achieving a quantitatively equivalent gain. This is captured by an upside/downside capture ratio above one, which means that the fund has a tendency to avoid losses by a more significant degree than it makes gains in rising markets. The second attraction is that it allows us to consider defensive and aggressive strategies on a more level playing field. A trust that does exceptionally well in rising markets and is level in falling markets could rank the same as a trust that protects very well in falling markets but only keeps up in rising markets.
In order to create fair comparisons between funds, we have divided our universe into ‘super sectors’ of asset classes: large- and mid-cap equity funds, small-cap funds, fixed income or equivalent funds, and property funds. This is intended to reflect the fact that generating alpha, in particular, is much easier in small-caps, so comparing small-cap managers with large-cap managers is unfair. It also overlooks the risks that small-caps bring, such as volatility and illiquidity, which means that it is not inherently superior to large-cap investing despite the advantages with regard to alpha. We rank trusts within their ‘super sector’ on all quantitative metrics, and screen out those with a negative information ratio and which are outside the top quartile for upside/downside capture. In order to reward persistence, we review performance over a five-year time period, which makes it much harder for a single year to distort results. We also exclude trusts that have had a management change in the past three years.
It perhaps goes without saying that all our analysis is based on NAV-total-return performance, which reflects the strategy and decisions made by the manager, rather than share price, which can reflect many other factors. As already discussed, we would never envisage such a rating being used on its own to determine investment decisions. Clearly, with investment trusts, the discount of the shares to NAV, the policies, and the quality of the board all need to be considered, too. As importantly, given that quantitative studies are backwards-looking, investors need to make a judgement about the likelihood of past performance patterns persisting in ever-changing markets. By looking over a long time period, we hope to capture a broader set of market conditions, but some trends last for much longer than five years.
For our income ratings, we start with the screens used for the growth ratings. We then look at current yield and dividend growth over five years. To win the rating, a trust needs to have a 3% yield and 3% per annum dividend growth over the past five years as a minimum, allowing for high-yielding funds and dividend-growth funds to be considered together. Once we have screened out the trusts that don’t meet the yield and dividend-growth tests, we order the trusts by their quantitative score on our growth screens, relaxing the info ratio and upside/downside requirements. We apply the same manager tenure screen. We do sense check the quantitative results and will jump in if we think an exception needs to be made, for example, if a benchmark isn’t appropriate, but our threshold for doing so is exceptionally high, as our intention is to present the numbers, not our opinions.
We also present an alternative income rating in order to analyse the top performers in this relatively new and rapidly growing space, which can’t be analysed in the same way quantitatively because the NAVs are estimated rather than based on market pricing. We think, for the most part, trusts in the infrastructure, renewables, and related sectors are held for a stable and high income, most likely by those living off their income. High yield is likely more important than income growth. We have developed a simple screen showing those trusts that have at least maintained their NAV and their dividend, in nominal terms, over the past five years. With the alternative income space being relatively young, there are not many trusts with a long track record, and just applying these two screens whittles the space down considerably.
Kepler Partners is a third-party supplier and not part of interactive investor. Neither Kepler Partners or interactive investor will be responsible for any losses that may be incurred as a result of a trading idea.
These articles are provided for information purposes only. Occasionally, an opinion about whether to buy or sell a specific investment may be provided by third parties. The content is not intended to be a personal recommendation to buy or sell any financial instrument or product, or to adopt any investment strategy as it is not provided based on an assessment of your investing knowledge and experience, your financial situation or your investment objectives. The value of your investments, and the income derived from them, may go down as well as up. You may not get back all the money that you invest. The investments referred to in this article may not be suitable for all investors, and if in doubt, an investor should seek advice from a qualified investment adviser.
Full performance can be found on the company or index summary page on the interactive investor website. Simply click on the company's or index name highlighted in the article.
Important Information
Kepler Partners is not authorised to make recommendations to Retail Clients. This report is based on factual information only, and is solely for information purposes only and any views contained in it must not be construed as investment or tax advice or a recommendation to buy, sell or take any action in relation to any investment.
This report has been issued by Kepler Partners LLP solely for information purposes only and the views contained in it must not be construed as investment or tax advice or a recommendation to buy, sell or take any action in relation to any investment. If you are unclear about any of the information on this website or its suitability for you, please contact your financial or tax adviser, or an independent financial or tax adviser before making any investment or financial decisions.
The information provided on this website is not intended for distribution to, or use by, any person or entity in any jurisdiction or country where such distribution or use would be contrary to law or regulation or which would subject Kepler Partners LLP to any registration requirement within such jurisdiction or country. Persons who access this information are required to inform themselves and to comply with any such restrictions. In particular, this website is exclusively for non-US Persons. The information in this website is not for distribution to and does not constitute an offer to sell or the solicitation of any offer to buy any securities in the United States of America to or for the benefit of US Persons.
This is a marketing document, should be considered non-independent research and is subject to the rules in COBS 12.3 relating to such research. It has not been prepared in accordance with legal requirements designed to promote the independence of investment research.
No representation or warranty, express or implied, is given by any person as to the accuracy or completeness of the information and no responsibility or liability is accepted for the accuracy or sufficiency of any of the information, for any errors, omissions or misstatements, negligent or otherwise. Any views and opinions, whilst given in good faith, are subject to change without notice.
This is not an official confirmation of terms and is not to be taken as advice to take any action in relation to any investment mentioned herein. Any prices or quotations contained herein are indicative only.
Kepler Partners LLP (including its partners, employees and representatives) or a connected person may have positions in or options on the securities detailed in this report, and may buy, sell or offer to purchase or sell such securities from time to time, but will at all times be subject to restrictions imposed by the firm's internal rules. A copy of the firm's conflict of interest policy is available on request.
Past performance is not necessarily a guide to the future. The value of investments can fall as well as rise and you may get back less than you invested when you decide to sell your investments. It is strongly recommended that Independent financial advice should be taken before entering into any financial transaction.
PLEASE SEE ALSO OUR TERMS AND CONDITIONS
Kepler Partners LLP is a limited liability partnership registered in England and Wales at 9/10 Savile Row, London W1S 3PF with registered number OC334771.
Kepler Partners LLP is authorised and regulated by the Financial Conduct Authority.