Are yields in alternative assets enough to turn investors’ heads?
Kepler examines investment trusts for investors turning to alternatives to boost their income.
14th May 2021 14:39
Kepler examines investment trusts for investors turning to alternatives to boost their income.

This content is provided by Kepler Trust Intelligence, an investment trust focused website for private and professional investors. Kepler Trust Intelligence is a third-party supplier and not part of interactive investor. It is provided for information only and does not constitute a personal recommendation.
Material produced by Kepler Trust Intelligence should be considered a marketing communication, and is not independent research.
The coronavirus pandemic has had a dreadful impact on equity dividends, particularly in the UK market. Between 31 March 2020 and 31 March 2021, UK companies cut their dividends by 41.6% on an underlying basis, according to the latest Link Dividend Monitor.
The cuts have continued into 2021, with a 26.7% fall on an underlying basis in Q1. That said, there was a headline increase of 7.9% thanks to the second-highest special dividends reported, thanks to large payouts from Tesco (LSE:TSCO) and the rallying mining sector. However, Link’s best-case estimate for 2021 growth is still only 5.6% on an underlying basis.
With dividends falling by 44% in 2020 and assuming Link’s growth forecast is on the money, that would leave this year’s underlying dividend payouts circa 41% below the level they entered 2020. On a prospective basis, this would amount to a yield of just 3.3% on the UK market, according to Link’s calculations as of the end of March 2021.
In our recent review of the UK equity income sector, we highlighted how UK equity income investment trusts had managed to protect their payouts well during the crisis, and even in some cases grow them, despite this bloodbath among the underlying companies. The sector has been rewarded with a narrow discount on the whole. However, the scope for dividend growth is clearly limited, particularly if Link is right and dividends do not return to their pre-crisis levels until 2025.
One option for investors is to turn to alternatives to boost their income and perhaps their dividend growth potential. We outline the main options below and ask if the pandemic has impacted dividend potential in alternatives too.
Renewables
The renewable energy sector has been an increasingly popular source of income in recent years. In fact, according to the AIC the £7.7 billion raised in the sector over the past five years is more than that achieved by any other sector. Excluding the trusts which are not yet fully invested and paying a full dividend, the simple average yield on the sector, according to Morningstar data, is 5.9%, almost twice the prospective dividend yield of the FTSE (by Link’s estimates). The average share price premium of these trusts is 7.9%, according to Morningstar. We note that US Solar Fund (LSE:USF)has indicated its intention to pay a 5.5c dividend per share this year, with its portfolio now fully operational, which would make its yield 5.4% if achieved.
Yields and discounts of renewable energy trusts
Source: Morningstar, as of 05/05/2021. Please note dividend yields are historic, and may not apply in the future
In our view, there is some rationality in the pricing of the different sub-sectors. The diversified trusts in the sector have a historic share price yield of 6%, but investors can earn more by investing in either solar specialists, which average a 7% yield (falling to 6.6% including US Solar’s projected dividend), or trusts investing in battery capacity, which yield 6.9%. We believe a higher yield is demanded in this sub-sector on account of the greater variability of income – there is more linkage to the power price. However, for a single sector specialist to yield more also intuitively makes sense to us: investing in a single asset class should earn a higher yield than investing in a diversified pool of assets.
The exception to this pattern is Greencoat UK Wind (LSE:UKW), the wind power specialist, which yields 5.4%, indicating the market is willing to receive a lower return for the risk it is taking. We believe this reflects UKW’s status as the respected elder of this relatively young asset class and the intention to link the dividend to RPI. Launched in July 2013, which makes it the oldest trust in the sector, UKW has delivered on its dividend objective of growing its 6p a share payout by RPI for six consecutive years, and we believe the management team have earned the trust of the market leading to a higher premium. Furthermore, wind power is the more established and impactful of the renewable sources. According to National Grid ESO, 24.8% of the UK’s energy in 2020 came from wind power, compared to just 4.4% from solar.
UK energy consumption in 2020 by source
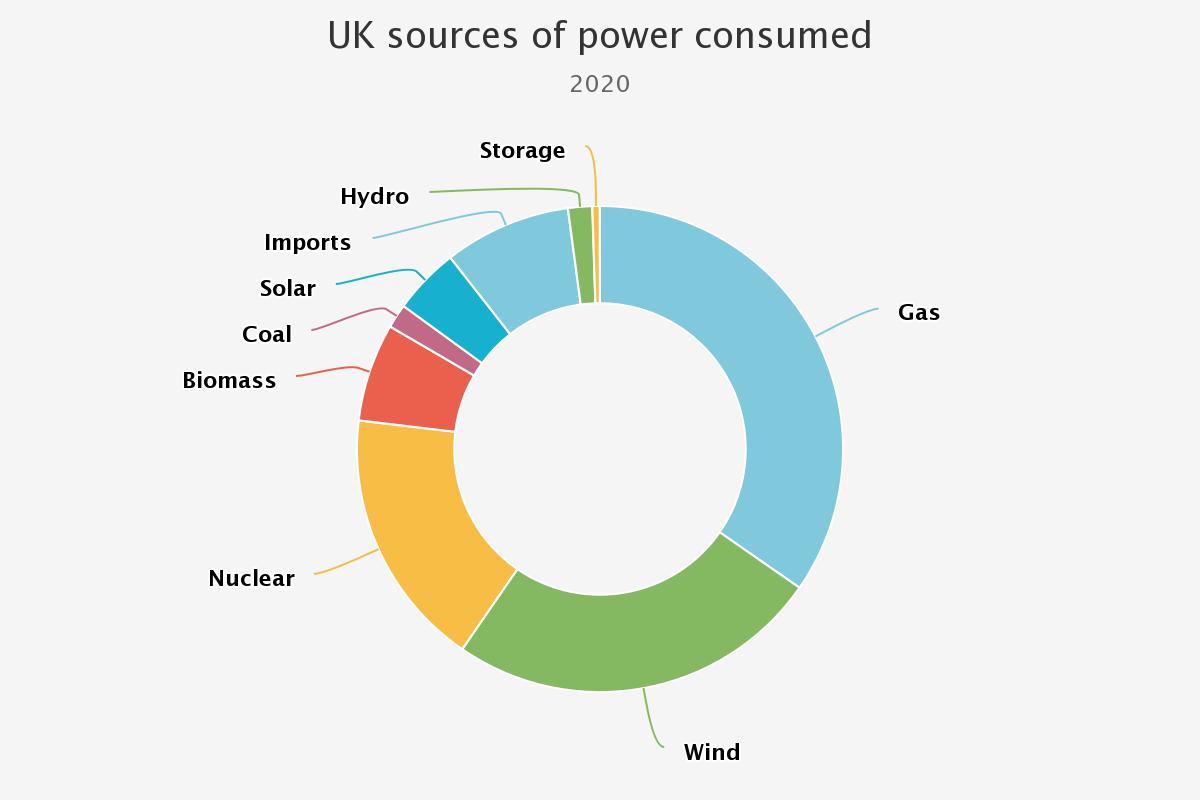
Source: National Grid ESO
One of the key factors behind the outlook for dividend stability and dividend growth in the renewables sector is the wholesale power price, to which the trusts have varying levels of exposure depending on their hedging policy and the mix of assets. Power prices cratered during the first lockdowns last spring, but quickly rebounded. In the first half of 2020 the UK wholesale power price fell to £28 per mwh, having averaged £45 over the previous seven years. A return to lockdowns would therefore be problematic for the renewables trusts for the most part. However, most trusts hedge out at least part of their exposure to future spot power prices, and in the case of US Solar all of it. With vaccines proving extremely effective, it seems unlikely such a return will occur.
UK spot power prices
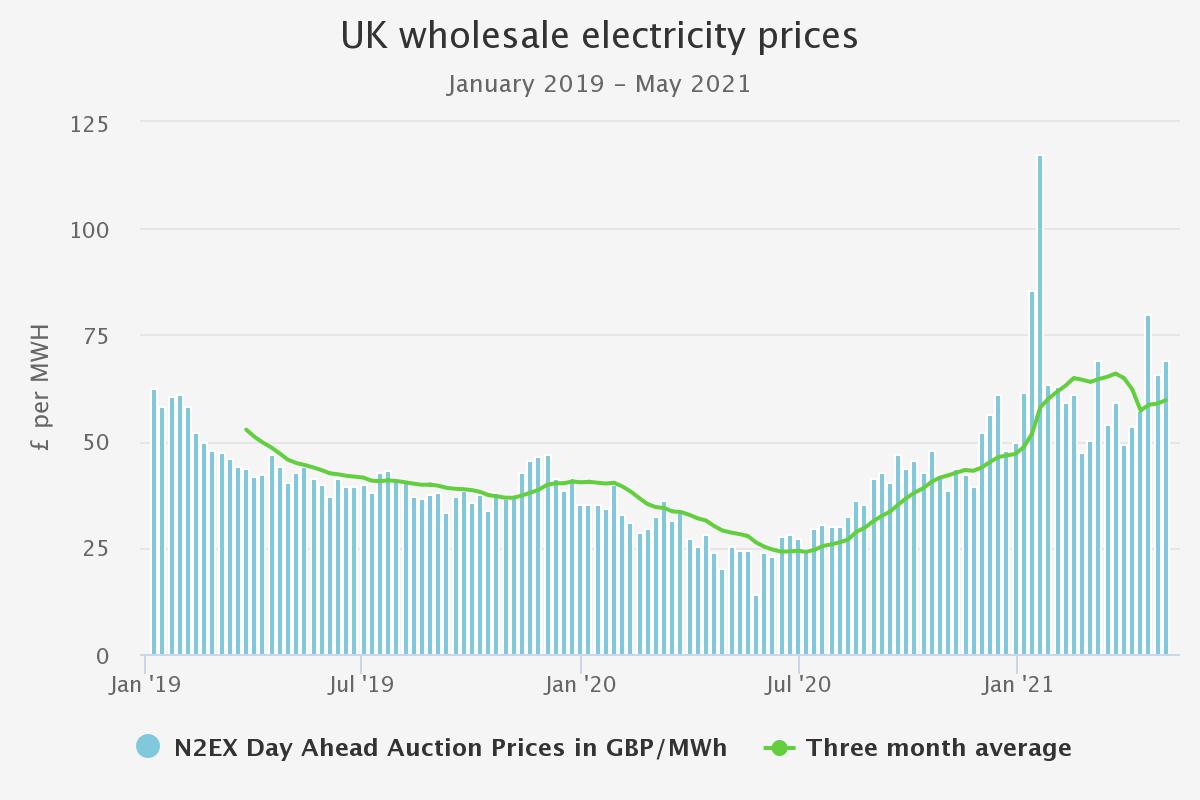
Source: www.nordpoolgroup.com
Lower long-term power prices would be a threat to dividends though. And in a roundabout way the pandemic may have lowered long-term power price expectations due to the huge expansion of renewables which is taking place as governments look to boost a relatively new industry and invest in infrastructure – construction is known to be one of the sectors with the greatest multiplier effect of spending through the economy.
One long-term power price forecast caused some alarm in April this year. The Bloomberg New Energy Foundation predicted the UK spot power price would fall to £16 per mwh by 2030, and rise to £23 by 2050, driven by the build-out of renewables. However, we understand this is out of line from most power price forecasters which see a range of £45-£55 per mwh over the next 30 years. The main point of contention with the BNEF prediction, as we understand it, is that with prices so low the amount of renewables capacity built would be vastly reduced as these prices would struggle to cover operating expenses, let alone capex. As a result, not as much capacity would be built as BNEF projects. We are not power price analysts, but clearly this is an issue to be aware of over the long term, although it seems the risk is perhaps more moderate than this outlier projection would have it. If the market did start to price in a very low long-term power price it would likely be seen in both falling premiums and falls in NAVs. Within the sector, long term power prices is just one of the influencing factors in valuations, and in most cases, inflation linked subsidy payments currently contribute upwards of c. 50% of expected cashflows for many years to come. As such, any reduction in dividends from lower long term power prices may take a while to occur.
The weight of money entering the renewables sector even before the pandemic has led to an increasing move to diversify on the part of boards and investors in the interest of seeking out better returns and a more resilient portfolio.Renewables Infrastructure Group (LSE:TRIG)was the first trust to recognise this, with its stated aim to invest in all types of renewable technologies, and across Europe. In the same diversification vein, we think US Solar Fund (LSE:USF) could also be a valuable addition to a portfolio. The dividends are paid in dollars, so there is some currency risk, but by fixing the price it will take for all of its revenues, there is strong visibility on the underlying income stream. The US is a much larger and geographically diverse country, offering a huge opportunity set in the solar space as the Biden administration chases its net zero goal. Other trusts are widening their geographic focus, including NextEnergy Solar (LSE:NESF)which has until now invested in the UK and Italy, but the managers are looking to broaden out the geographical remit further for new acquisitions in search of better risk-adjusted returns. Dividends are paid in sterling and the trust pays a high yield of 7.1% compared to USF’s 5.4% prospective yield and looks likely to offer more geographical diversity in future.
Infrastructure
Longer term, the infrastructure trusts are also dealing with the implications of the weight of money entering the sector which is pushing down returns available. In the same way, this trend may be strengthened by the pandemic. Firstly, by shifting down the curve of interest rate expectations, and therefore encouraging investors into infrastructure in search of higher returns, including higher yields. Secondly, policy responses can be expected to encompass spending on infrastructure in order to kick-start the economy, which could crowd out private sector investors (depending on where it is directed). As a result, reinvestment risk needs to be watched for long-term dividend sustainability. Cash cover of the dividend is important but, if opportunities for new investments don’t offer the same returns as in the past, boards may have to get ahead of the game and hold or cut dividends.
Another factor affecting dividend cover and outlook is the mix between demand-based and availability-based assets. Availability-based assets pay an income dependent on the asset being available, while the income of a demand-based asset depends on how much it is being used – a toll road is a good example. Demand-based assets generally have suffered due to the drop in economic activity due to the pandemic and the lockdowns, and could have a more uncertain future if the pandemic led to any change in usage frequency.
The table below shows the mature infrastructure trusts, the sources of revenue in the portfolio and the status of the dividend given the impact of the pandemic so far. From company reports to date, BBGI Global Infrastructure seems to have been the least impacted by the pandemic, thanks to its entirely availability-based portfolio. However, Sequoia Economic Infrastructure (SEQI), entirely demand-based, has also managed to increase its dividend, so asset and geography-specific factors have clearly been more important. SEQI has the second-highest dividend yield in the sector, which we expect reflects a risk premium over the more uncertain revenue streams.
Infrastructure sector – yields and discounts
| 12-month yield (%) | Premium (%) | Dividend status | Cash cover (latest dividend) | Revenue sources | |
|---|---|---|---|---|---|
| GCP Infrastructure Investment (LSE:GCP) | 6.9 | -0.3 | Rebased | Uncovered | Mixed |
| Sequoia Economic Infrastructure Inc (LSE:SEQI) | 5.9 | 4.1 | Increased | Expected | Demand |
| HICL Infrastructure (LSE:HICL) | 5 | 8.9 | Held | Uncovered | Mixed |
| International Public Partnerships (LSE:INPP) | 4.4 | 17.3 | Increased | Covered | Mixed |
| BBGI Global Infrastructure (LSE:BBGI) | 4 | 31.6 | Increased | Covered | Availability |
| 3i Infrastructure (LSE:3IN) | 3.2 | 16.3 | Increased | Covered | Mixed |
Source: JPMorgan Cazenove, company announcements as of 06/05/2021. Please note dividend yields are historic, and may not apply in the future
GCP pays the highest yield, and trades around par, without the significant premium the other trusts have been awarded. This also likely reflects uncertainty around the future of the dividend. In 2020 – before the full impact of the pandemic became evident – the trust rebased its dividend from 7.25p to 7p for the 2021 financial year, citing lower interest rates, the ending of the PFI programmes and the wall of money entering the sector as reasons for caution. The dividend is expected to have cover marginally below one for the 2021 financial year, which we expect justifies the lower premium in the eyes of investors.
Thanks to the lower returns generated by demand-based assets during the lockdowns, HICL Infrastructure (LSE:HICL) has held its dividend for the 2021 financial year at 8.25p rather than increasing in line with inflation as it aims to do each year. The board says it expects the dividend to be cash covered, but of course there is some uncertainty given the demand-based portfolio and the possibility – thankfully becoming less likely – of further lockdowns or a slower return to economic normality. The trust updated the market in February and reported that, despite the latest round of lockdowns affecting its investment in the High Speed 1 (Eurotunnel) and two toll roads, the board could reaffirm its dividend for 2021. HICL will publish annual results later in May which should provide further detail and we will be updating our research in the coming weeks. Click here for an alert when it is published.
For greater security of income, a lower yield is available. BBGI has managed to raise the dividend on its availability-based portfolio from 7.18p in 2020 to 7.33p for 2021, and targets further growth to 7.48p in 2022, which it expects to be 1.27 times cash covered. Its yield is lower at 4%, although we note it still bears reinvestment risk. Similarly, IPP and 3i have strong cash cover and project robust dividend increases; they pay among the lowest yields in the sector and in the case of 3i there is a minimal pick-up over equities.
Debt
The debt funds in the closed-ended space offer a variety of interesting and differentiated strategies, many of which pay extremely attractive yields at this moment. It is questionable whether Henderson Diversified Income (HDIV) or Invesco Enhanced Income (IPE) are truly alternatives however, with their portfolios that are similar to the typical open-ended strategic bond fund or high yield fund. Even these more conventional portfolios have some advantages over their open-ended peers though – HDIV has 17% net gearing, which allows it to generate a higher yield for the credit risk taken than an open-ended fund. IPE and CQS New City High Yield (NCYF) also use substantial gearing to generate high yields from portfolios focussed on the high yield space. In the case of NCYF it also has substantial equity exposure. NCYF is not strictly an alternative, although its yield of almost 9% is remarkable and reflects – in our view – the lower liquidity of many of the issues in the portfolio. A closed-ended fund can take this liquidity risk, in size, more easily than an open-ended fund. This, along with the ability to gear, means closed-ended bond funds have greater return potential than open-ended funds in our view, although at the share price level the correlation benefits of fixed income are diluted compared to an open-ended fund. That said, high yield is generally expected to be more correlated to equity markets, so this may not deter investors.
Yields and discounts of AIC debt – loans & bonds sector
Source: JPM Cazenove, AIC, as of 06/05/2021 Please note dividend yields are historic, and may not apply in the future
The ability to invest in more illiquid areas of the market is a key reason why the closed-ended funds may be able to protect their dividends in the light of structural challenges in the fixed income market. The initial impact of the pandemic led to broad selling of credit securities which opened up a huge capital growth opportunity for managers who had the stomach to invest near the bottom of the market. (We note that investing in high yield at the equity market bottom following the 2007/2008 financial crisis was, on a risk-adjusted basis, the best way to play the recovery for a number of years).
Performance of US asset classes after 2009 market bottom
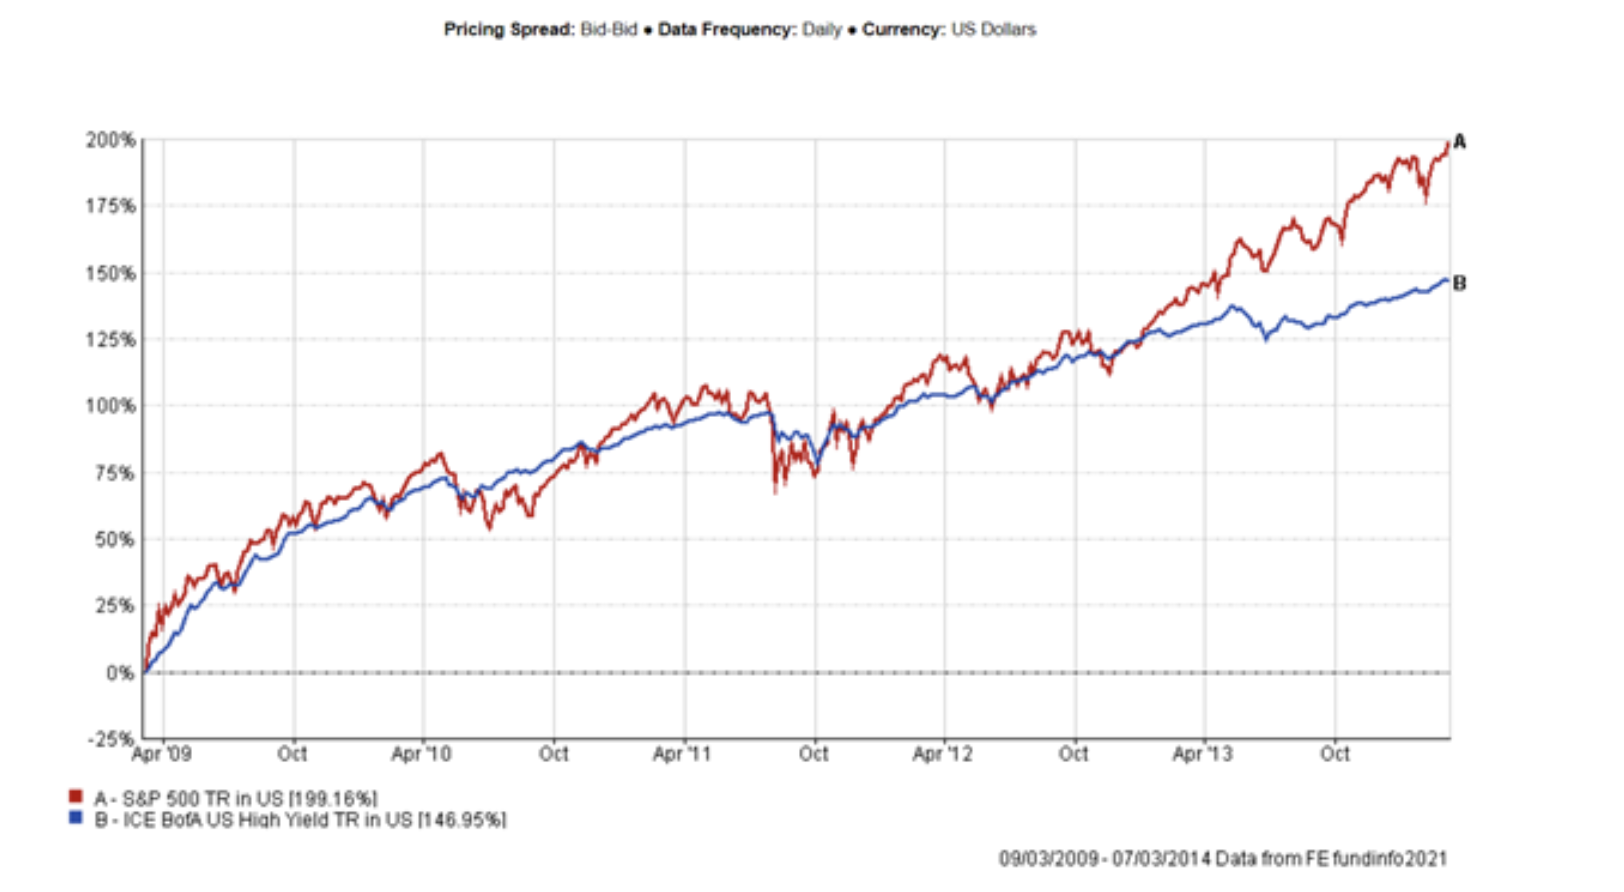
Source: FE Analytics
After this crisis, high yield spreads never reached the extremes seen in 2008. Furthermore, the vaccine rally has already seen credit spreads come in to very tight levels, which means that the opportunity to invest at extreme yields is over. According to the St Louis FRED the latest option-adjusted spread on the US high yield market is down to 3.3%, the lowest since late 2018. This means there is less scope for yield to be made from conventional credit, at least by simply buying the market (although capital gains could add to this, with the high yield spread getting down to 2.46% prior to the 2007 crisis). However, we believe that the flexible mandates in the closed-ended space have a better chance of maintaining and growing their dividends despite the lower returns from credit spread available and despite the outlook for the risk-free rate being lower over the next few years thanks to the need for lower rates to boost the economic recovery.
One of the reasons for our confidence is the wider opportunity set. The closed-ended structure offers the ability to invest in more illiquid areas of the market which the open-ended space can’t. NB Global Monthly Income Fund (LSE:NBMI)adopted a broad mandate last September which allows it to invest in conventional and unconventional credit. This includes fixed and floating rate debt, CLOs and special situations as well as private credit. The private credit market is rarely available to the retail investor and cannot be accessed through a typical open-ended fund. Here borrowers privately arrange debt with large institutional investors like Neuberger Berman, and typically pay a yield premium to save on costs and complications of issuing public bonds. The dividend is set by the board at the start of each financial year, reflecting their expectations for rates and credit spreads. For 2021 it was set at 0.39p a month, or a 5% annualised yield on NAV. This is an ungeared yield, and with the 9.4% discount that the shares currently trade at rises to 5.4%. The annual review could see the targeted dividend lowered in future years, and tighter spreads and low interest rates may make that more likely, although this is offset by the ability of the manager to go off-piste to find higher yields.
While NBMI aims to have a modest allocation to private debt, M&G Credit Income (LSE:MGCI) has a portfolio expected to be more evenly split between public and private – the mix was 50/50 at the time of our last review in March. M&G and Neuberger Berman are large players in the fixed income markets and have extensive resources to bring to bear on private debt arrangements. In the case of M&G, they run a lot of institutional money in the private debt space, and MGCI is intended to switch between private and public debt as the opportunities arise. MGCI targets LIBOR plus 4%, with three regular payments and a higher final payment. A reduction in LIBOR could therefore lead to a lower yield on the margin, although many of the investments will have floors in that will limit the impact.
In our view, the attractions of the flexible mandates of MGCI and NBMI have grown in the post-pandemic period. With rates likely to remain lower than previously expected, yields in conventional fixed income are likely to remain lower too. MGCI and NBMI offer a yield pick-up over conventional fixed income (and equities) without taking on gearing and without taking on excessive credit risk which brings with it correlation to equity markets. Indeed, MGCI aims to have 70% in investment grade.
In the structured finance and direct lending sectors some of the most attractive yields in the investment trust universe are available. Here the investor earns a premium for taking liquidity risk, but we think there is also an extra income earned simply from the complexity. These sectors include strategies which it can take more work to understand and which investors will be rewarded with a greater yield for investing in if they can get comfortable with the risks. We will be looking at this ‘complexity premium’ in more detail in next week’s strategy note. For now, we content ourselves with pointing out that the NAVs of these sectors have been fairly stable through the crisis. In the case of the direct lending sector, we think this may be surprising to some, but it reflects the counter-intuitively defensive characteristics of the sector which we will elaborate on next week.
Yields and discounts of structured finance and direct lending trusts
| 12-month yield (%) | Premium (%) | Association of Investment Companies (AIC) sector | |
|---|---|---|---|
| Chenavari Toro Income Fund Limited (LSE:TORO) | 13.2 | -27.1 | Debt - Structured Finance |
| Marble Point Loan Financing (LSE:MPLF) | 12.2 | -8.4 | Debt - Structured Finance |
| VPC Specialty Lending Investments (LSE:VSL) | 9.2 | -17.3 | Debt - Direct Lending |
| Blackstone Loan Financing Limited (LSE:BGLF) | 8.8 | -10.1 | Debt - Structured Finance |
| Honeycomb Investment Trust (LSE:HONY) | 8.4 | -5 | Debt - Direct Lending |
| Riverstone Credit Opportunities Income (LSE:RCOI) | 8.1 | -16.9 | Debt - Direct Lending |
| Volta Finance (LSE:VTA) | 8 | -13.8 | Debt - Structured Finance |
| BioPharma Credit (LSE:BPCR) | 7.2 | -3.6 | Debt - Direct Lending |
| RM Secured Direct Lending (LSE:RMDL) | 7.1 | -3.3 | Debt - Direct Lending |
| TwentyFour Income (LSE:TFIF) | 7.1 | -4.4 | Debt - Structured Finance |
| UK Mortgages (LSE:UKML) | 6.3 | -10.4 | Debt - Structured Finance |
| GCP Asset Backed Income (LSE:GABI) | 6.3 | -2.5 | Debt - Direct Lending |
Source: Morningstar, as at 05/05/2021. Please note dividend yields are historic, and may not apply in the future
Conclusions
Investors can earn a considerably higher yield in the alternatives sectors than they can in the equity markets. As we have discussed above, the impact of the pandemic on the outlook for income from alternatives has been less negative than it has been on equities. That said, there are long-term issues around the rates to be earned on reinvested capital in the infrastructure and renewables sector which need to be considered, and this may strengthen the case for diversifying across sub-sectors. The lower rates outlook when combined with low-cost gearing should reduce the required return on new investments, although there still looks likely to be a considerable yield pick-up over equities. While fixed income also is likely to offer lower income than it has in the past overall, the flexible mandates in the closed-ended space should have a better chance of generating a higher income than public markets without taking on excessive credit risk – although investors need to be comfortable with liquidity and complexity risks.
Kepler Partners is a third-party supplier and not part of interactive investor. Neither Kepler Partners or interactive investor will be responsible for any losses that may be incurred as a result of a trading idea.
These articles are provided for information purposes only. Occasionally, an opinion about whether to buy or sell a specific investment may be provided by third parties. The content is not intended to be a personal recommendation to buy or sell any financial instrument or product, or to adopt any investment strategy as it is not provided based on an assessment of your investing knowledge and experience, your financial situation or your investment objectives. The value of your investments, and the income derived from them, may go down as well as up. You may not get back all the money that you invest. The investments referred to in this article may not be suitable for all investors, and if in doubt, an investor should seek advice from a qualified investment adviser.
Full performance can be found on the company or index summary page on the interactive investor website. Simply click on the company's or index name highlighted in the article.
Important Information
Kepler Partners is not authorised to make recommendations to Retail Clients. This report is based on factual information only, and is solely for information purposes only and any views contained in it must not be construed as investment or tax advice or a recommendation to buy, sell or take any action in relation to any investment.
This report has been issued by Kepler Partners LLP solely for information purposes only and the views contained in it must not be construed as investment or tax advice or a recommendation to buy, sell or take any action in relation to any investment. If you are unclear about any of the information on this website or its suitability for you, please contact your financial or tax adviser, or an independent financial or tax adviser before making any investment or financial decisions.
The information provided on this website is not intended for distribution to, or use by, any person or entity in any jurisdiction or country where such distribution or use would be contrary to law or regulation or which would subject Kepler Partners LLP to any registration requirement within such jurisdiction or country. Persons who access this information are required to inform themselves and to comply with any such restrictions. In particular, this website is exclusively for non-US Persons. The information in this website is not for distribution to and does not constitute an offer to sell or the solicitation of any offer to buy any securities in the United States of America to or for the benefit of US Persons.
This is a marketing document, should be considered non-independent research and is subject to the rules in COBS 12.3 relating to such research. It has not been prepared in accordance with legal requirements designed to promote the independence of investment research.
No representation or warranty, express or implied, is given by any person as to the accuracy or completeness of the information and no responsibility or liability is accepted for the accuracy or sufficiency of any of the information, for any errors, omissions or misstatements, negligent or otherwise. Any views and opinions, whilst given in good faith, are subject to change without notice.
This is not an official confirmation of terms and is not to be taken as advice to take any action in relation to any investment mentioned herein. Any prices or quotations contained herein are indicative only.
Kepler Partners LLP (including its partners, employees and representatives) or a connected person may have positions in or options on the securities detailed in this report, and may buy, sell or offer to purchase or sell such securities from time to time, but will at all times be subject to restrictions imposed by the firm's internal rules. A copy of the firm's conflict of interest policy is available on request.
Past performance is not necessarily a guide to the future. The value of investments can fall as well as rise and you may get back less than you invested when you decide to sell your investments. It is strongly recommended that Independent financial advice should be taken before entering into any financial transaction.
PLEASE SEE ALSO OUR TERMS AND CONDITIONS
Kepler Partners LLP is a limited liability partnership registered in England and Wales at 9/10 Savile Row, London W1S 3PF with registered number OC334771.
Kepler Partners LLP is authorised and regulated by the Financial Conduct Authority.